. 2017 Mar 3:7:42991.
doi: 10.1038/srep42991.

Astrocyte pathology in a human neural stem cell model of frontotemporal dementia caused by mutant TAU protein

Affiliations

Astrocyte pathology in a human neural stem cell model of frontotemporal dementia caused by mutant TAU protein

Anna-Lena Hallmann et al. Sci Rep. .

Abstract

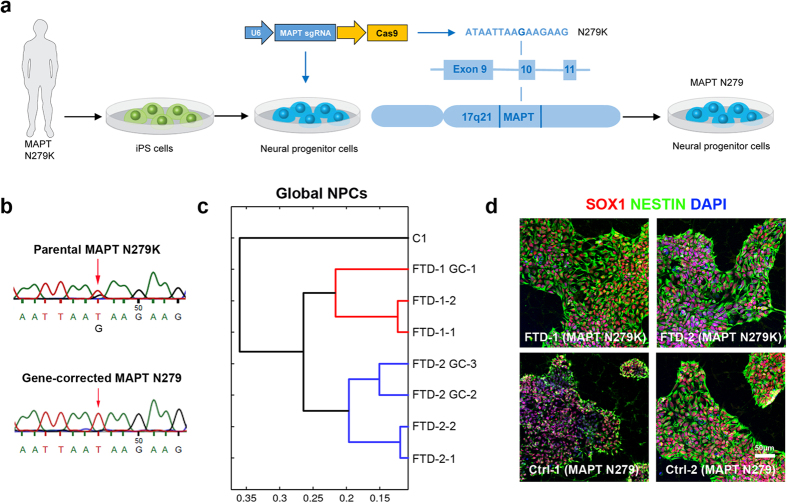
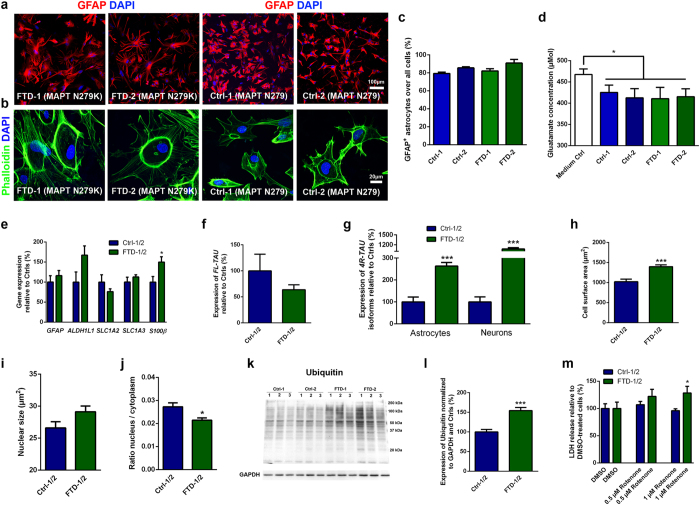
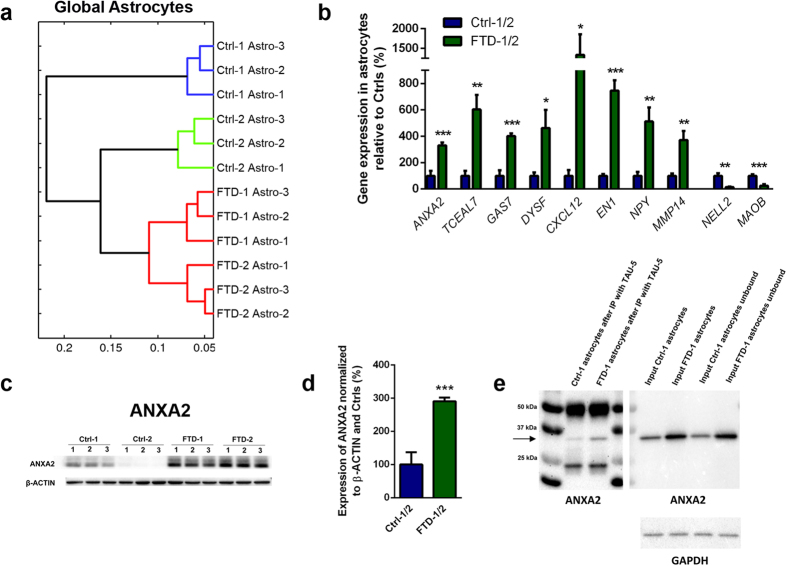
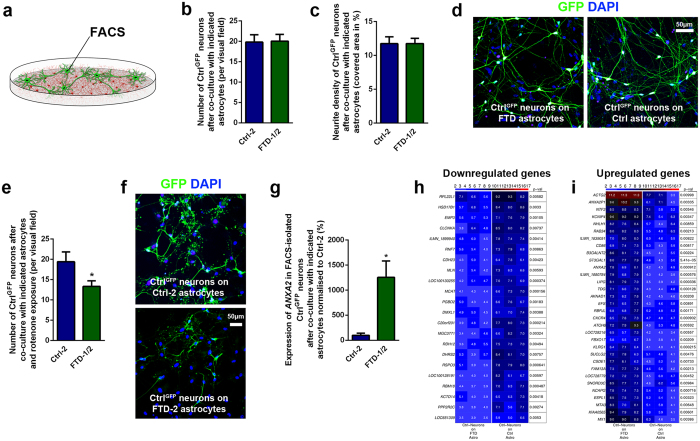
Astroglial pathology is seen in various neurodegenerative diseases including frontotemporal dementia (FTD), which can be caused by mutations in the gene encoding the microtubule-associated protein TAU (MAPT). Here, we applied a stem cell model of FTD to examine if FTD astrocytes carry an intrinsic propensity to degeneration and to determine if they can induce non-cell-autonomous effects in neighboring neurons. We utilized CRISPR/Cas9 genome editing in human induced pluripotent stem (iPS) cell-derived neural progenitor cells (NPCs) to repair the FTD-associated N279K MAPT mutation. While astrocytic differentiation was not impaired in FTD NPCs derived from one patient carrying the N279K MAPT mutation, FTD astrocytes appeared larger, expressed increased levels of 4R-TAU isoforms, demonstrated increased vulnerability to oxidative stress and elevated protein ubiquitination and exhibited disease-associated changes in transcriptome profiles when compared to astrocytes derived from one control individual and to the isogenic control. Interestingly, co-culture experiments with FTD astrocytes revealed increased oxidative stress and robust changes in whole genome expression in previously healthy neurons. Our study highlights the utility of iPS cell-derived NPCs to elucidate the role of astrocytes in the pathogenesis of FTD.


Conflict of interest statement

The authors declare no competing financial interests.

Figures

Figure 1
Figure 1. Generation of human FTD and control neural progenitor cells.
(a) Schematic drawing depicting the genetic correction of the FTD-causing N279K mutation in exon 10 of the MAPT gene in human induced pluripotent stem (iPS) cell-derived neural progenitor cells (NPCs) using CRISPR/Cas9 technology. (b) DNA sequencing electropherograms from genomic DNA of FTD NPCs carrying the heterozygous N279K MAPT mutation and of CRISPR/Cas9-gene-corrected N279 MAPT Ctrl NPCs (clone FTD-1 GC-1). (c) Hierarchical cluster analysis of whole genome expression profiles in FTD and Ctrl NPCs. (d) Immunostaining of FTD and Ctrl NPCs for SOX1 (red) and NESTIN (green). Nuclei were counterstained with DAPI (blue). Scale bar = 50 μm.
Figure 2
Figure 2. Generation of astrocytes from control and FTD NPCs and characterization of disease phenotypes in differentiated FTD astrocytes.
(a) Immunostaining of FTD and Ctrl astrocytes for GFAP (red). Nuclei were counterstained with DAPI (blue). Scale bar = 100 μm. (b) Staining of FTD and Ctrl astrocytes for Phalloidin (green). Nuclei were counterstained with DAPI (blue). Scale bar = 20 μm. (c) Quantification of astrocytic differentiation of FTD and Ctrl NPCs. Data are represented as mean of replicates from three independent differentiation experiments (n = 3 per line) + SEM. (d) Quantification of glutamate uptake in astrocytes. Data are represented as mean of replicates from three independent differentiation experiments (n = 3 per line) + SEM. (e) qRT-PCR expression analysis of astrocyte marker genes in FTD and Ctrl astrocytes. (f) Quantification of full-length TAU (FL-TAU) expression in FTD and Ctrl astrocytes via qRT-PCR. (g) qRT-PCR expression analysis of 4R-TAU isoforms in FTD and Ctrl astrocytes and neurons. (h–j) Quantification of the cell size (h), nuclear size (i) and nucleus/cytoplasm ratio (j) of FTD and Ctrl astrocytes. (k) Western blot expression analysis of ubiquitin in FTD and Ctrl astrocytes. GAPDH was used as loading control. Independent replicates are shown for each line. Images have been cropped using Photoshop software. Full-length blots are presented in Fig. S5a,b. (l) Quantification of ubiquitin in FTD and Ctrl astrocytes. Data in panels e–j and l are represented as mean of replicates from three independent differentiation experiments per line (n = 3 per line; n = 6 per group) + SEM. Student’s t-test was applied for statistical analysis (*p < 0.05, ***p < 0.001). (m) Effect of oxidative stress on FTD and Ctrl astrocyte viability as analyzed by measurement of lactate dehydrogenase (LDH) release after 48 h of rotenone treatment. Data are represented as mean of eight replicates per group (n = 4 per line) + SEM. Student’s t-test was applied for statistical analysis (*p < 0.05).
Figure 3
Figure 3. Transcriptome profiles in FTD and control astrocytes and identification of ANXA2 as an upregulated protein in FTD astrocytes interacting with TAU.
(a) Hierarchical cluster analysis of whole genome expression profiles in FTD and Ctrl astrocytes. (b) qRT-PCR expression analysis of differentially expressed genes in FTD and Ctrl astrocytes. (c) Western blot expression analysis of ANXA2 protein in FTD and Ctrl astrocytes. β-ACTIN was used as loading control. Independent replicates are shown for each line. Images have been cropped using Photoshop software. Full-length blots are presented in Supplementary Fig. S5c,d. (d) Quantification of ANXA2 protein expression in astrocytes. Data in panels b and d are represented as mean of replicates from three independent differentiation experiments (n = 3 per line; n = 6 per group) + SEM. Student’s t-test was performed for statistical analysis (*p < 0.05, **p < 0.01, ***p < 0.001). (e) Co-immunoprecipitation to evaluate interaction of ANXA2 and TAU. TAU-5 antibody was used to immunoprecipitate TAU from protein extracts of Ctrl-1 and FTD-1 astrocytes. TAU-5 immunoprecipitates were analyzed by western blot and probed by ANXA2 antibody. Input fractions were included as controls. GAPDH was used as loading control. Arrow indicates ANXA2 protein. Images have been cropped using Photoshop software. Full-length blots are presented in Supplementary Fig. S5e–g.
Figure 4
Figure 4. Co-culture of control neurons with FTD astrocytes induces alterations in stress response and gene expression profiles.
(a) Schematic drawing demonstrating the co-culture of healthy CtrlGFP neurons (green) with either FTD or Ctrl astrocytes (red). (b,c) Quantification of the number of CtrlGFP neurons (b) and their neurite density (c) after co-culture with either FTD or Ctrl astrocytes. Data are represented as mean of three replicates per line from three independent co-culture experiments (nCtrl = 3, nFTD = 6) + SEM. (d) Fluorescence images showing CtrlGFP neurons cultured on either FTD or Ctrl astrocytes. Nuclei were counterstained with DAPI (blue). Scale bar = 50 μm. (e) Effect of oxidative stress on CtrlGFP neurons after co-culture with either FTD or Ctrl astrocytes as analyzed by the number of surviving neurons after 48 h of rotenone treatment. Data are represented as mean of three replicates per line from three independent co-culture experiments (nCtrl = 3, nFTD = 6) + SEM. Student’s t-test was performed for statistical analysis (*p < 0.05). (f) Fluorescence images showing CtrlGFP neurons cultured on either FTD or Ctrl astrocytes 48 h after treatment with rotenone. Nuclei were counterstained with DAPI (blue). Scale bar = 50 μm. (g–i) CtrlGFP neurons were isolated from FTD or Ctrl astrocytes via FACS and expression analyses were performed. (g) qRT-PCR expression analysis of ANXA2 in FACS-isolated CtrlGFP neurons after co-culture with either FTD or Ctrl astrocytes. Data are represented as mean of three replicates per line from three independent co-culture experiments (nCtrl = 3, nFTD = 6) + SEM. Student’s t-test was performed for statistical analysis (*p < 0.05). (h,i) Heat maps of differentially downregulated (h) and upregulated (i) genes in isolated CtrlGFP neurons with p-values.

References

    1. Boxer A. L. & Miller B. L. Clinical features of frontotemporal dementia. Alzheimer Dis Assoc Disord 19 Suppl 1, S3 (2005). - PubMed
    1. Goedert M. & Spillantini M. G. Pathogenesis of the tauopathies. J Mol Neurosci 45(3), 425 (2011). - PubMed
    1. Noble W., Hanger D. P., Miller C. C. & Lovestone S. The importance of tau phosphorylation for neurodegenerative diseases. Front Neurol 4, 83 (2013). - PMC - PubMed
    1. Ghetti B. et al.. Invited review: Frontotemporal dementia caused by microtubule-associated protein tau gene (MAPT) mutations: a chameleon for neuropathology and neuroimaging. Neuropathol Appl Neurobiol 41(1), 24 (2015). - PMC - PubMed
    1. Di Giorgio F. P., Boulting G. L., Bobrowicz S. & Eggan K. C. Human embryonic stem cell-derived motor neurons are sensitive to the toxic effect of glial cells carrying an ALS-causing mutation. Cell Stem Cell 3(6), 637 (2008). - PubMed

Publication types

MeSH terms