. 2017 Mar 3:7:43153.
doi: 10.1038/srep43153.

Autophagy down regulates pro-inflammatory mediators in BV2 microglial cells and rescues both LPS and alpha-synuclein induced neuronal cell death

Affiliations

Autophagy down regulates pro-inflammatory mediators in BV2 microglial cells and rescues both LPS and alpha-synuclein induced neuronal cell death

Claudio Bussi et al. Sci Rep. .

Abstract

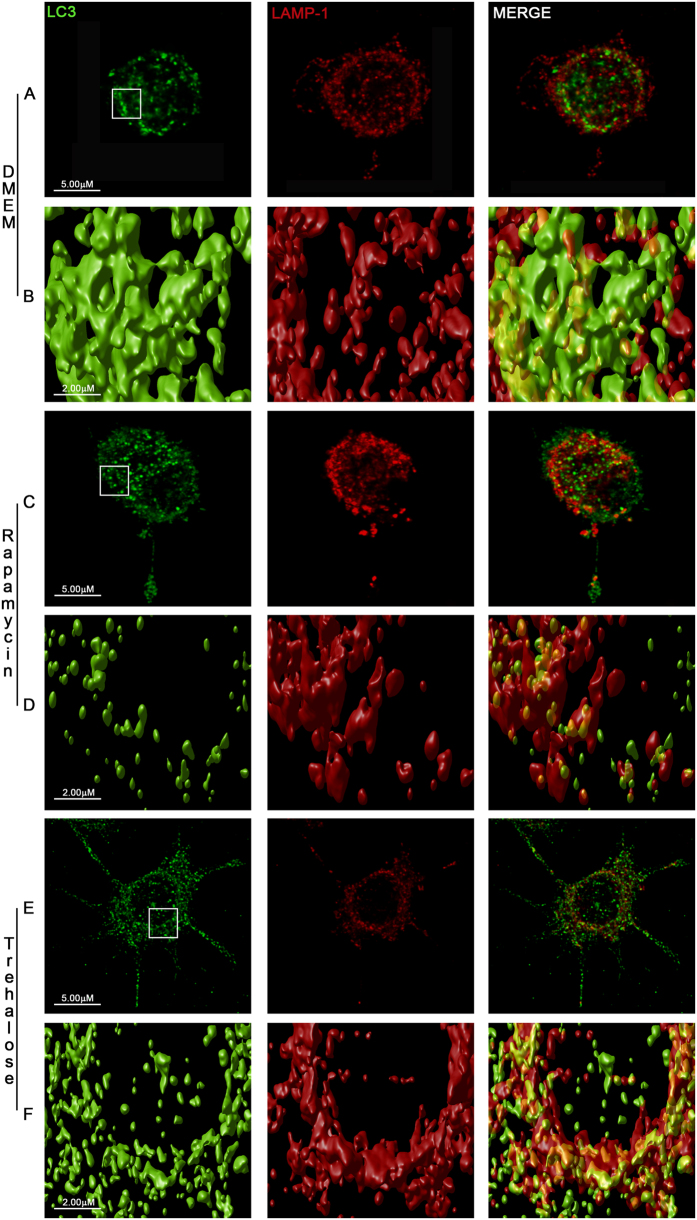
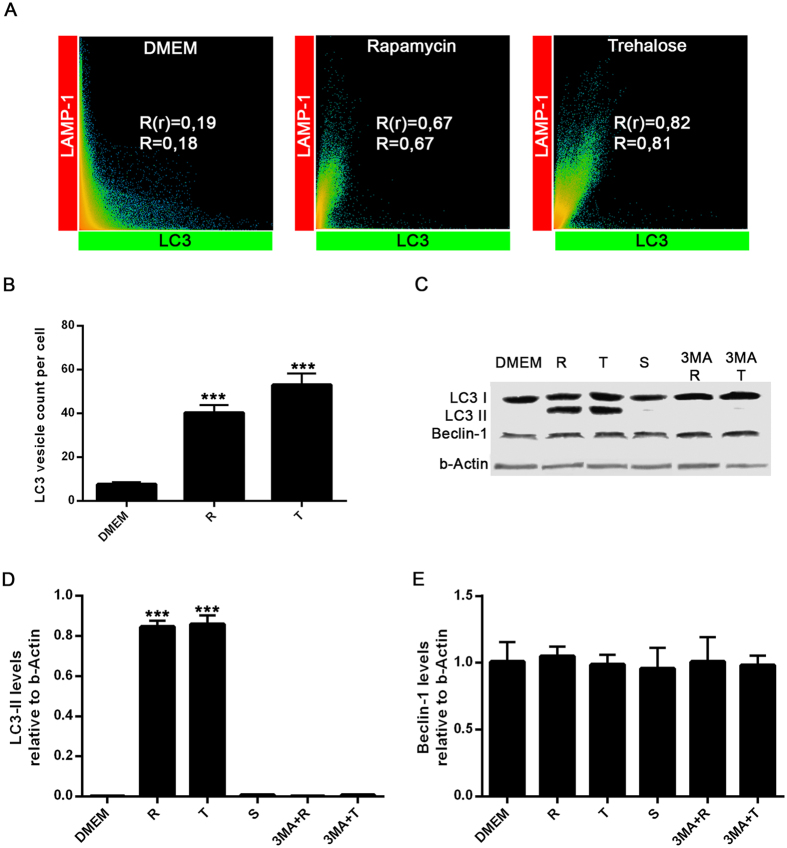
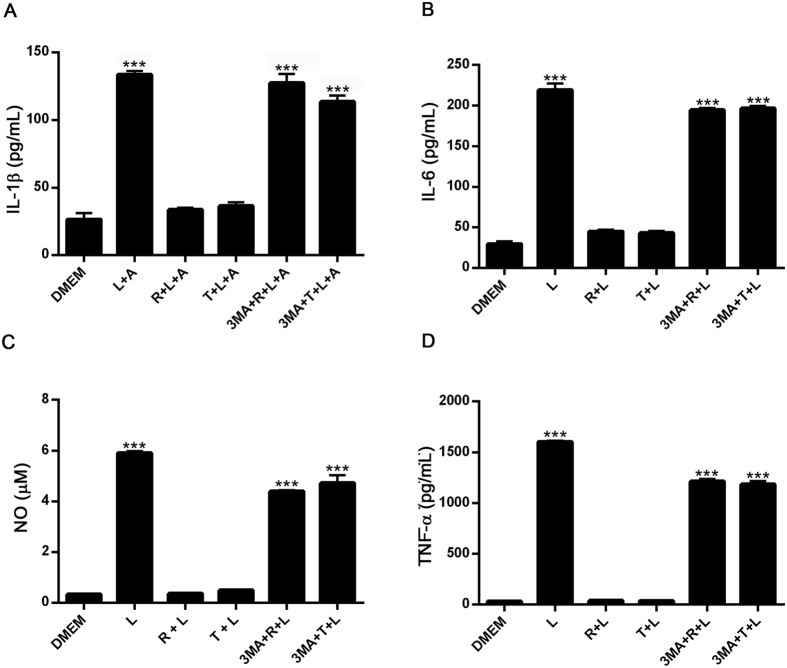
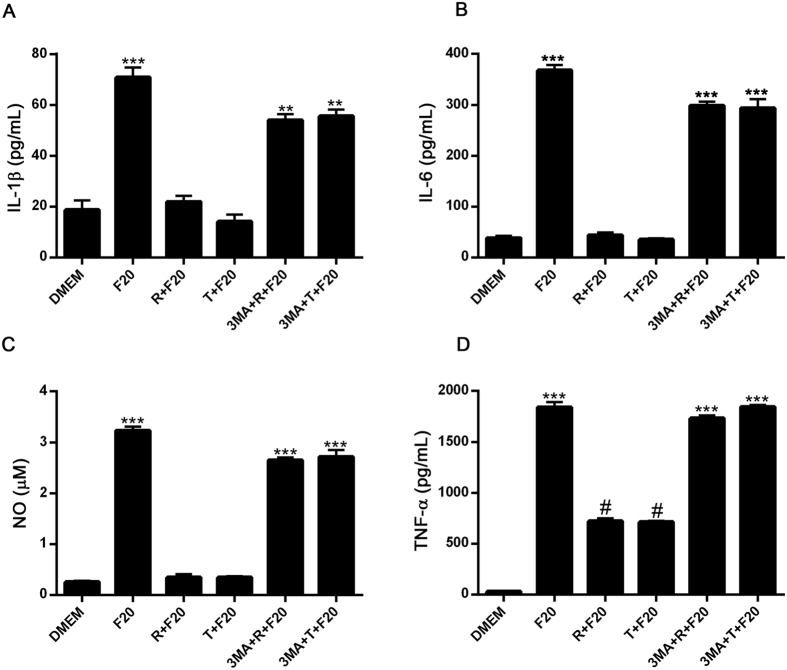
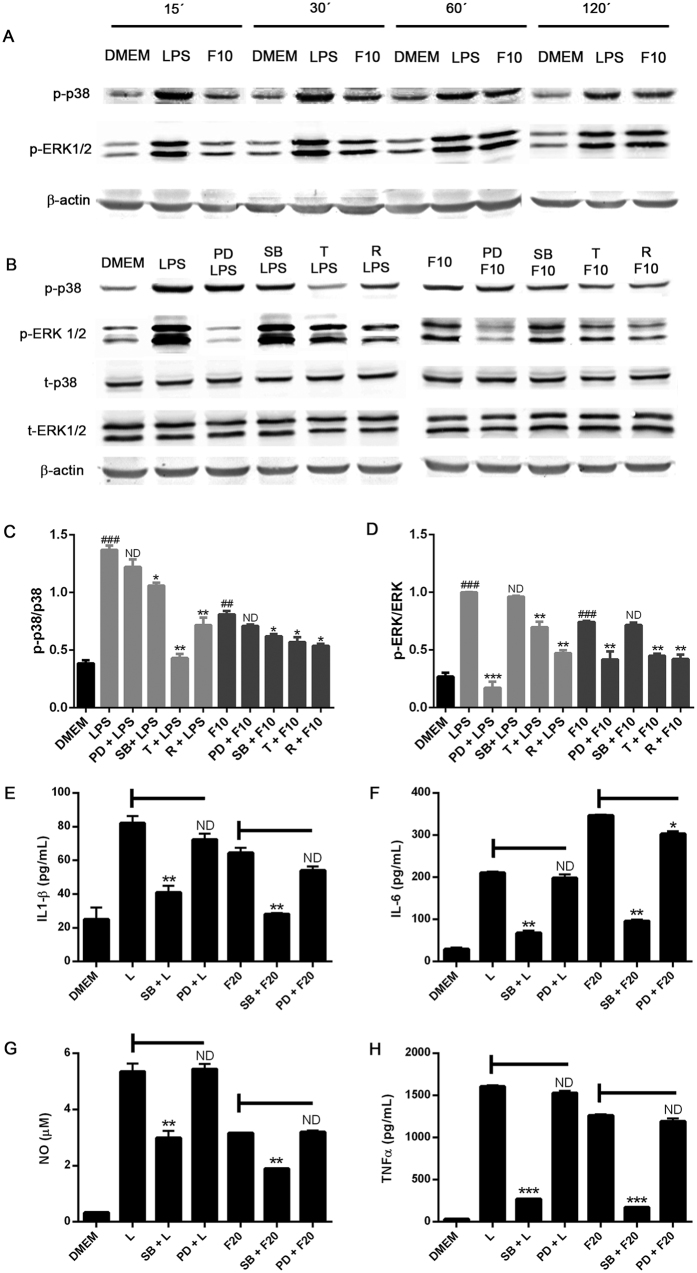
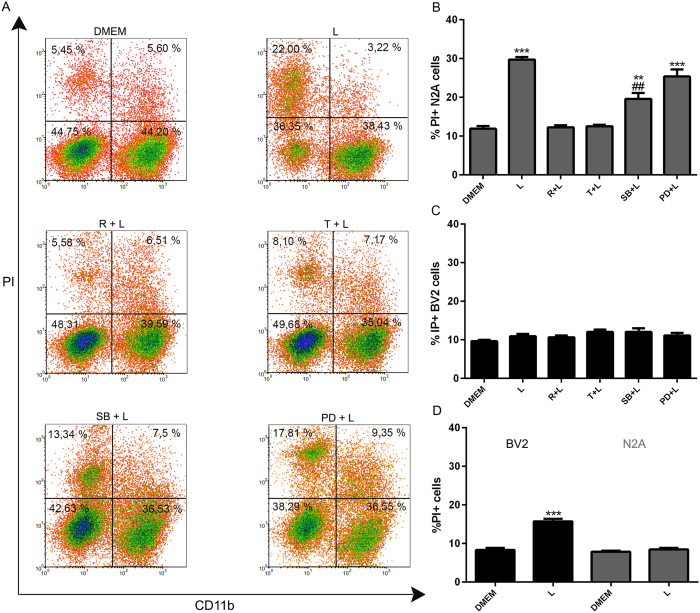
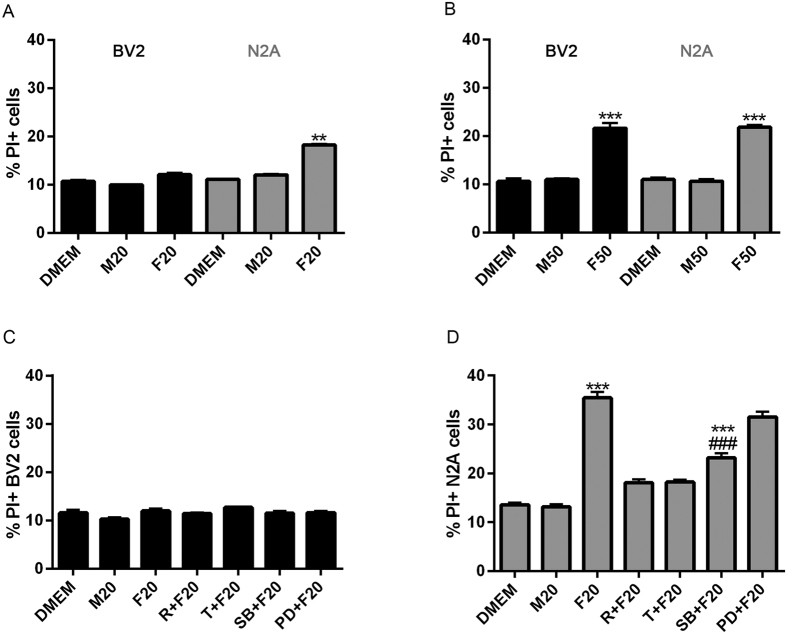
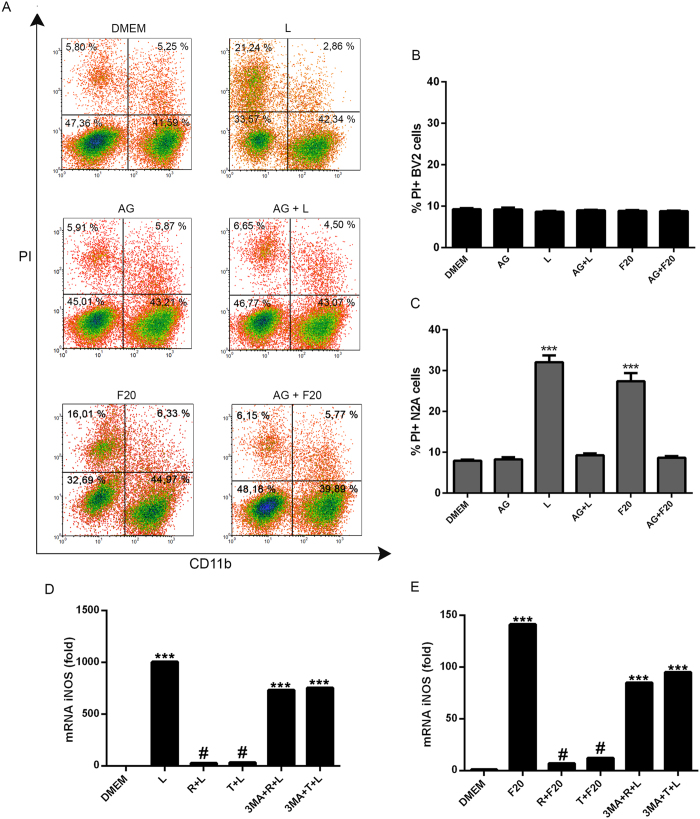
Autophagy is a fundamental cellular homeostatic mechanism, whereby cells autodigest parts of their cytoplasm for removal or turnover. Neurodegenerative disorders are associated with autophagy dysregulation, and drugs modulating autophagy have been successful in several animal models. Microglial cells are phagocytes in the central nervous system (CNS) that become activated in pathological conditions and determine the fate of other neural cells. Here, we studied the effects of autophagy on the production of pro-inflammatory molecules in microglial cells and their effects on neuronal cells. We observed that both trehalose and rapamycin activate autophagy in BV2 microglial cells and down-regulate the production of pro-inflammatory cytokines and nitric oxide (NO), in response to LPS and alpha-synuclein. Autophagy also modulated the phosphorylation of p38 and ERK1/2 MAPKs in BV2 cells, which was required for NO production. These actions of autophagy modified the impact of microglial activation on neuronal cells, leading to suppression of neurotoxicity. Our results demonstrate a novel role for autophagy in the regulation of microglial cell activation and pro-inflammatory molecule secretion, which may be important for the control of inflammatory responses in the CNS and neurotoxicity.


Conflict of interest statement

The authors declare no competing financial interests.

Figures

Figure 1
Figure 1. Autophagy induction in BV2 microglial cells.
BV2 microglial cells were left untreated (A) or stimulated with rapamycin 100 nM (C) or trehalose 30 mM (E). After 24 h, cells were immunostained with anti-LC3B (green) and anti-Lamp-1 (red) antibodies. Images shown are z-stack projections. (B,D and F) are 3D surface-rendered magnifications of the selected area above. A typical LC3 puncta pattern is observed in BV2 stimulated cells (D,F). Merged images show fusion between autophagosomes and lysosomes (yellow).
Figure 2
Figure 2. Evaluation of LC3-II and Beclin-1 levels in BV2 microglial cells.
(A) Scatter plots represent colocalization analyses between LC3B and LAMP-1 using SVI Huygens Essential 14.1 software. Pearson coefficient (R) and Overlap coefficient (R[r]) are listed. (B) LC3 positive vesicles in unstimulated BV2 cells or treated with rapamycin (100 nM) or trehalose (30 mM) were determined using ImageJ particle counting plugin after cell deconvolution (n = 10). (C) BV2 cells incubated with 3-MA (2 mM; a specific inhibitor of autophagy) for 1 h at 37 °C were cultured in the presence or absence of rapamycin (100 nM) or trehalose (30 mM) for 24 h at 37 °C. Cells were lysed, and LC3B, Beclin-1 and β-Actin were examined by Western immunoblotting. Quantification of LC3-II (D) or Beclin-1 (E) from B relative to β-Actin by densitometry (one-way ANOVA followed by Post-Hoc Dunnet’s test; n = 3). Error bars represent SEM (*P < 0.05; **P < 0.01; ***P < 0.001).
Figure 3
Figure 3. Effects of autophagy induction on IL-1β, IL-6, TNFα, and NO production in LPS-stimulated BV2 cells.
BV2 cells incubated with 3-MA (2 mM) for 1 h at 37 °C were cultured in the presence or absence of rapamycin (100 nM) or trehalose (30 mM) for 24 h. After that, microglial cells were stimulated with LPS (0,5 ug/mL) for 24 h and the supernatants were isolated and analyzed by ELISA, for the measurement of IL-1β (A), IL-6 (B) and TNFα (D), respectively. For IL-1β determination, ATP (5 mM) was added for the last 3 h of LPS stimulation. NO levels (C) were determined by Griess assay. Results were analyzed by one-way ANOVA followed by Post-Hoc Dunnet’s test; n = 3. Error bars represent SEM (***P < 0.001). L = LPS, R = rapamycin, T = trehalose, A = ATP.
Figure 4
Figure 4. Effects of autophagy induction on IL-1β, IL-6, TNF-α, and NO production in alpha-synuclein-stimulated BV2 cells.
BV2 cells incubated with 3-MA (2 mM) for 1 h at 37 °C were cultured in the presence or absence of rapamycin (100 nM) or trehalose (30 mM) for 24 h. After that, microglial cells were stimulated with alpha-synuclein fibers (20 uM) for 24 h and the supernatants were isolated and analyzed by ELISA, for the measurement of IL1-β (A), IL-6 (B) and TNFα (D), respectively. For IL-1β determination, ATP (5 mM) was added for the last 3 h of alpha-synuclein stimulation. NO levels (C) were determined by Griess assay. Results were analyzed by one-way ANOVA followed by Post-Hoc Dunnet’s test; n = 3. Error bars represent SEM (***P < 0.001). F20 = alpha-synuclein fibers (20 uM), R = rapamycin, T = trehalose.
Figure 5
Figure 5. Autophagy modulation of p38 and ERK signalling in LPS and α-synuclein-stimulated BV2 microglial cells.
(A) BV2 cells were stimulated with LPS (0,5 ug/mL) or alpha-synuclein fibers (10 uM) for 15 to 120 minutes. (B) BV2 cells were cultured in the presence or absence of PD98059 (50 uM) SB202190 (20 uM) for 1 h or treated with rapamycin (100 nm) or trehalose (30 mM) for 24 h. After that, microglial cells were stimulated with LPS (0,5 ug/mL) or alpha-synuclein fibers (10 uM) for 30 and 60 minutes, respectively. Cells were lysed and p38, p-p38, ERK1/2, p-ERK1/2 and b-actin levels were analysed by Western immunoblotting. Quantification by densitometry of p-p38 (C) or p-ERK1/2 (D) from B relative to p38 or ERK1/2, respectively. (One-way ANOVA followed by Post-Hoc Dunnet’s test; n = 3). Error bars represent SEM (*P < 0.05; **P < 0.01) (###P < 0.001 compared to DMEM). BV2 cells were cultured in the presence or absence of SB (20 uM) or PD (50 uM) for 1 h at 37 °C. After that, microglial cells were stimulated with LPS (0,5 ug/mL) or α-synuclein fibers (20 uM) for 24 h and the supernatants were isolated and analyzed by ELISA, for the measurement of IL-1β (E), IL-6 (F) and TNF-α (H), respectively. NO levels (G) were determined by Griess assay. Results were analyzed by one-way ANOVA followed by Post-Hoc Dunnet’s test; n = 3. Error bars represent SEM (***P < 0.001). L = LPS, R = rapamycin, T = trehalose, F10 = alpha-synuclein fibers 10 uM, F20 = α-synuclein fibers 20 uM.
Figure 6
Figure 6. Modulation of LPS-induced neuronal cell death by inducing microglial autophagy.
(A) BV2 and N2A cells were co-cultured in a 1:1 ratio and left untreated or stimulated with LPS for 48 h. Firstly, BV2 microglial cells were treated with rapamycin, trehalose, SB202190 (20 uM) or PD98059 (50 uM). After 24 h, BV2 cells were co-cultured with N2A cells and stimulated with LPS for 48 h. After that, cell death was evaluated using propidium iodide (PI) combined with anti-CD11b staining and subsequent flow cytometric analysis. (B–D) Percentages of neuronal CD11b−/IP+ and microglial CD11b+/IP+ cell death were determined and analyzed statistically by one-way ANOVA followed by Post-Hoc Dunnet’s test; n = 3. Error bars represent SEM (***P < 0.001, **P < 0.01); (##P < 0.01 compared to LPS) (L = LPS, R = rapamycin, T = trehalose). (D) BV2 cells alone or N2A alone treated with LPS.
Figure 7
Figure 7. Effects of autophagy induction on alpha-synuclein-induced neuronal cell death.
BV2 or N2A cells were stimulated with α-synuclein monomers or fibers for 48 h at 20 uM (A) or 50 uM (B) and cell death was determined using propidium iodide staining followed by flow cytometric analysis. BV2 and N2A cells were co-cultured in a 1:1 ratio and left untreated or stimulated with alpha-synuclein monomers or fibers for 48 h at 20 uM (C,E). The influence of microglial autophagy on neuronal cell survival was analyzed treating BV2 cells with rapamycin or trehalose before co-culture stimulation. After 48 h of stimulation, cell death in co-cultured cells was determined by flow cytometry. Results were analyzed by one-way ANOVA followed by Post-Hoc Dunnet’s test; n = 3. Error bars represent SEM (*P < 0.05; **P < 0.01; ***P < 0.001). M20 = α-synuclein monomers 20 uM, F20 = alpha-synuclein fibers 20 uM, M50 = alpha-synuclein monomers 50 uM, F50 = α-synuclein fibers 50 uM, R = rapamycin, T = trehalose.
Figure 8
Figure 8. Participation of NO in LPS- and alpha-synuclein-induced neuronal cell death.
(A) Microglial and neuronal co-cultures were stimulated with LPS or left untreated for 48 h. Co-cultures incubated with aminoguanidine (90 uM) for 1 h at 37 °C were cultured in the presence or the absence of LPS or alpha-synuclein fibers for 48 h and, respectively. After that, cell death was determined by flow cytometry. Percentages of microglial CD11b+/IP+ (B) and neuronal CD11b−/IP+ (C) cell death were determined and analyzed statistically by one-way ANOVA followed by Post-Hoc Dunnet’s test; n = 3. Error bars represent SEM (***P < 0.001). L = LPS, R = rapamycin, T = trehalose. BV2 cells incubated with 3-MA (2 mM) for 1 h at 37 °C were cultured in the presence or absence of rapamycin (100 nM) or trehalose (30 mM) for 24 h. After that, microglial cells were stimulated with LPS (D) or alpha-synuclein fibers (E) for 24 h. iNOS mRNA expression was calculated by qPCR using the comparative Ct method, relative to the housekeeping gene RPLP0 and the reference sample, DMEM (n = 3); data presented as fold change (2−ΔΔCt). Results were analyzed by one-way ANOVA followed by Post-Hoc Dunnet’s test. Error bars represent SEM (***P < 0.001). L = LPS, R = rapamycin, T = trehalose, F20 = alpha-synuclein fibers 20 uM.

References

    1. Mizushima N. & Komatsu M. Autophagy: renovation of cells and tissues. Cell 147, 728–741, doi: S0092-8674(11)01276-1 10.1016/j.cell.2011.10.026 (2011). - DOI - PubMed
    1. Parzych K. R. & Klionsky D. J. An overview of autophagy: morphology, mechanism, and regulation. Antioxid Redox Signal 20, 460–473, doi: 10.1089/ars.2013.5371 (2014). - DOI - PMC - PubMed
    1. Rabinowitz J. D. & White E. Autophagy and metabolism. Science 330, 1344–1348, doi: 330/6009/1344 10.1126/science.1193497 (2010). - DOI - PMC - PubMed
    1. Wei Y., Pattingre S., Sinha S., Bassik M. & Levine B. JNK1-mediated phosphorylation of Bcl-2 regulates starvation-induced autophagy. Mol Cell 30, 678–688, doi: S1097-2765(08)00389-4 10.1016/j.molcel.2008.06.001 (2008). - DOI - PMC - PubMed
    1. Decressac M. et al.. TFEB-mediated autophagy rescues midbrain dopamine neurons from alpha-synuclein toxicity. Proc Natl Acad Sci USA 110, E1817–1826, doi: 1305623110 10.1073/pnas.1305623110 (2013). - DOI - PMC - PubMed

Publication types

LinkOut - more resources