. 2017 Mar 3:7:43249.
doi: 10.1038/srep43249.

Limitations and challenges of genetic barcode quantification

Affiliations

Limitations and challenges of genetic barcode quantification

Lars Thielecke et al. Sci Rep. .

Abstract

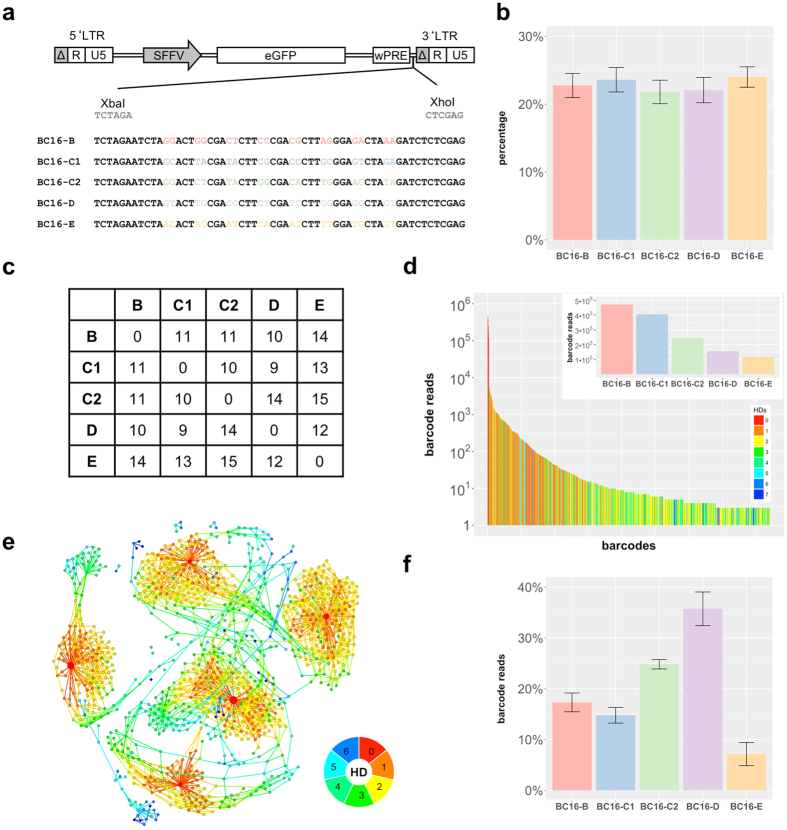
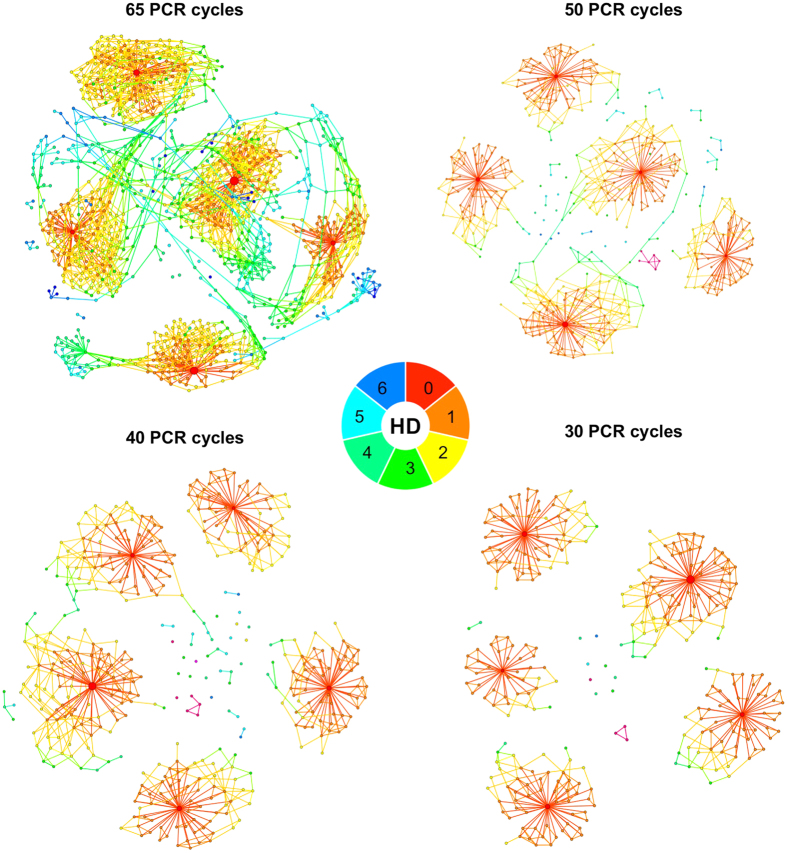
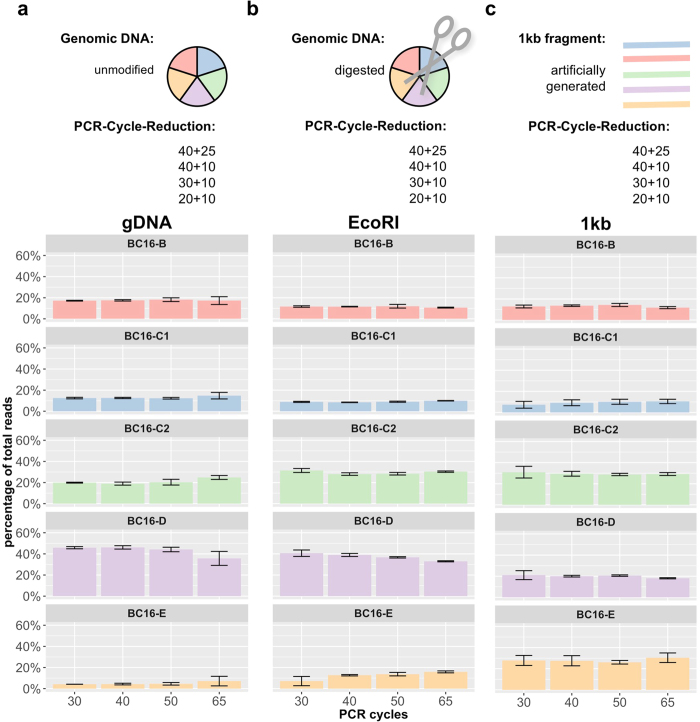
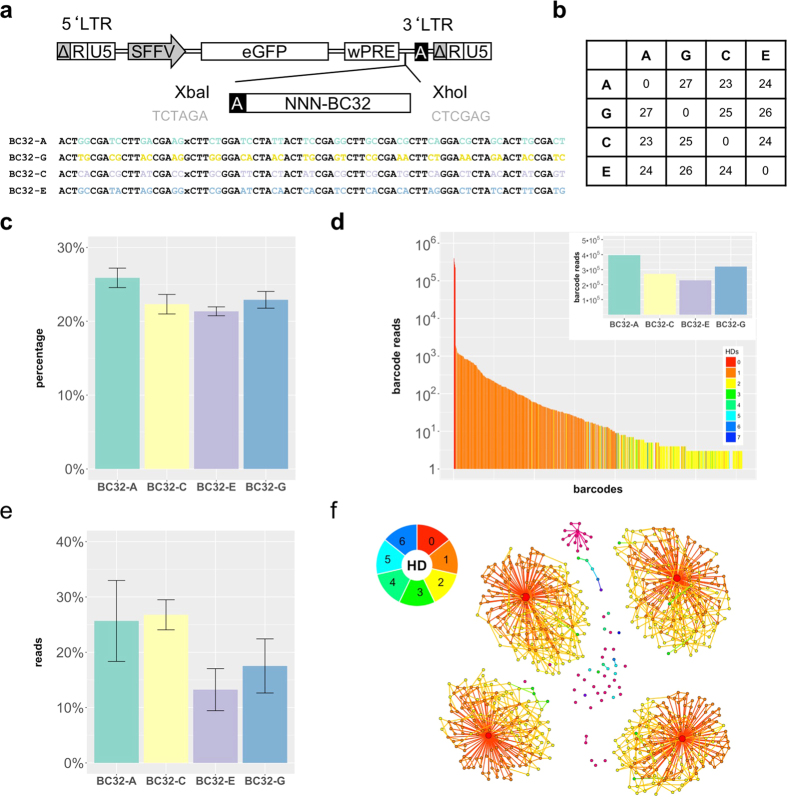
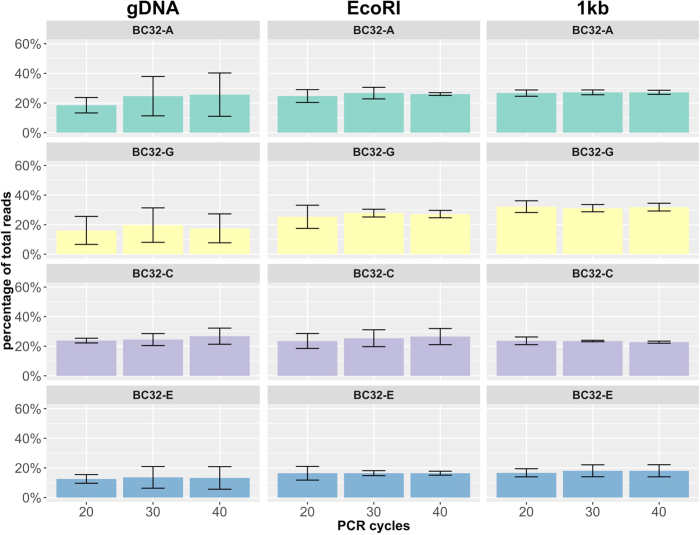
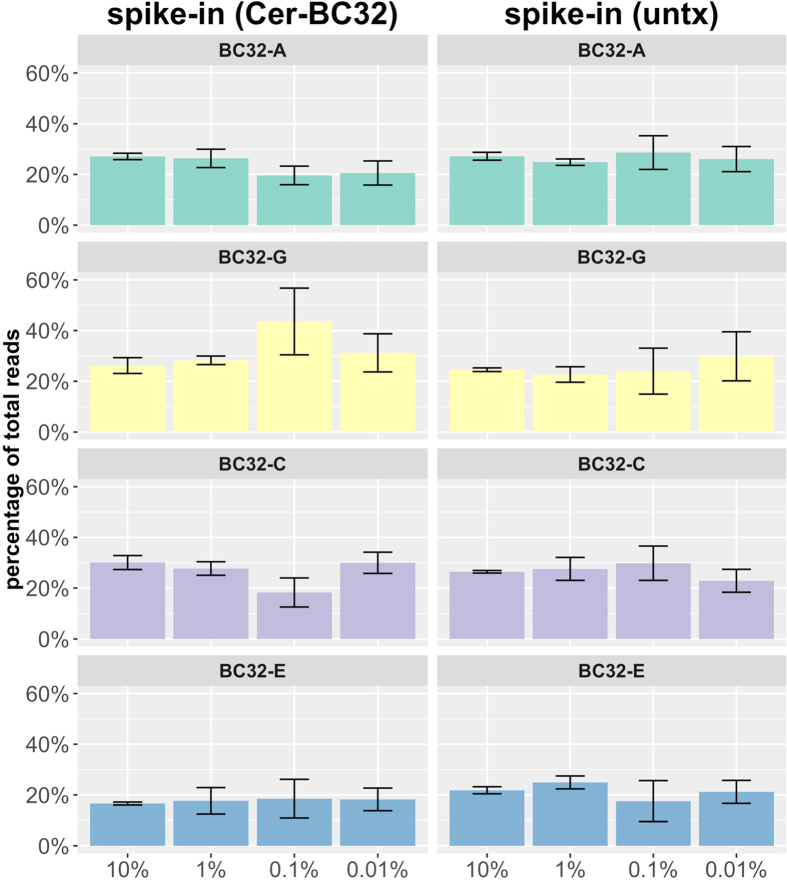
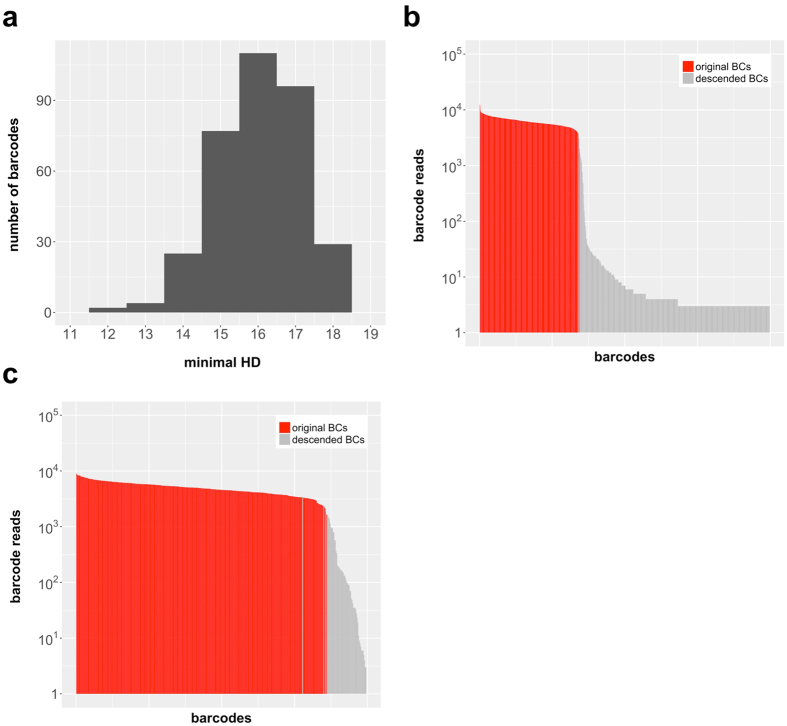
Genetic barcodes are increasingly used to track individual cells and to quantitatively assess their clonal contributions over time. Although barcode quantification relies entirely on counting sequencing reads, detailed studies about the method's accuracy are still limited. We report on a systematic investigation of the relation between barcode abundance and resulting read counts after amplification and sequencing using cell-mixtures that contain barcodes with known frequencies ("miniBulks"). We evaluated the influence of protocol modifications to identify potential sources of error and elucidate possible limitations of the quantification approach. Based on these findings we designed an advanced barcode construct (BC32) to improved barcode calling and quantification, and to ensure a sensitive detection of even highly diluted barcodes. Our results emphasize the importance of using curated barcode libraries to obtain interpretable quantitative data and underline the need for rigorous analyses of any utilized barcode library in terms of reliability and reproducibility.


Conflict of interest statement

The authors declare no competing financial interests.

Figures

Figure 1
Figure 1. BC16 construct.
(a) BC16 barcodes were introduced in front of the 3′ LTR of the LeGO vector. They consist of 16 random nucleotides separated by fixed triplets. (b) Results of the quantitative digital droplet PCR (ddPCR) which was performed directly after generating the miniBulks. (c) Overview of the minimal HD of the picked barcodes. (d) The frequency plot of one particular miniBulk depicts all identified barcodes (on a log scale) with more than two reads in a descending order. Every barcode is coloured according to its minimal HD to one of the original barcodes. The frequencies of the original five barcodes are depicted in the inset. (e) Sequence similarities visualized with a network based graph (ripple plot). Barcodes are represented as nodes, sequence similarities of HD = 1 between two barcodes are visualized as links and node sizes reflect read counts. The minimal HD of each barcode to one of the original barcodes is again color-coded according to the depicted legend. (f) The average abundance of all original barcodes over all replicates after 65 cycles of PCR.
Figure 2
Figure 2. Influence of different PCR-cycle quantities – BC16.
Influence of a decreasing number of PCR cycles on the generation of descendent barcodes visualized as a network based graph (ripple plot). Barcodes are represented as nodes, sequence similarities with a HD = 1 are visualized as links and node sizes reflect read counts. The minimal nucleotide differences between each barcode and one of the original barcodes is color-coded as shown in the legend. Original barcodes are “red” (HD = 0), descended barcodes with a HD = 1 are “orange” and so on as depicted in the color scale. Shown is a PCR cycle reduction without restriction enzyme treatment.
Figure 3
Figure 3. PCR protocol modifications – BC16.
Every barcode mixture was analysed using a successive reduction of PCR cycle numbers from 65 down to 30 PCR cycles in combination with different sample preparation strategies, namely the (a) standard protocol (gDNA), (b) an improved protocol with an additional restriction digest (EcoRI) and (c) a totally artificial protocol consisting of previously build and afterwards mixed 1 kb long DNA fragments (1 kb). The relative average barcode abundances of all miniBulk replicates are shown as barplots.
Figure 4
Figure 4. BC32 construct.
(a) The LeGO-vectors were additionally equipped with the second Illumina adaptor and dedicated restriction enzyme recognition sites. The barcodes consist of 32 random nucleotides separated by fixed triplets. (b) Overview of the minimal HD of the picked barcodes. (c) Quantitative ddPCR based on integration sites was performed directly after generating the miniBulks. (d) The frequency plot of one particular miniBulk depicts all identified barcodes with more than two reads (log scale). Every barcode is colored according to its minimal HD to one of the five original barcodes. The original four barcodes are depicted in the inset. (e) The average abundance of all four original barcodes over all miniBulk replicates after 40 cycles of PCR (standard protocol, gDNA). (f) Sequence similarities are visualized with a network based graph (ripple plot). Barcodes are represented as nodes, sequence similarities of a HD = 1 between two barcodes are visualized as links and node sizes reflect read counts. The minimal HD of each barcode to one of the original barcodes is color-coded according to the depicted legend.
Figure 5
Figure 5. PCR protocol modifications – BC32.
Every barcode mixture was analysed using a successive reduction of PCR cycle numbers from 40 down to 20 PCR cycles in combination with different sample preparation strategies, namely the standard protocol (gDNA), an improved protocol with an additional restriction digest (EcoRI) and a totally artificial protocol consisting of previously build and afterwards mixed 1 kb long DNA fragments (1 kb). Depicted are the average barcode abundances including their standard deviation of all miniBulk replicates.
Figure 6
Figure 6. Spike-in experiments – BC32.
In a dilution series, the four BC32 cell clones are mixed into non-transduced (untx) and also barcode-transduced HEK293T cells (Cer-BC32) to obtain mixtures containing 10%, 1%, 0.1% and 0.01% of each clone. The average barcode abundances in the replicates are visualized as barplots including their standard deviation. Only the relative read counts of the four original barcodes are analysed.
Figure 7
Figure 7. ABC-library.
(a) Minimal HD distribution of the chosen barcodes of the annotated barcode library (ABC library). (b) Sequenced plasmid library shows balanced barcode frequencies and 341 of 343 barcodes in total. (c) Sequencing results of a barcode transduced test batch of 3T3 cells also show balanced barcode frequencies and again 341 of 343 barcodes in total.

References

    1. Drize N. J. J. R. K. & Chertkov J. L. Local clonal analysis of the hematopoietic system shows that multiple small short-living clones maintain life- long hematopoiesis in reconstituted mice. Annu. Rev. Med. 47, 11–20 (1996). - PubMed
    1. Jordan C. T. & Lemischka I. R. Clonal and systemic analysis of long-term hematopoiesis in the mouse. Genes Dev. 4, 220–232 (1990). - PubMed
    1. Chudakov D. M., Matz M. V., Lukyanov S. & Lukyanov K. A. Fluorescent proteins and their applications in imaging living cells and tissues. Physiol Rev 90, 1103–1163, doi: 10.1152/physrev.00038.2009 (2010). - DOI - PubMed
    1. Weber K. et al.. RGB marking facilitates multicolor clonal cell tracking. Nat Med 17, 504–509, doi: 10.1038/nm.2338 (2011). - DOI - PubMed
    1. Cornils K. et al.. Multiplexing clonality: combining RGB marking and genetic barcoding. Nucleic Acids Res 42, e56, doi: 10.1093/nar/gku081 (2014). - DOI - PMC - PubMed

Publication types