. 2017 Mar 3:7:43315.
doi: 10.1038/srep43315.

An inflammatory gene signature distinguishes neurofibroma Schwann cells and macrophages from cells in the normal peripheral nervous system

Affiliations

An inflammatory gene signature distinguishes neurofibroma Schwann cells and macrophages from cells in the normal peripheral nervous system

Kwangmin Choi et al. Sci Rep. .

Abstract

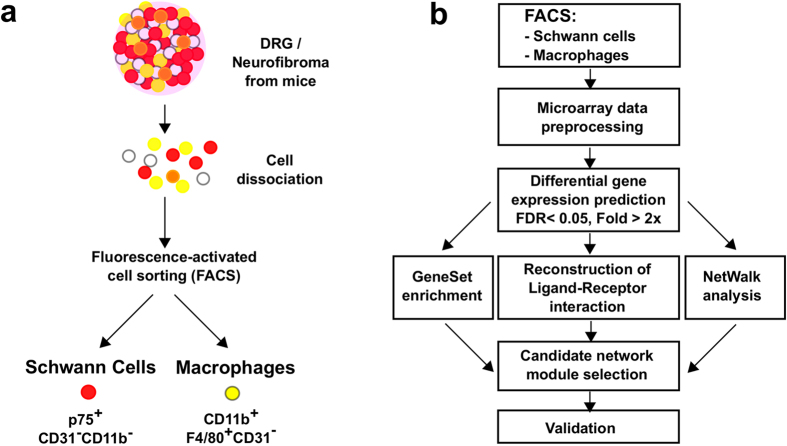
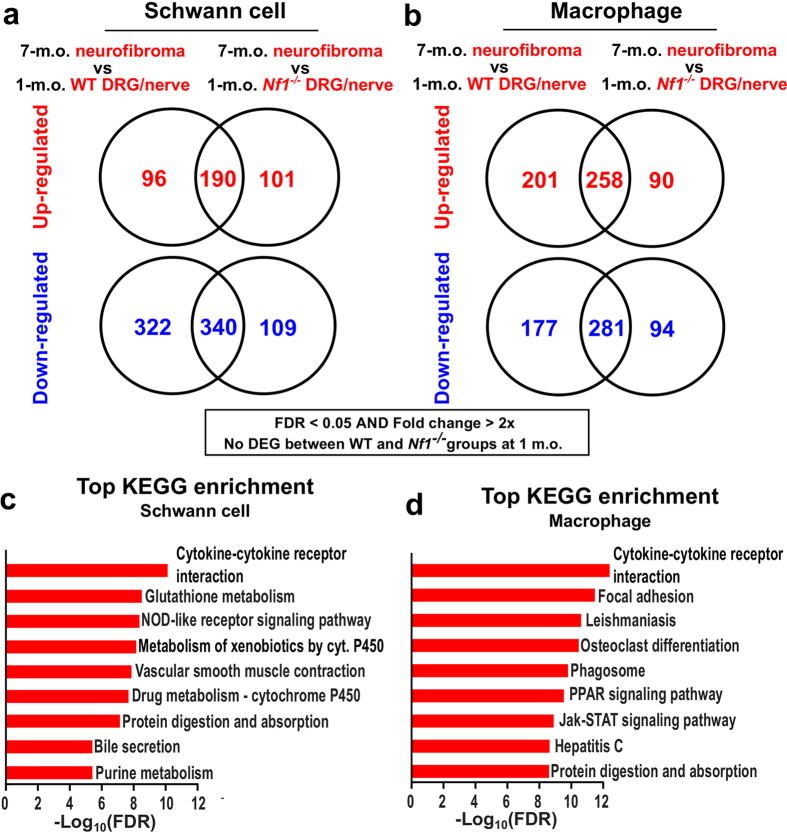
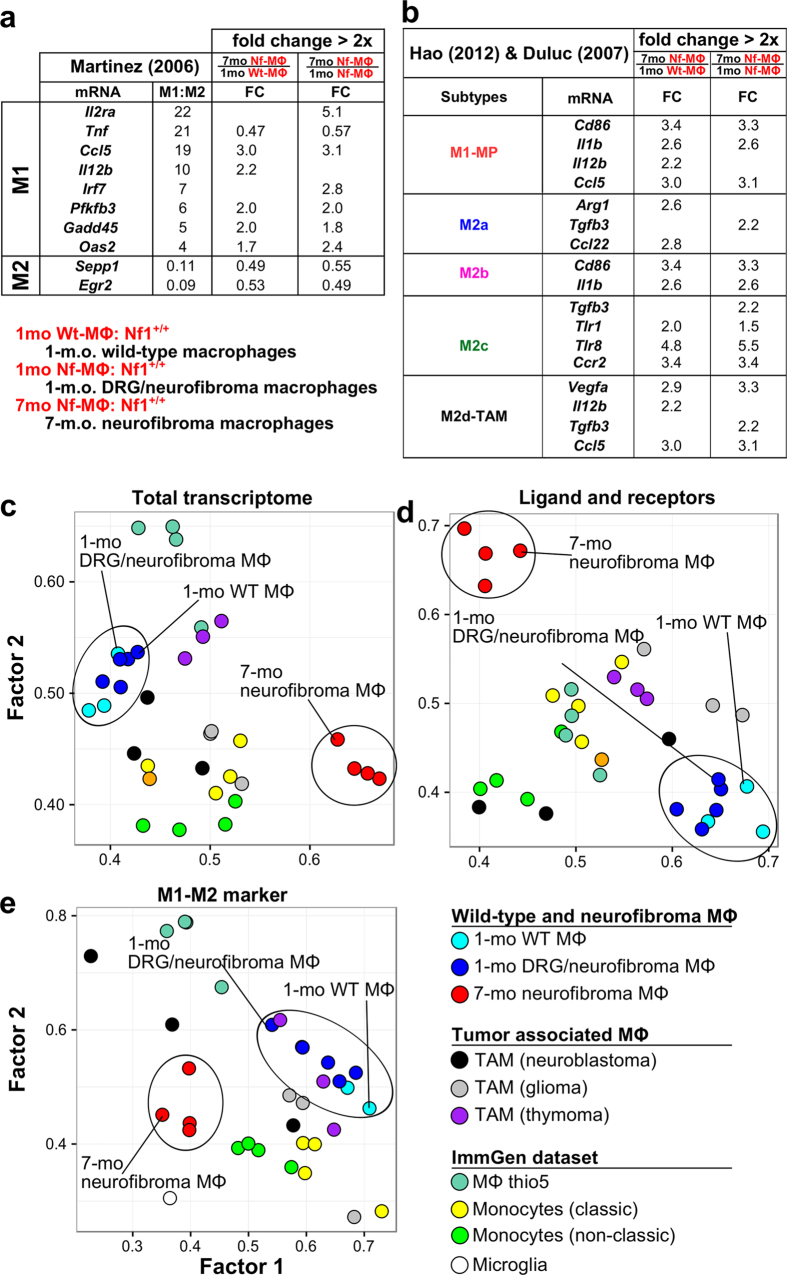
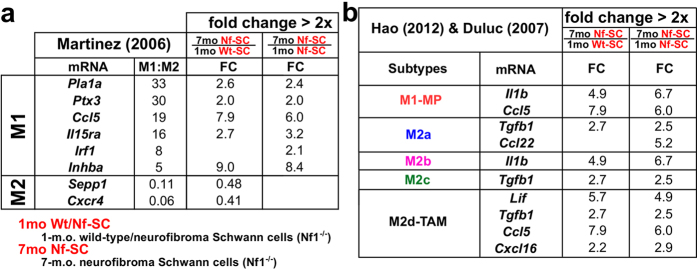
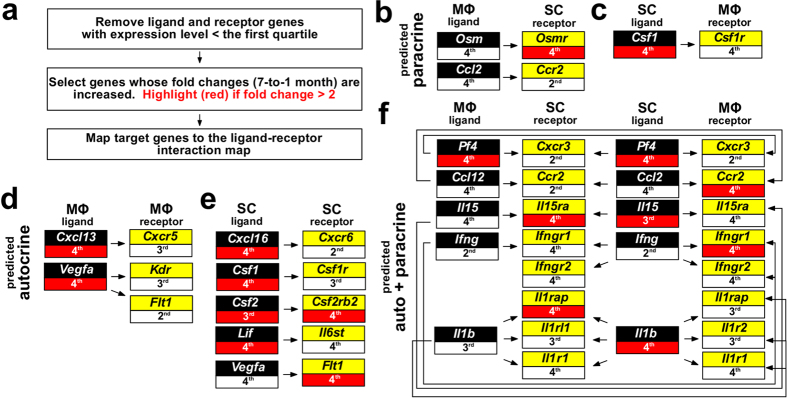
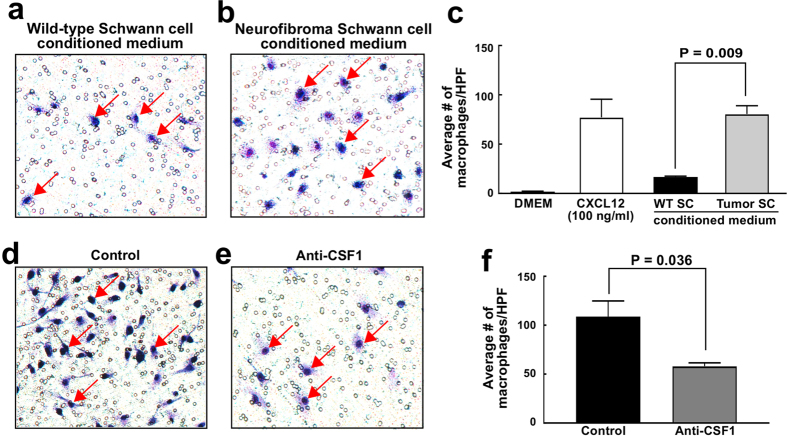
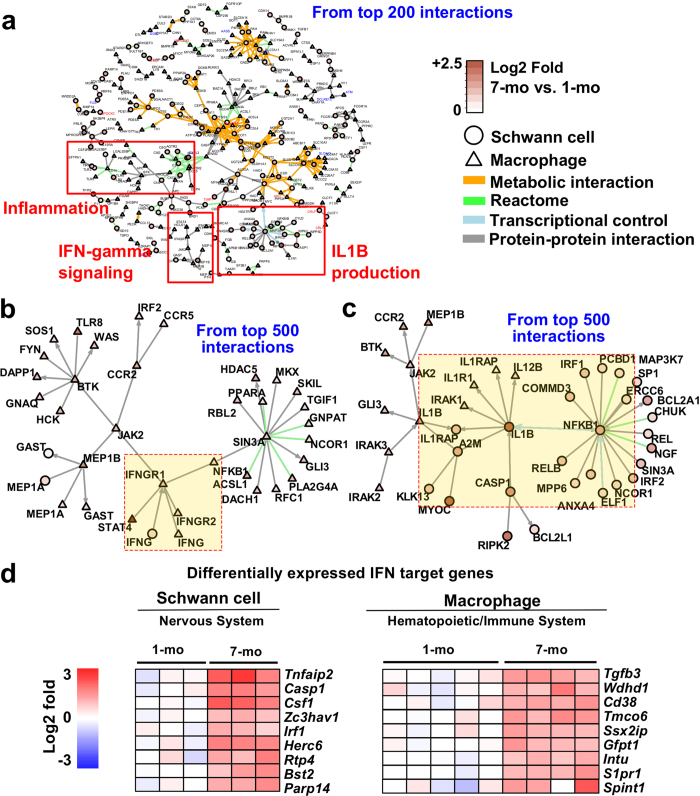
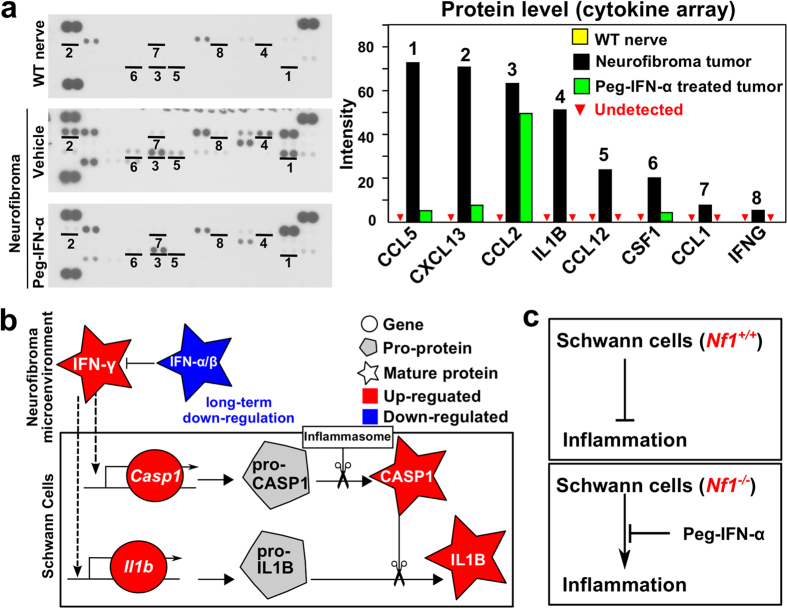
Neurofibromas are benign peripheral nerve tumors driven by NF1 loss in Schwann cells (SCs). Macrophages are abundant in neurofibromas, and macrophage targeted interventions may have therapeutic potential in these tumors. We generated gene expression data from fluorescence-activated cell sorted (FACS) SCs and macrophages from wild-type and mutant nerve and neurofibroma to identify candidate pathways involved in SC-macrophage cross-talk. While in 1-month-old Nf1 mutant nerve neither SCs nor macrophages significantly differed from their normal counterparts, both macrophages and SCs showed significantly altered cytokine gene expression in neurofibromas. Computationally reconstructed SC-macrophage molecular networks were enriched for inflammation-associated pathways. We verified that neurofibroma SC conditioned medium contains macrophage chemo-attractants including colony stimulation factor 1 (CSF1). Network analysis confirmed previously implicated pathways and predict novel paracrine and autocrine loops involving cytokines, chemokines, and growth factors. Network analysis also predicted a central role for decreased type-I interferon signaling. We validated type-I interferon expression in neurofibroma by protein profiling, and show that treatment of neurofibroma-bearing mice with polyethylene glycolyated (PEGylated) type-I interferon-α2b reduces the expression of many cytokines overexpressed in neurofibroma. These studies reveal numerous potential targetable interactions between Nf1 mutant SCs and macrophages for further analyses.


Conflict of interest statement

The authors declare no competing financial interests.

Figures

Figure 1
Figure 1. Overall analysis pipeline.
(a) DRG and neurofibroma tumors were dissociated and sorted into SC and macrophage populations. (b) DEGs were detected in comparisons of 7- to 1-month-old cell populations. These DEG lists were used to run gene set enrichment analysis and to reconstruct a ligand-receptor interaction map. Combined with NetWalk analysis, we narrowed down our target gene lists by identifying the most relevant gene network modules in neurofibroma. Cytokine arrays were used to validate the differential protein level changes of several target genes (between wild-type DRG and neurofibroma tumors).
Figure 2
Figure 2. DEGs and gene set enrichment analysis.
DEGs were predicted in (a) 7-to-1 month SC comparison and (b) 7-to-1-month-old macrophage comparison, using the limma method (fold change >2x and FDR q < 0.05). KEGG pathway analyses were performed using WegGestalt webserver using DEGs from (c) 7(Nf1−/−)-to-1(Nf1−/−) month SC comparison and (d) 7(Nf1+/+)-to-1(Nf1+/+) month neurofibroma macrophages. The designation Nf1−/− represents SCs from Nf1fl/fl;DhhCre mice; a mixture of wild-type and Nf1−/− SCs.
Figure 3
Figure 3. Characteristics of 7 neurofibroma macrophages.
DEGs from 7-to-1 month comparison of macrophages (a,b) were mapped to M1/M2 polarization signature genes collected from previous publications. Only differentially expressed signature genes were displayed. Macrophage (MΦ) subpopulation clusters were generated by exploratory factor analysis (EFA) approach, based on (c) all genes in the microarray, (d) ligands and receptor genes, and (e) M1/M2 signature genes.
Figure 4
Figure 4. Differentially expressed M1-M2 signature genes in neurofibroma SCs.
DEGs from 7-to-1 month comparison of SCs (a,b) were mapped to M1/M2 polarization signature genes collected from previous publications. Only differentially expressed signature genes are displayed.
Figure 5
Figure 5. Potential paracrine and autocrine regulations in 7-month-old neurofibroma microenvironment.
The relative expression levels are represented as quartiles (1st: lowest, 4th: highest). DEGs compared to 1-month-old neurofibroma SCs (Nf1−/−) and neurofibroma macrophages (Nf1+/+) are indicated in red boxes (fold >2).
Figure 6
Figure 6. Macrophage migration assay.
The number of migrated macrophages (stained in blue) increased significantly in neurofibroma SC conditioned medium compared to the wild-type SC conditioned medium (ac). Anti-CSF1 treatment significantly reduced the number of migrated macrophages stimulated by neurofibroma SC conditioned medium (df).
Figure 7
Figure 7. Network analysis and interferon target analysis.
(a) Intra- and inter-cellular network generated based on top-scoring network interactions revealed sub-networks related to inflammation and immune responses (b and c). Two functional modules, representing IFN-γ signaling and IL1B production, were re-plotted using a bigger context (top 500 interactions). (c) IFN-γ target DEGs from 7-to-1 month comparisons of SC and macrophages were predicted using INTERFEROME v2.0.
Figure 8
Figure 8. Pro-inflammatory cytokines in Neurofibroma.
(a) Left panel: Pro-inflammatory cytokines are at low levels in wild-type nerve (top), show increased protein levels in neurofibroma (middle), and are reduced after treatment of neurofibroma with PEGylated IFN-α2b (bottom). Right panel: Relative intensity, reflecting comparative levels of expression for each protein, after the intensity of pixels was averaged and plotted. (b) A model developed from gene expression analysis (drawn by Inkscape v0.48, http://inkscape.org). Decreased levels of type-I interferons and increased type-II interferon increase inflammation in the tumor microenvironment by increasing expression of Casp1 and Il1b mRNAs. CASP1 pro-protein is known to be cleaved and thus be activated by the inflammasome. Active CASP1 cleaves pro-IL1B protein, releasing active IL1B cytokine. (c) Based on this analysis, normal SCs suppress nerve inflammation. When Nf1−/− SCs are present, de-regulated interferons result in inflammation, which can be largely normalized by PEGylated IFN-α2b.

References

    1. Serra E. et al.. Confirmation of a double-hit model for the NF1 gene in benign neurofibromas. Am. J. Hum. Genet. 61, 512–519 (1997). - PMC - PubMed
    1. Zhu Y., Ghosh P., Charnay P., Burns D. K. & Parada L. F. Neurofibromas in NF1: Schwann cell origin and role of tumor environment. Science 296, 920–922 (2002). - PMC - PubMed
    1. Wu J. et al.. Plexiform and Dermal Neurofibromas and Pigmentation Are Caused by Nf1 Loss in Desert Hedgehog-Expressing Cells. Cancer Cell 13, 105–116 (2008). - PMC - PubMed
    1. Ratner N. & Miller S. J. A RASopathy gene commonly mutated in cancer: the neurofibromatosis type 1 tumour suppressor. Nat Rev Cancer 15, 290–301 (2015). - PMC - PubMed
    1. Sparmann A. & Bar-Sagi D. Ras oncogene and inflammation: Partners in crime. Cell Cycle 4, 735–736 (2005). - PubMed

Publication types

MeSH terms