. 2017 Mar 3:7:43202.
doi: 10.1038/srep43202.

Physico-mechanical and morphological features of zirconia substituted hydroxyapatite nano crystals

Affiliations

Physico-mechanical and morphological features of zirconia substituted hydroxyapatite nano crystals

S F Mansour et al. Sci Rep. .

Abstract

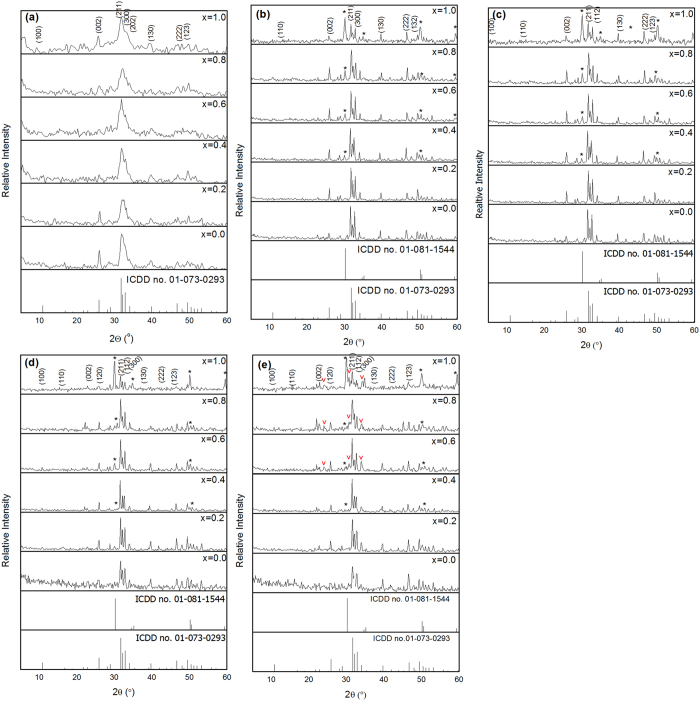
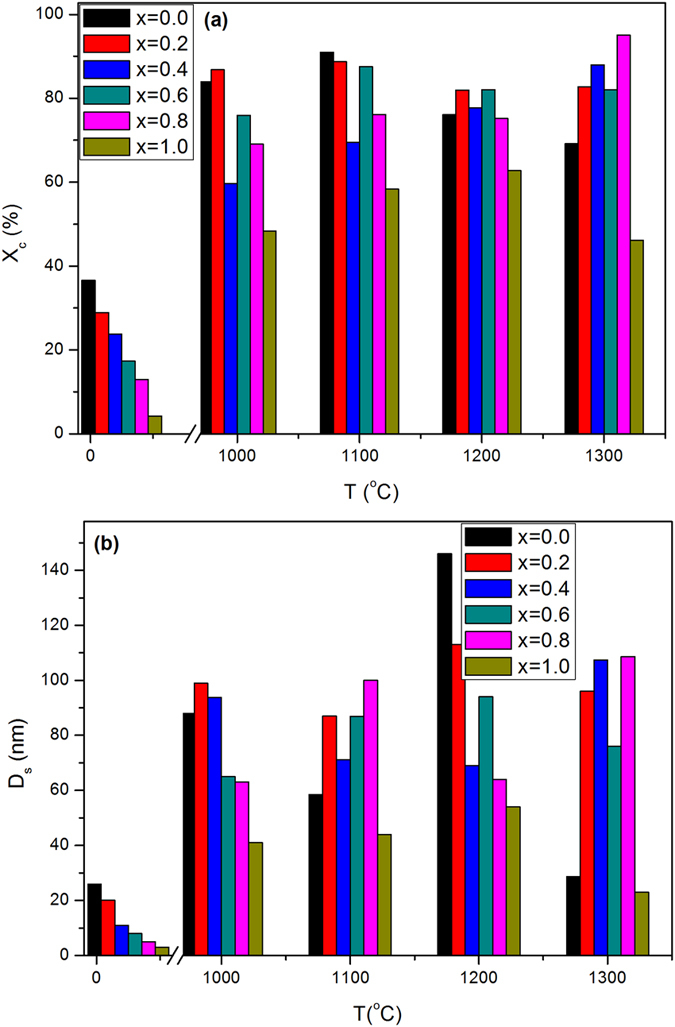
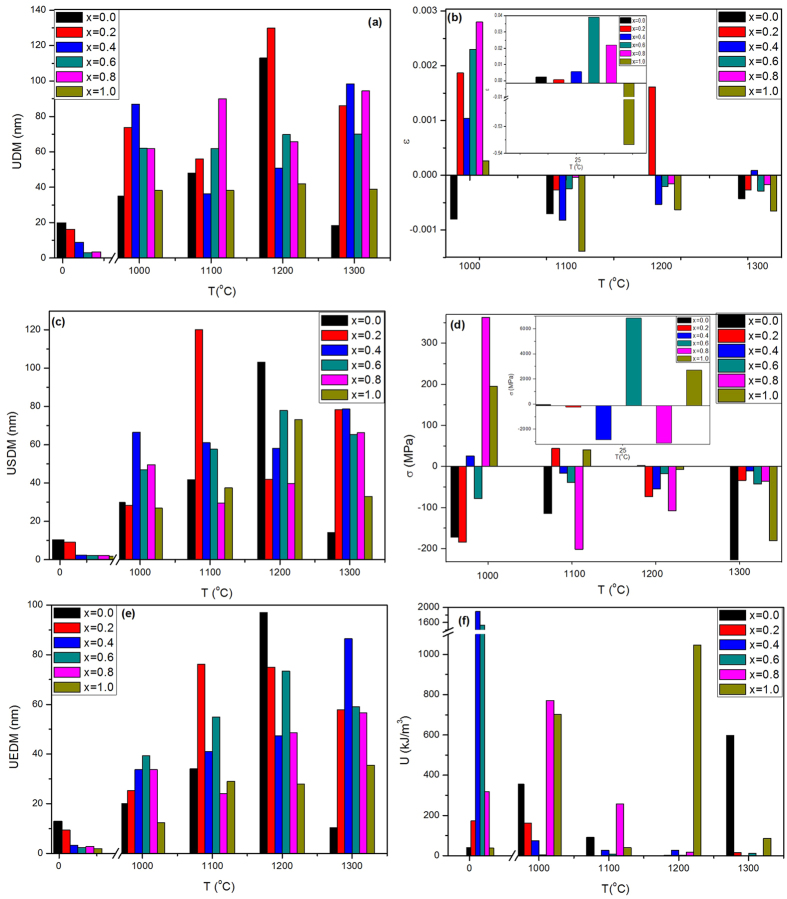
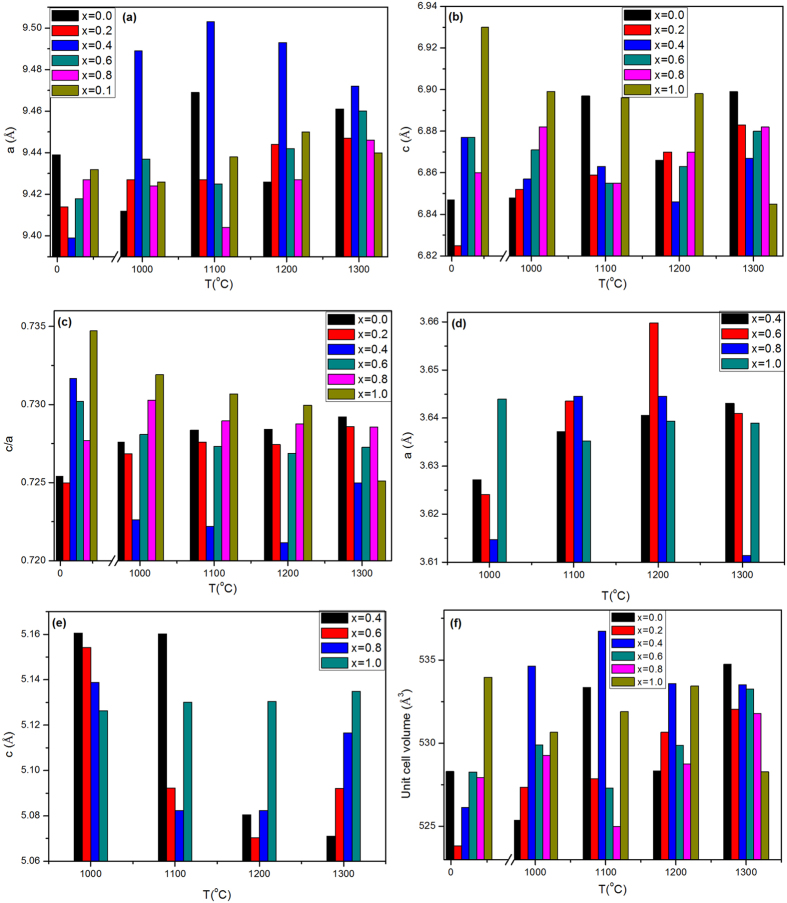
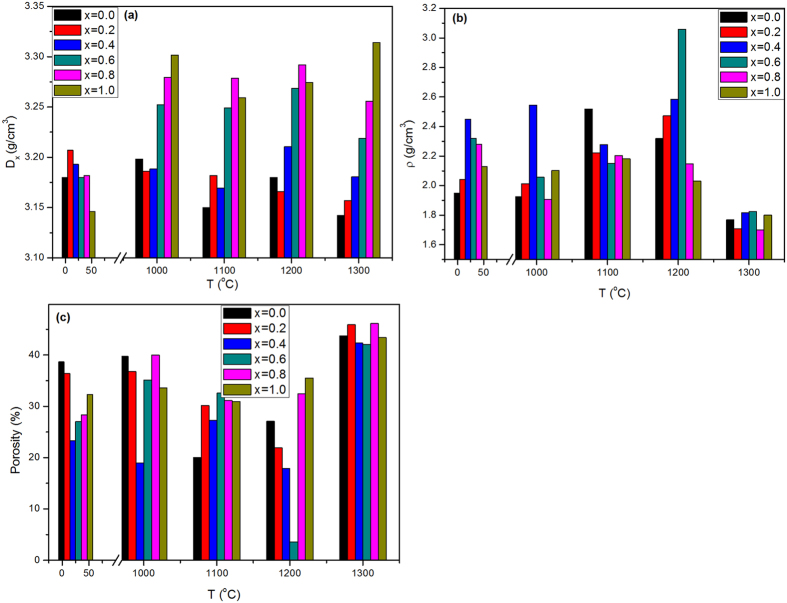
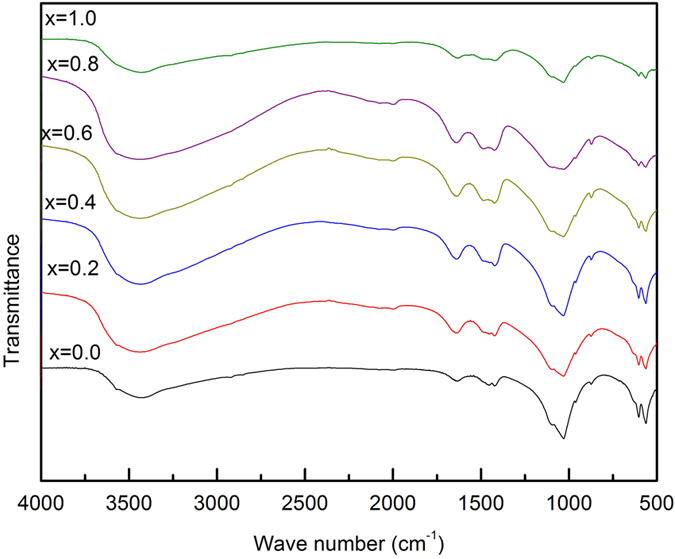
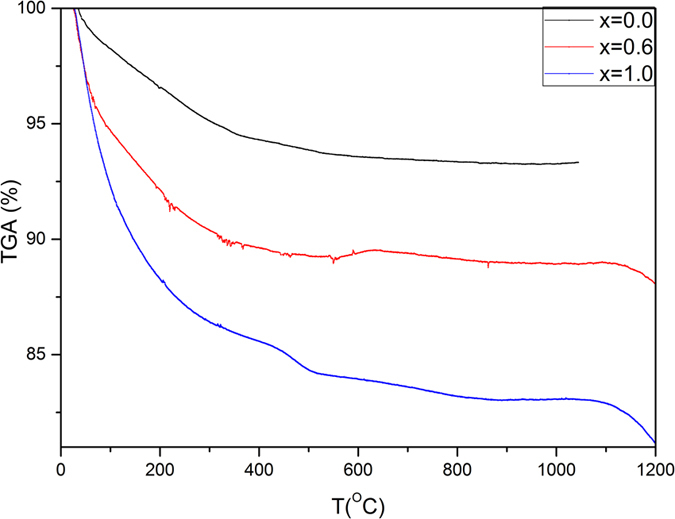
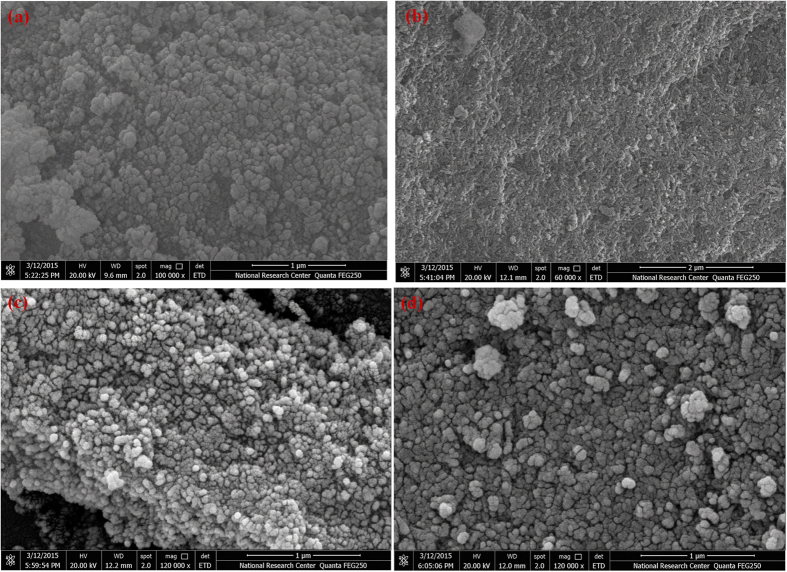
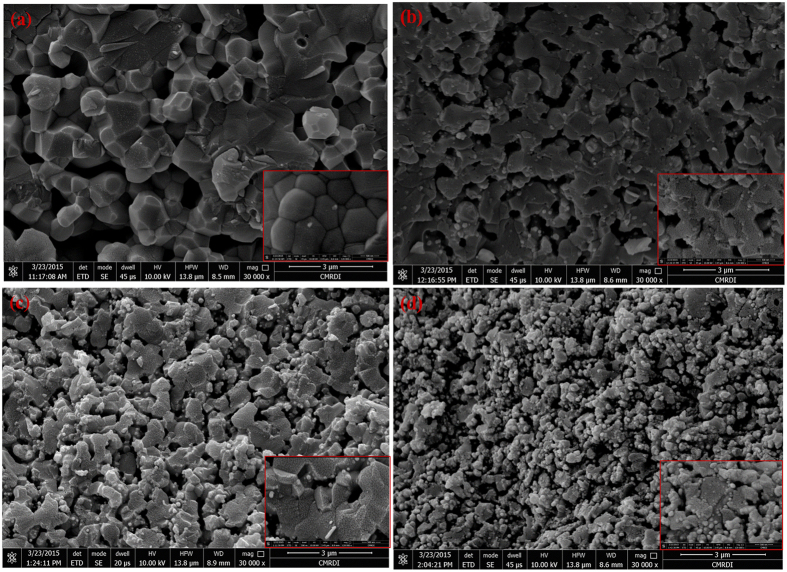
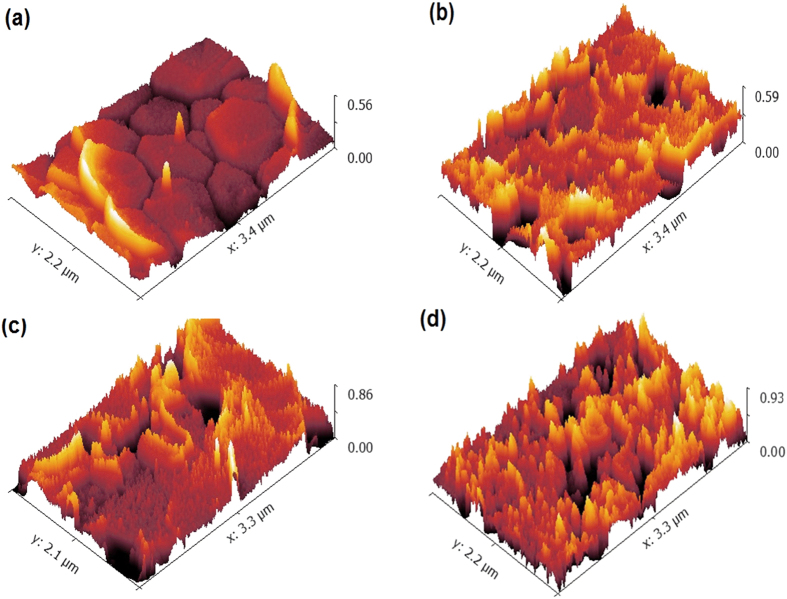
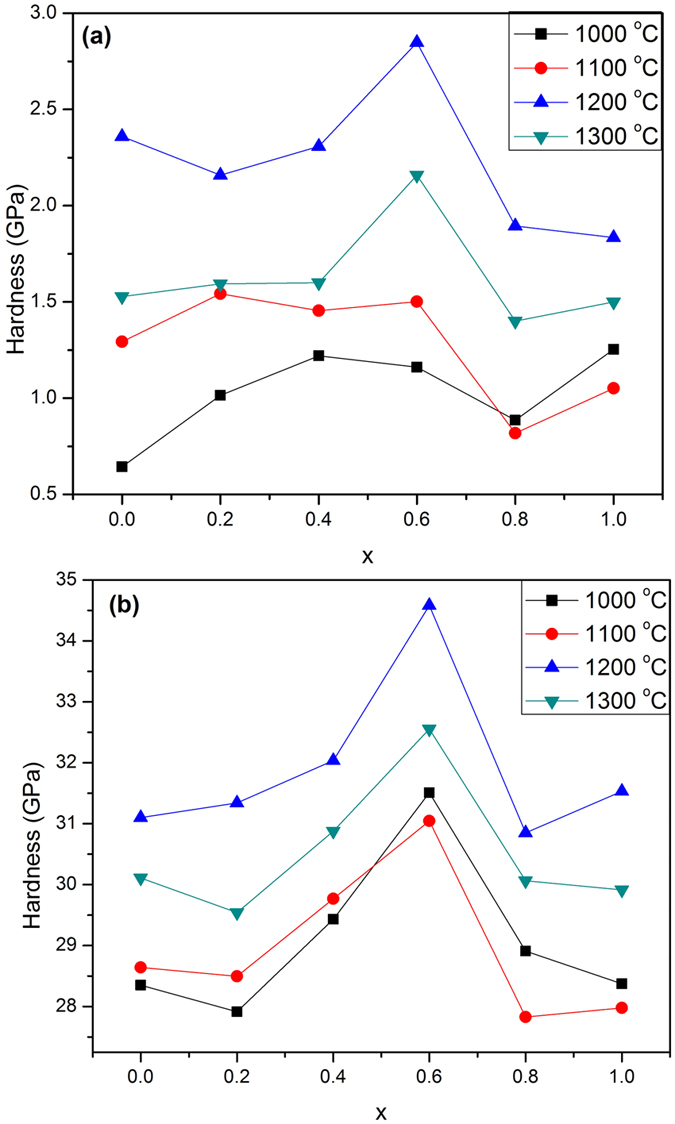
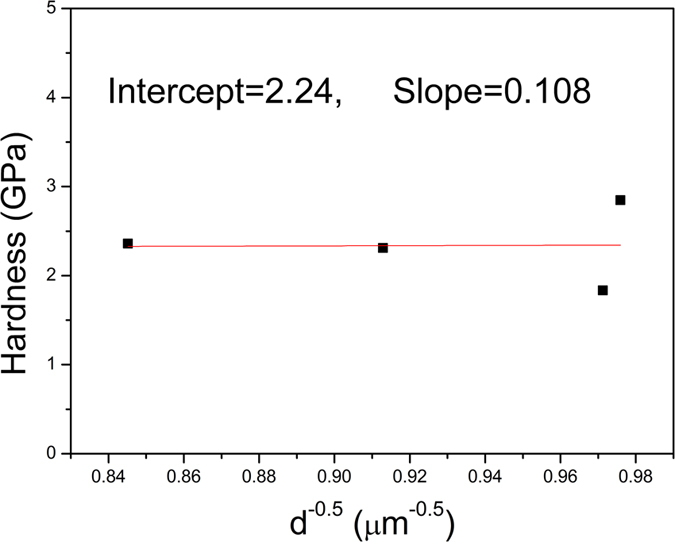
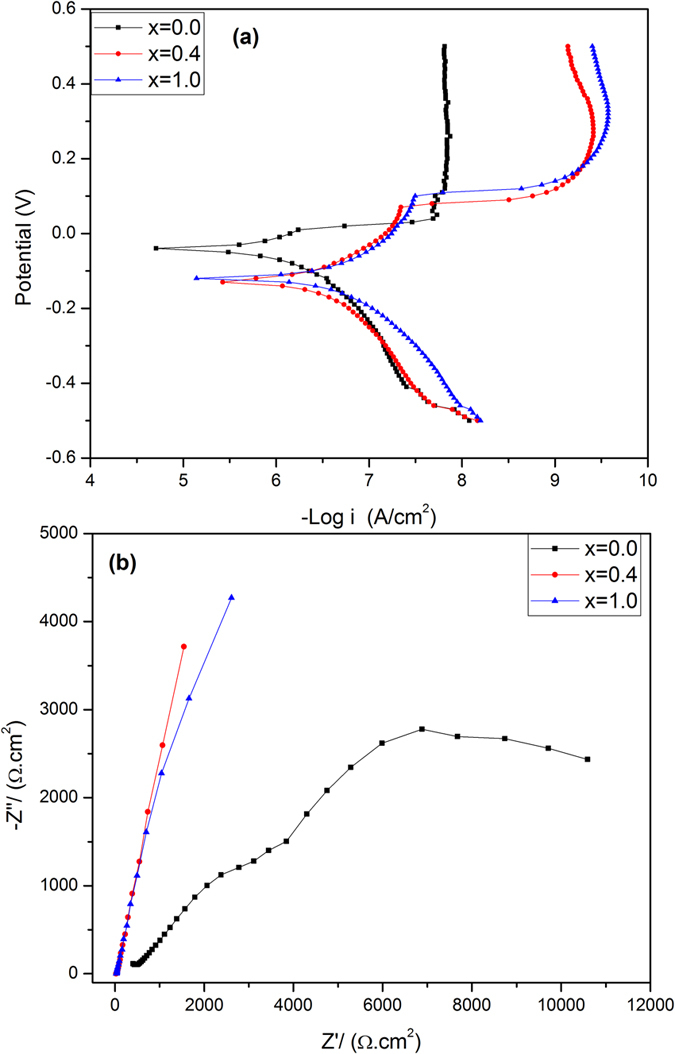
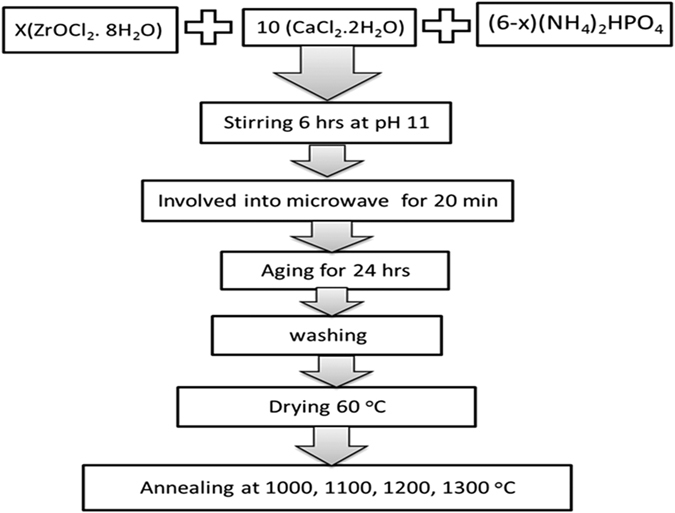
Zirconia doped Hydroxyapatite (HAP) nanocrystals [Ca10(PO4)6-x(ZrO2)x(OH)2]; (0 ≤ x ≤ 1 step 0.2) were synthesized using simple low cost facile method. The crystalline phases were examined by X-ray diffraction (XRD). The crystallinity percentage decreased with increasing zirconia content for the as-synthesized samples. The existence of zirconia as secondary phase on the grain boundaries; as observed from scanning electron micrographs (FESEM); resulted in negative values of microstrain. The crystallite size was computed and the results showed that it increased with increasing annealing temperature. Thermo-gravimetric analysis (TGA) assured the thermal stability of the nano crystals over the temperature from room up to 1200 °C depending on the zirconia content. The corrosion rate was found to decrease around 25 times with increasing zirconia content from x = 0.0 to 1.0. Microhardness displayed both compositional and temperature dependence. For the sample (x = 0.6), annealed at 1200 °C, the former increased up to 1.2 times its original value (x = 0.0).


Conflict of interest statement

The authors declare no competing financial interests.

Figures

Figure 1
Figure 1
XRD with different zirconia content at different annealing temperatures, (a) as synthesized samples, (b) 1000 °C, (c) 1100 °C, (d) 1200 °C, (e) 1300 °C, (*: ZrO1.95, v: α-TCP).
Figure 2
Figure 2
Values of crystallinity and crystal size (a) crystallinity of the as synthesized and annealed samples at different contents of zirconia, (b) crystallite size from Sherrer’s equation for the as-synthesized and annealed samples at different contents of zirconia.
Figure 3
Figure 3
(a) Crystallite size calculated from UDM model, (b) lattice strain of the annealed samples and the inset plot for the as synthesized samples, (c) crystallite size calculated from USDM model, (d) stress of the annealed samples and the inset plot for the as synthesized one, (e) crystallite size calculated from UEDM model, (f) energy density of the annealed samples. All diagrams are plotted at different zirconia contents.
Figure 4
Figure 4
(ac) Calculated lattice constant of hydroxyapatite (a) and (c) and (c/a) of the as synthesized and annealed samples at different zirconia content, respectively, (d,e) calculated lattice constant (a and c) of the zirconia unit cell at different annealed temperatures, (f) unit cell volume of hydroxyapatite unit cell for the as synthesized and annealed sample at a different content of zirconia.
Figure 5
Figure 5
(a) Theoretical density, (b) measured density, (c) calculated porosity for the as synthesized and annealed samples with different contents of zirconia.
Figure 6
Figure 6. FTIR spectrum of the as synthesized samples at different contents of zirconia.
Figure 7
Figure 7. Thermo-gravimetric analysis of Zr-HAP samples at x = 0.0, 0.6 and 1.0.
Figure 8
Figure 8
FESEM micrographs of the as synthesized samples at different contents of zirconia; (a) x = 0.0, (b) x = 0.4, (c) x = 0.6, (d) x = 1.0.
Figure 9
Figure 9
(ad) FESEM micrographs of the samples annealed at 1200 °C at different contents of zirconia; (a) x = 0.0, (b) x = 0.4, (c) x = 0.6, (d) x = 1.0.
Figure 10
Figure 10
Roughness of samples annealed at 1200 °C; (a) x = 0.0, (b) x = 0.4, (c) x = 0.6 and (d) x = 1.0.
Figure 11
Figure 11
Hardness values of the annealed samples; (a) measured hardness, (b) theoretical hardness.
Figure 12
Figure 12. The dependence of measured hardness on the grain size obeying Hall – Petch relation.
Figure 13
Figure 13
Potentiodynamic polarization curves (a) Tafel plot of x = 0.0, 0.4 and 1.0, (b) Nyquist plot for the samples x = 0.0, 0.4 and 1.0; immersed in SBF at 37 °C.
Figure 14
Figure 14
Equivalent electrical circuits (EES) of (a) x = 0.0, (b) x = 0.4 and (c) x = 1.0.
Figure 15
Figure 15. Bode plots of EIS data of samples x = 0.0, 0.4 and 1.0 in SBF at 37 °C.
Figure 16
Figure 16
Frequency dependence of (a) room temperature real part (ε′), (b) imaginary part (ε″) and (c) ac conductivity for the investigates samples.
Figure 17
Figure 17. Block diagram of preparation method.

Similar articles

Cited by

References

    1. Zhou H. & Lee J. Nanoscale hydroxyapatite particles for bone tissue engineering. Acta biomat. 7, 2769–2781 (2011). - PubMed
    1. Wang M.-C. et al.. Crystalline size, microstructure and biocompatibility of hydroxyapatite nanopowders by hydrolysis of calcium hydrogen phosphate dehydrate (DCPD). Ceram. Int. 41, 2999–3008 (2015).
    1. Kolmas J. et al.. Incorporation of carbonate and magnesium ions into synthetic hydroxyapatite: The effect on physicochemical properties. J. Mol. Struc. 987, 40–50 (2011).
    1. Xia Z. et al.. Fabrication and characterization of biomimetic collagen-apatite scaffolds with tunable structures for bone tissue engineering. Acta biomat. 9, 7308–7319 (2013). - PMC - PubMed
    1. Ramesh S., Tan C. Y., Peralta C. L. & Teng W. D. The effect of manganese oxide on the sinterability of hydroxyapatite. Sci. Tech. Adv. Mat. 8, 257–263 (2007).

LinkOut - more resources