. 2017 Mar 3:7:43739.
doi: 10.1038/srep43739.

Land-based salmon aquacultures change the quality and bacterial degradation of riverine dissolved organic matter

Affiliations

Land-based salmon aquacultures change the quality and bacterial degradation of riverine dissolved organic matter

Norbert Kamjunke et al. Sci Rep. .

Abstract

Aquacultures are of great economic importance worldwide but pollute pristine headwater streams, lakes, and estuaries. However, there are no in-depth studies of the consequences of aquacultures on dissolved organic matter (DOM) composition and structure. We performed a detailed molecular level characterization of aquaculture DOM quality and its bacterial degradation using four salmon aquacultures in Chile. Fluorescence measurements, ultrahigh-resolution mass spectrometry, and nuclear magnetic resonance spectroscopy of the DOM revealed specific and extensive molecular alterations caused by aquacultures. Aquacultures released large quantities of readily bioavailable metabolites (primarily carbohydrates and peptides/proteins, and lipids), causing the organic matter downstream of all the investigated aquacultures to deviate strongly from the highly processed, polydisperse and molecularly heterogeneous DOM found in pristine rivers. However, the upstream individual catchment DOM signatures remained distinguishable at the downstream sites. The benthic algal biovolume decreased and the bacterial biovolume and production increased downstream of the aquacultures, shifting stream ecosystems to a more heterotrophic state and thus impairing the ecosystem health. The bacterial DOM degradation rates explain the attenuation of aquaculture DOM within the subsequent stream reaches. This knowledge may aid the development of improved waste processing facilities and may help to define emission thresholds to protect sensitive stream ecosystems.


Conflict of interest statement

The authors declare no competing financial interests.

Figures

Figure 1
Figure 1
Concentrations of dissolved organic carbon (DOC) of the control sites, effluents and downstream of the aquacultures of the four sampling sites (A). Fluorescence intensities (Fmax values, Raman units) of the parallel factor analysis (PARAFAC) components of the control sites, effluents and downstream of the aquacultures of the four sampling sites (BE; Trp: tryptophan-like, Tyr: tyrosine-like, HS, HS2: humic acid-like).
Figure 2
Figure 2
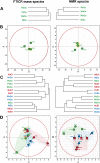
Alterations in the dissolved organic matter (DOM) characteristics as observed by (left) Fourier transform ion cyclotron mass spectrometry (FTICR MS) and (right) 1H nuclear magnetic resonance (NMR) spectroscopy. Top: hierarchical cluster analysis (HCA; A) and principal component analysis (PCA; B) of four pristine control DOM (cf. Figs 4A and S1). Bottom: HCA (C) and PCA (D) of the control, effluent and downstream DOM (cf. Figs S6–S9). Colour code: green, control DOM; red, aquaculture effluent DOM; blue, DOM downstream of the aquaculture.
Figure 3
Figure 3
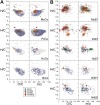
Fourier transform ion cyclotron mass spectrometry (FTICR MS) derived molecular compositions unique to (A) pristine and (B) effluent dissolved organic matter (DOM); left: van Krevelen diagrams; right: mass-edited H/C ratios. Colour code: blue, CHO; green, CHOS; orange, CHNO; and red, CHNOS molecular series. Circled area reflects the relative mass peak amplitude.
Figure 4
Figure 4
(Top): 1H nuclear magnetic resonance (NMR) spectra (800 MHz, CD3OD) of four DOM derived from “pristine” riverine catchments. (Bottom): Manual overlay difference 1H NMR spectra (800 MHz, CD3OD): effluent (red) minus pristine (green) DOM, with positive/negative amplitude referring to elevated abundance in the effluent/pristine DOM.
Figure 5
Figure 5
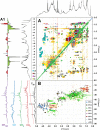
(Panel A) Overlay of 1H, 1H COSY (correlated spectroscopy; green cross peaks), 1H, 1H TOCSY (total correlated spectroscopy; coloured cross peaks) and (panel B) 1H, 13C DEPT HSQC (distortionless enhancement by polarization transfer; heteronuclear single quantum coherence) nuclear magnetic resonance (NMR) spectra (colour code: purple, CH123; blue, CH; green, CH2; red, CH3) of the Niltre first effluent DOM (NiEf1) aliphatic section, with cross peaks of proteinaceous amino acids (see attendant single letter code) in proteins following alanine, (A) annotated according to position and carbon multiplicity. (Panel A): upper left half: amino acid-derived COSY cross peaks according to positioning in peptides (blue squares); lower right half: amino acid-derived TOCSY cross peaks according to individual amino acids (individual grey symbols). (Panel B): 1H, 13C DEPT HSQC NMR spectrum; colour code: purple, CH123; blue, CH; green, CH2; red: CH3. Orange box denotes the section of OCHn cross peaks (cf. Figs 3A and S2). e1: aromatic methyl esters, e2: aliphatic methyl esters, e3: aromatic methyl esters, e4: aliphatic methyl ethers, e5: oxyomethylene OCH2, largely from carbohydrates. The abundance follows: e5 ≫ e1 ≈ e2: > e3 ≫ e4. Projection 1H NMR spectra on top (F2 dimension) represent the Niltre first effluent DOM NiEf1 (black) and difference 1H NMR spectra (1st effluent minus pristine; NiEf1 – NiCo) Niltre first effluent DOM (cf. Fig. S9), whereas multiplicity edited 13C NMR subspectra (F1 dimension) are shown for panel B (cf. Fig. S10).
Figure 6
Figure 6
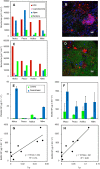
Biofilm biovolumes derived from confocal laser scanning microscopy (CLSM) image data (A,C), with two representative maximum intensity projections (B,D). (A,B) Biofilm data from a control location (Rio Niltre) showing the dominance of eukaryotic algae. (C,D) Downstream site of the aquaculture (Rio Niltre) with biofilms dominated by non-phototrophic bacteria. Colour code: blue, autofluorescence of chlorophyll a; purple, cyanobacteria; green, bacteria; red, lectin-specific EPS-glycoconjugates. Bacterial production of planktonic (E) and biofilm bacteria (F) at control sites and downstream of the aquacultures at the four sampling sites. Production of biofilm bacteria as a function of the fluorescence intensities (Fmax values, Raman units) of tryptophan-like (G) and tyrosine-like (H) compounds.

References

    1. Raymond P. A. et al.. Global carbon dioxide emissions from inland waters. Nature 503, 355–359 (2013). - PubMed
    1. Battin T. J., Besemer K., Bengtsson M. M., Romani A. M. & Packman A. I. The ecology and biogeochemistry of stream biofilms. Nat. Rev. Microbiol. 14, 251–263 (2016). - PubMed
    1. Romani A. M. et al.. Biofilm structure and function and possible implications for riverine DOC dynamics. Microb. Ecol. 47, 316–328 (2004). - PubMed
    1. Battin T. J. et al.. Biophysical controls on organic carbon fluxes in fluvial networks. Nat. Geosci. 1, 95–100 (2008).
    1. Cole J. J. et al.. Plumbing the global carbon cycle: integrating inland waters into the terrestrial carbon budget. Ecosystems 10, 171–184 (2007).

Publication types

LinkOut - more resources