. 2017 Mar 1;18(3):524.
doi: 10.3390/ijms18030524.

Autophagy Induced by Areca Nut Extract Contributes to Decreasing Cisplatin Toxicity in Oral Squamous Cell Carcinoma Cells: Roles of Reactive Oxygen Species/AMPK Signaling

Affiliations

Autophagy Induced by Areca Nut Extract Contributes to Decreasing Cisplatin Toxicity in Oral Squamous Cell Carcinoma Cells: Roles of Reactive Oxygen Species/AMPK Signaling

Zhi Xu et al. Int J Mol Sci. .

Abstract

Chewing areca nut is closely associated with oral squamous cell carcinoma (OSCC). The current study aimed to investigate potential associations between areca nut extract (ANE) and cisplatin toxicity in OSCC cells. OSCC cells (Cal-27 and Scc-9) viability and apoptosis were analyzed after treatment with ANE and/or cisplatin. The expressions of proteins associated with autophagy and the AMP-activated protein kinase (AMPK) signaling network were evaluated. We revealed that advanced OSCC patients with areca nut chewing habits presented higher LC3 expression and poorer prognosis. Reactive oxygen species (ROS)-mediated autophagy was induced after pro-longed treatment of ANE (six days, 3 μg). Cisplatin toxicity (IC50, 48 h) was decreased in OSCC cells after ANE treatment (six days, 3 μg). Cisplatin toxicity could be enhanced by reversed autophagy by pretreatment of 3-methyladenine (3-MA), N-acetyl-l-cysteine (NAC), or Compound C. Cleaved-Poly-(ADP-ribose) polymerase (cl-PARP) and cleaved-caspase 3 (cl-caspase 3) were downregulated in ANE-treated OSCC cells in the presence of cisplatin, which was also reversed by NAC and Compound C. Collectively, ANE could decrease cisplatin toxicity of OSCC by inducing autophagy, which involves the ROS and AMPK/mTOR signaling pathway.

Keywords: AMPK/mTOR signaling; areca nut extracts; autophagy; cisplatin; oral squamous cell carcinoma; reactive oxygen species.


Conflict of interest statement

The authors declare no conflict of interest.

Figures

Figure 1
Figure 1
(A) Representative images of LC3B immunohistochemical (IHC) staining (×200 and ×400 magnification) in tumor sites of oral squamous cell carcinoma (OSCC) tissue samples with or without areca nut usage. (B) Box plots of the expression level of LC3B in tumor site comparing cisplatin sensitive vs. cisplatin non-sensitive group of advanced OSCC patients. *** p-value less than 0.001. (C) The expression levels of LC3B in the tumor specimens comparing OSCC with or without areca nut usage. ** p < 0.01. (D) Kaplan-Meier survival curves of overall survival rates were schemed in terms of LC3B expression and areca nut usage in OSCC patients, separately. Results were analyzed via log-rank test. Cis S: cisplatin sensitive group; Cis NS: cisplatin non-sensitive group; OSCC with AN: OSCC samples with areca nut chewing habit; OSCC without AN: OSCC samples without areca nut chewing habit.
Figure 2
Figure 2
(A) Cell viability of Cal-27 and Scc-9 cells treated with various concentrations of ANE (0–16 μg/mL, 24, 48, and 72 h) analyzed by CCK-8 assay. (B) Cell apoptosis assay of Cal-27 and Scc-9 cells in the presence of various concentrations of ANE for 48 h presented as plots measured after Annexin-V and PI staining via flow cytometry. (C) Quantification for ANE-induced apoptosis cells analyzed by flow cytometry after Annexin V-PI staining. * p < 0.05 vs. the untreated group. Results are revealed as the mean ± SD of three independent experiments. UN: untreated with ANE.
Figure 2
Figure 2
(A) Cell viability of Cal-27 and Scc-9 cells treated with various concentrations of ANE (0–16 μg/mL, 24, 48, and 72 h) analyzed by CCK-8 assay. (B) Cell apoptosis assay of Cal-27 and Scc-9 cells in the presence of various concentrations of ANE for 48 h presented as plots measured after Annexin-V and PI staining via flow cytometry. (C) Quantification for ANE-induced apoptosis cells analyzed by flow cytometry after Annexin V-PI staining. * p < 0.05 vs. the untreated group. Results are revealed as the mean ± SD of three independent experiments. UN: untreated with ANE.
Figure 3
Figure 3
(A) Upregulated autophagy in Cal-27 and Scc-9 cells treated with ANE. OSCC cells were exposed to 1 or 3 μg/mL of ANE for 6 days. i. Effects of ANE on protein expression levels of Atg5–Atg12, p62, and LC3B in OSCC cells by Western blot. ii. Quantification for autophagy-essential proteins by Western blot analysis. * p < 0.05 vs. the untreated group (B) i. Detection of ROS generation labeled by 2′,7′-dichlorodihydrofluorescein diacetate (DCF-DA) via fluorescence microscopy in Cal-27 and Scc-9 cells under exposure of ANE (3 μg/mL) for 6 days, with or without NAC pretreatment. ii. Cellular ROS level detection with DCF-DA labeling by flow cytometry. iii. Quantification for ROS levels. Results are expressed as the mean ± SD of three independent experiments. * p < 0.05 vs. the untreated group, # p < 0.05 vs. the only ANE-treated group. (C) i. monodansylcadeverine (MDC) detection by fluorescence microscopy in Cal-27 cells treated with ANE and pretreatment with 3-MA or NAC, rapamycin pretreatment (1 μM, 3 h) were used for positive control. ii. Level detection and quantification of MDC in ANE-treated Cal-27 cells via flow cytometry with pretreatment with 3-MA or NAC. Results are expressed as the mean ± SD of three independent experiments. * p < 0.05 vs. the untreated group, # p < 0.05 vs. the only ANE-treated group. (D) Atg5–Atg12 expression was verified in Cal-27 and Scc-9 cells and analyzed by Western blot after Atg-5 siRNA knockdown. (E) Detection of indicated autophagy-essential proteins by Western blotting in ANE-treated Cal-27 cells with pretreatment of NAC, 3-MA, or siRNA-Atg5. Three independent experiments were conducted for Western blotting analysis.
Figure 4
Figure 4
AMPK/mTOR signaling pathway involved in the ANE-induced autophagy process. (A) Western blot results of indicated protein expression (AMPK, p-AMPK, mTOR, and p-mTOR) in OSCC cells treated/untreated with ANE. (B) i. Western blot results of autophagy regulatory proteins and p-AMPK, p-S6, p-mTOR, and mTOR in Cal-27 cells: the cells were treated with ANE and/or pretreated with 3-MA, NAC, and Compound C, separately. ii–iv. Quantification for p-mTOR and LC3 via Western blot analysis. Three independent experiments were conducted, and results were expressed as mean ± SD. * p < 0.05 vs. the untreated group, # p < 0.05 vs. the only ANE-treated group. (C) Immunofluorescent staining of p-AMPK, p-mTOR, and p-S6 (red) in the presence of ANE combined with Compound C pretreatment. Nuclear counterstaining was performed with DAPI (blue). (D) Detection of LC3 immunostaining punctuate using confocal fluorescence microscope and. quantification for punctuate pattern of LC3 immunostaining. OSCC cells were exposed to 3 μg/mL of ANE for 6 days with or without NAC pretreatment. LC3 (red) expression was detected by immunostaining colocalized with the cytoskeleton revealed by phalloidin staining (green). Nuclear counterstaining was performed with DAPI (blue). Statistic results are revealed as the mean ± SD of three independent experiments. * p < 0.05 vs. the untreated group. # p < 0.05 vs. the only ANE-treated group. (E) Representative images of autophagosomes via TEM in ANE-treated Cal-27 cells. The cells were detected with pretreatment Compound C before ANE exposure or not. Normal mitochondria (white arrows) and ANE-mediated autophagosomes (black arrows) in Cal-27 cells via TEM were marked. (F) Correlations among p-mTOR or p-AMPK, with LC3 expression in tissue samples. i. Two representative IHC staining of p-mTOR and p-AMPK in advanced OSCC tissue specimens associated with areca nut chewing (×400 of magnification). ii and iii. Associations between LC3 and p-mTOR or p-AMPK expression levels via Spearman rank correlation analysis.
Figure 4
Figure 4
AMPK/mTOR signaling pathway involved in the ANE-induced autophagy process. (A) Western blot results of indicated protein expression (AMPK, p-AMPK, mTOR, and p-mTOR) in OSCC cells treated/untreated with ANE. (B) i. Western blot results of autophagy regulatory proteins and p-AMPK, p-S6, p-mTOR, and mTOR in Cal-27 cells: the cells were treated with ANE and/or pretreated with 3-MA, NAC, and Compound C, separately. ii–iv. Quantification for p-mTOR and LC3 via Western blot analysis. Three independent experiments were conducted, and results were expressed as mean ± SD. * p < 0.05 vs. the untreated group, # p < 0.05 vs. the only ANE-treated group. (C) Immunofluorescent staining of p-AMPK, p-mTOR, and p-S6 (red) in the presence of ANE combined with Compound C pretreatment. Nuclear counterstaining was performed with DAPI (blue). (D) Detection of LC3 immunostaining punctuate using confocal fluorescence microscope and. quantification for punctuate pattern of LC3 immunostaining. OSCC cells were exposed to 3 μg/mL of ANE for 6 days with or without NAC pretreatment. LC3 (red) expression was detected by immunostaining colocalized with the cytoskeleton revealed by phalloidin staining (green). Nuclear counterstaining was performed with DAPI (blue). Statistic results are revealed as the mean ± SD of three independent experiments. * p < 0.05 vs. the untreated group. # p < 0.05 vs. the only ANE-treated group. (E) Representative images of autophagosomes via TEM in ANE-treated Cal-27 cells. The cells were detected with pretreatment Compound C before ANE exposure or not. Normal mitochondria (white arrows) and ANE-mediated autophagosomes (black arrows) in Cal-27 cells via TEM were marked. (F) Correlations among p-mTOR or p-AMPK, with LC3 expression in tissue samples. i. Two representative IHC staining of p-mTOR and p-AMPK in advanced OSCC tissue specimens associated with areca nut chewing (×400 of magnification). ii and iii. Associations between LC3 and p-mTOR or p-AMPK expression levels via Spearman rank correlation analysis.
Figure 5
Figure 5
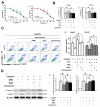
ANE-mediated autophagy associated with cisplatin resistance. (A) ANE downregulated cisplatin sensitivity in OSCC cell lines. After OSCC cells were treated with ANE (3 μg/mL) for 6 days, cisplatin (0–32 μM) was administrated for 48 h. i and ii. Cell viability was detected by CCK-8 assay in the presence of cisplatin for 48 h for Cal-27 and Scc-9 cells, separately. Results are revealed as the mean ± SD of three independent experiments. * p < 0.05 vs. the control group. UN: untreated with ANE as the control. (B) Cell viability of ANE (3 μg/mL, 6 days) treated Cal-27 and Scc-9 in the presence of cisplatin (IC50 concentration) for 48 h, with NAC or Compound C pretreatment or not. * p < 0.05 vs. non-ANE treatment group, # p < 0.05 vs. the only ANE-treated group. Three independent experiments were conducted and data was expressed as mean ± SD. (C) Cal-27 and Scc-9 cells were exposed to IC50 concentration of cisplatin for 48 h with or without pretreatment of ANE, 3-MA, NAC, or Compound C, separately. i. Cell apoptosis of OSCC cells induced by cisplatin presented as 2D density plots measured via flow cytometry after Annexin V-PI staining. ii. Quantification for apoptosis induced by cisplatin (IC50, 48 h) via flow cytometry after Annexin V-PI staining. Results are expressed as the mean ± SD of three independent experiments. * p < 0.05 vs. non-ANE-treated groups, # p < 0.05 only ANE-treated group in the presence of cisplatin. (D) i. Western blot results of cl-caspase 3 and cl-PARP protein expressions in Cal-27 cells in the presence of cisplatin under various condition. ii. Quantification for apoptosis-related proteins induced by cisplatin (IC50, 48 h) via Western blot analysis. Three independent experiments were conducted. * p < 0.05 vs. non-ANE-treated groups, # p < 0.05 only ANE-treated group in the presence of cisplatin.
Figure 6
Figure 6
Schematic summarizing how ANE decreases cisplatin toxicity in OSCC cells by inducing autophagy, and that the ROS and AMPK/mTOR pathways were involved in this process. Non-toxic concentration of ANE could induce autophagy via activation of the AMPK/ROS signaling pathway coincided with the activation of ROS accumulation. The ANE-induced autophagy was related with decreased cisplatin toxicity in OSCC cells.

References

    1. Jemal A., Siegel R., Xu J., Ward E. Cancer statistics, 2010. CA Cancer J. Clin. 2010;60:277–300. doi: 10.3322/caac.20073. - DOI - PubMed
    1. Haddad R.I., Shin D.M. Recent advances in head and neck cancer. N. Engl. J. Med. 2008;359:1143–1154. doi: 10.1056/NEJMra0707975. - DOI - PubMed
    1. Guneri P., Epstein J.B. Late stage diagnosis of oral cancer: Components and possible solutions. Oral Oncol. 2014;50:1131–1136. doi: 10.1016/j.oraloncology.2014.09.005. - DOI - PubMed
    1. Gibson M.K., Li Y., Murphy B., Hussain M.H., DeConti R.C., Ensley J., Forastiere A.A., Eastern Cooperative Oncology Group Randomized phase III evaluation of cisplatin plus fluorouracil versus cisplatin plus paclitaxel in advanced head and neck cancer (E1395): An intergroup trial of the Eastern Cooperative Oncology Group. J. Clin. Oncol. 2005;23:3562–3567. doi: 10.1200/JCO.2005.01.057. - DOI - PubMed
    1. Galluzzi L., Senovilla L., Vitale I., Michels J., Martins I., Kepp O., Castedo M., Kroemer G. Molecular mechanisms of cisplatin resistance. Oncogene. 2012;31:1869–1883. doi: 10.1038/onc.2011.384. - DOI - PubMed

MeSH terms

LinkOut - more resources