

Micronutrient Status in 153 Patients with Anorexia Nervosa
- PMID: 28257095
- PMCID: PMC5372888
- DOI: 10.3390/nu9030225
Micronutrient Status in 153 Patients with Anorexia Nervosa
Abstract
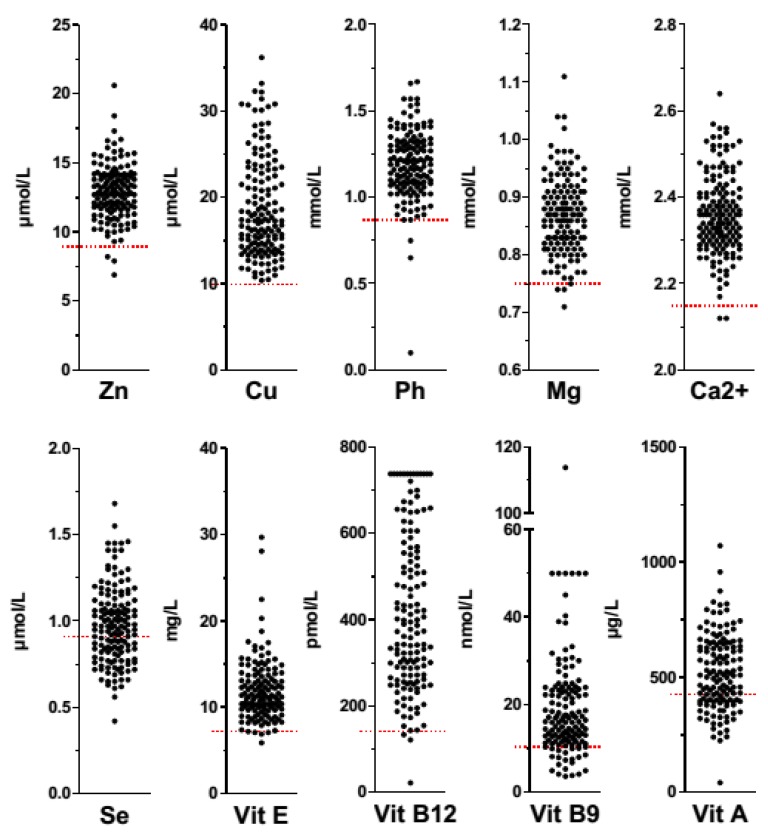
Micronutrient status in Anorexia Nervosa (AN) has been poorly documented and previous data are often contradictory. We aimed to assess micronutrient status in a large population of AN patients. The relationships between micronutrient status and body composition were also determined. Anthropometric, biochemical parameters and body composition data were collected at referral in 153 patients with AN (28.5 ± 11 years). At least one trace element deficit was observed in almost half of patients; the most frequent was selenium deficit (40% of patients). At least one vitamin deficit was observed in 45.7% of patients, mostly vitamin A and B9. Albumin, transthyretin and CRP were within normal range in most patients. No correlations were found between body composition and micronutrient status. Our study suggests that micronutrient status is often altered in AN patients, which may contribute to neuropsychiatric dysfunction. Monitoring of micronutrients and correction of deficits should be included in the routine care of AN patients.
Keywords: anorexia nervosa; micronutrients.
Conflict of interest statement
The authors declare no conflict of interest.
Figures
References
MeSH terms
Substances
LinkOut - more resources
Full Text Sources
Other Literature Sources
Molecular Biology Databases
Research Materials
Miscellaneous
