Review
. 2017 Oct;52(10):647-657.
doi: 10.1097/RLI.0000000000000365.

SyMRI of the Brain: Rapid Quantification of Relaxation Rates and Proton Density, With Synthetic MRI, Automatic Brain Segmentation, and Myelin Measurement

Affiliations
Review

SyMRI of the Brain: Rapid Quantification of Relaxation Rates and Proton Density, With Synthetic MRI, Automatic Brain Segmentation, and Myelin Measurement

Akifumi Hagiwara et al. Invest Radiol. 2017 Oct.

Abstract

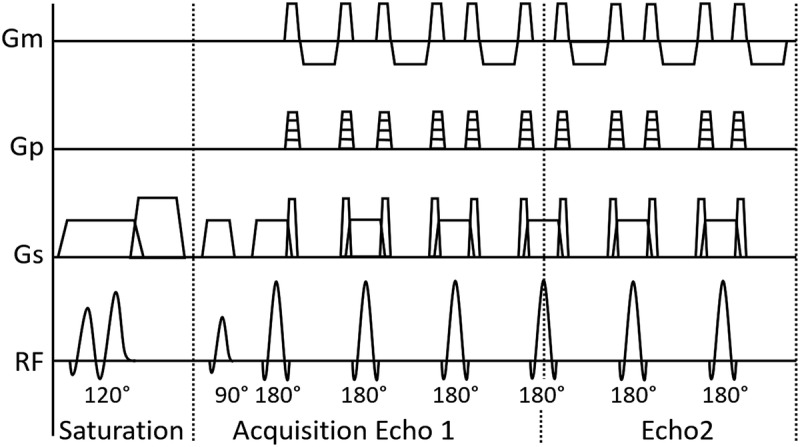
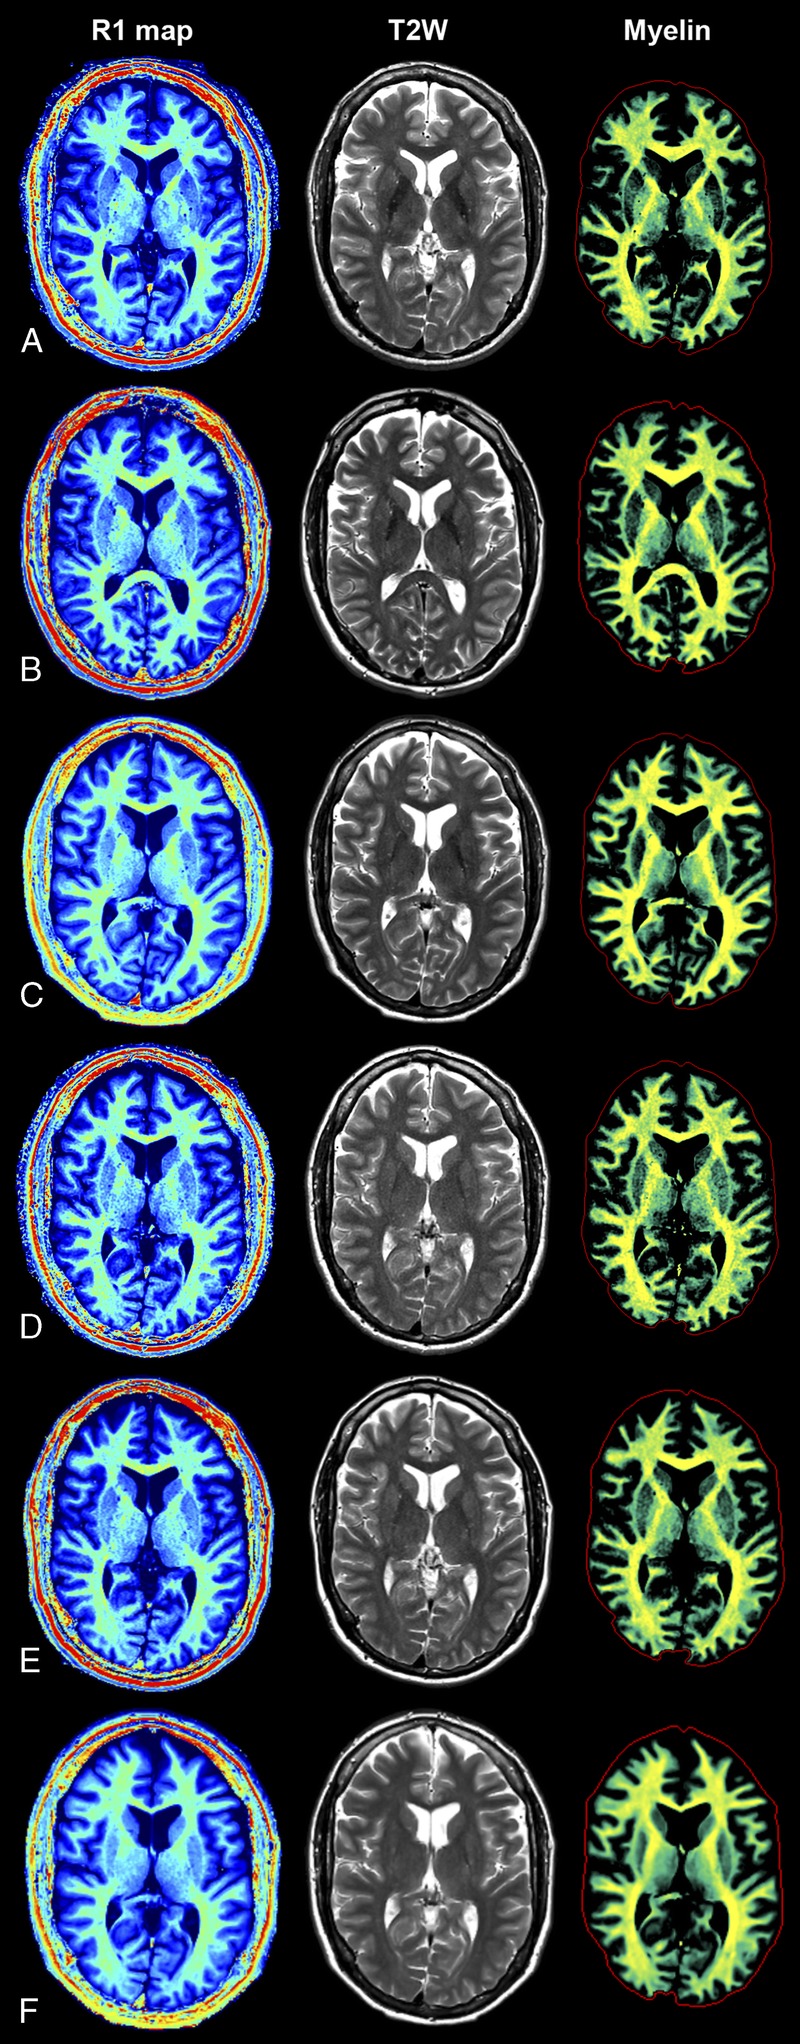
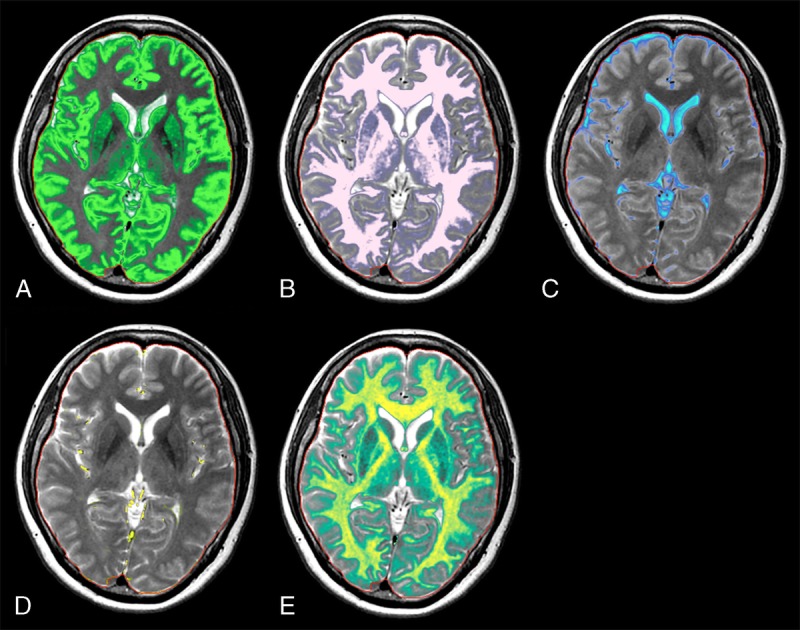
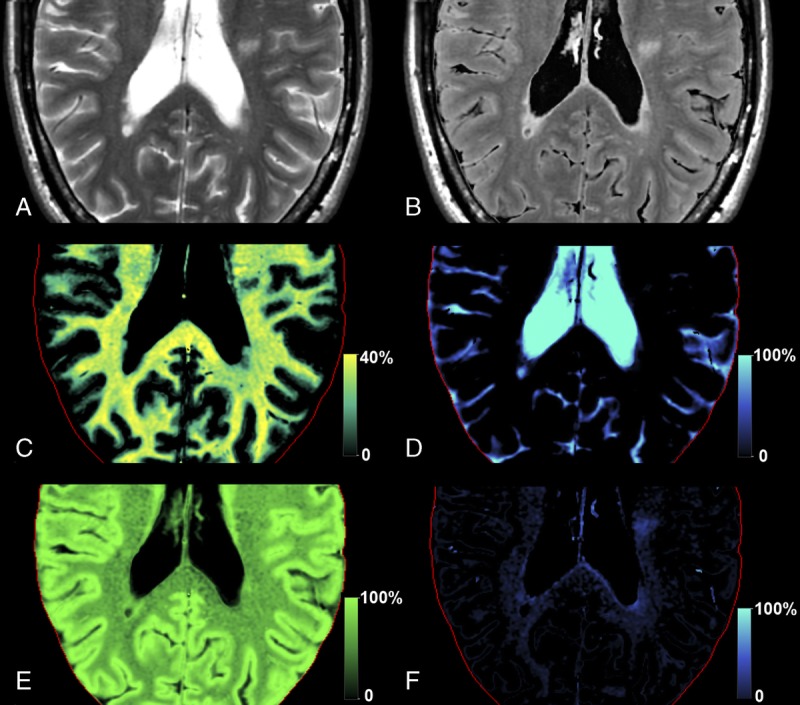
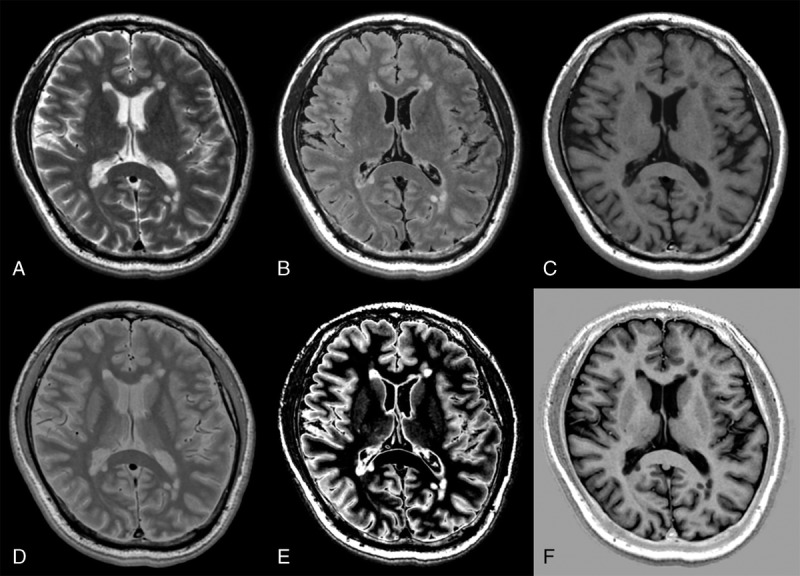
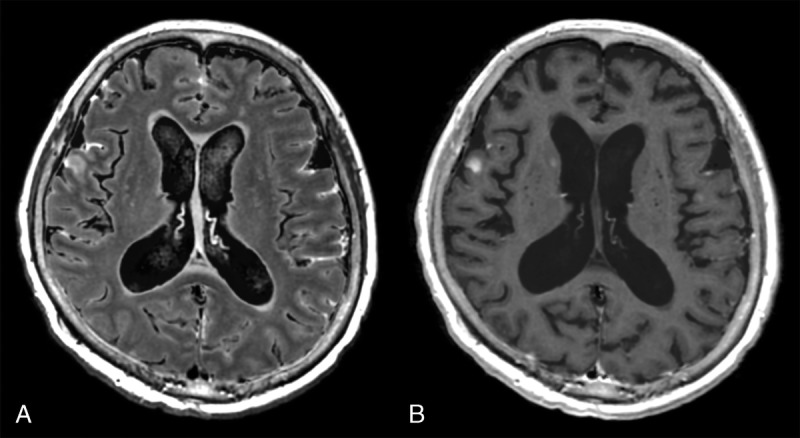
Conventional magnetic resonance images are usually evaluated using the image signal contrast between tissues and not based on their absolute signal intensities. Quantification of tissue parameters, such as relaxation rates and proton density, would provide an absolute scale; however, these methods have mainly been performed in a research setting. The development of rapid quantification, with scan times in the order of 6 minutes for full head coverage, has provided the prerequisites for clinical use. The aim of this review article was to introduce a specific quantification method and synthesis of contrast-weighted images based on the acquired absolute values, and to present automatic segmentation of brain tissues and measurement of myelin based on the quantitative values, along with application of these techniques to various brain diseases. The entire technique is referred to as "SyMRI" in this review. SyMRI has shown promising results in previous studies when used for multiple sclerosis, brain metastases, Sturge-Weber syndrome, idiopathic normal pressure hydrocephalus, meningitis, and postmortem imaging.


Figures

FIGURE 1
FIGURE 1
Schematic illustration of a single basic block of the QRAPMASTER quantification pulse sequence. Gradients of measurement (Gm), phase-encoding (Gp), and slice-selection (Gs), and the radiofrequency pulse amplitude over time are shown. One block consists of 2 phases. In the first phase (saturation), the 120-degree saturation pulse θ is performed on a slice m, followed by subsequent spoiling. In the second phase, an acquisition is performed on slice n, providing an effective saturation delay time for each specific slice. Typically, 4 delay times are acquired and turbo spin-echo acquisition consists of 2 echoes. The acquisition uses the 90-degree excitation pulse α and multiple 180-degree refocusing pulses. The acquired k-space lines can be combined to fewer echoes than the number of refocusing pulses. The spin-echo acquisition can also be accelerated through an echo-planar imaging technique (GraSE, not depicted).
FIGURE 2
FIGURE 2
Quantification using SyMRI. The QRAPMASTER acquisition was applied to retrieve the R1 map (left column), R2 map, and PD map. Based on these maps, conventional (eg, T2-weighted) images can be synthesized (center column). Furthermore, the R1, R2, and PD maps provide an absolute scale and hence a robust input to brain segmentation. An example of one of these segmentations (of myelin) is shown in the right column. The SyMRI method provides maps that are independent of the magnetic resonance scanner and hence provide the same result on all major platforms. For this example, the subject was scanned at 3.0 T on a GE 750 (A), Siemens Skyra (B), Philips Ingenia (C), and at 1.5 T on a GE 450 W (D), Siemens Aera (E), and Philips Ingenia (F).
Formula
Formula
Formula
Formula
Formula
Formula
Formula
Formula
FIGURE 3
FIGURE 3
Segmentation results from a healthy volunteer for gray matter (A), white matter (B), cerebrospinal fluid (C), non–white matter/gray matter/cerebrospinal fluid (D), and myelin (E). Background synthetic T2-weighted images are imposed as references. The red lines indicate intracranial volume.
FIGURE 4
FIGURE 4
Myelin segmentation in a patient with multiple sclerosis. Synthetic T2-weighted (A) and fluid-attenuated inversion recovery (B) images of an axial slice of the brain of the patient based on measured R1, R2, and PD maps. Using the same data, the tissue is decomposed into the myelin partial volume VMY (C), the free water partial volume VFW (D), the cellular partial volume VCL (E), and the excess parenchymal water partial volume VEPW (F). The red line indicates the intracranial volume.
FIGURE 5
FIGURE 5
Representative slices of synthetic T2-weighted (A), fluid-attenuated inversion recovery (B), T1-weighted (C), proton density-weighted (D), double inversion recovery (E), and phase-sensitive inversion recovery images in a patient with multiple sclerosis.
FIGURE 6
FIGURE 6
Images of a patient with multiple brain metastases and meningeal carcinomatosis. Contrast-enhanced synthetic fluid-attenuated inversion recovery (FLAIR) (A) shows meningeal carcinomatosis more clearly than a synthetic T1-weighted image (B). Contrast-enhanced FLAIR images are not acquired routinely in many institutions, and creating a FLAIR image after quantitative MRI is an advantage of synthetic MRI.

References

    1. Warntjes JB, Leinhard OD, West J, et al. Rapid magnetic resonance quantification on the brain: optimization for clinical usage. Magn Reson Med. 2008;60:320–329. - PubMed
    1. West J, Aalto A, Tisell A, et al. Normal appearing and diffusely abnormal white matter in patients with multiple sclerosis assessed with quantitative MR. PLoS One. 2014;9:e95161. - PMC - PubMed
    1. Hagiwara A, Hori M, Yokoyama K, et al. Utility of a multiparametric quantitative MRI model that assesses myelin and edema for evaluating plaques, periplaque white matter, and normal-appearing white matter in patients with multiple sclerosis: a feasibility study. AJNR Am J Neuroradiol. 2017;38:237–242. - PMC - PubMed
    1. Wagner MC, Lukas P, Herzog M, et al. MRI and proton-NMR relaxation times in diagnosis and therapeutic monitoring of squamous cell carcinoma. Eur Radiol. 1994;4:314–323.
    1. Drain LE. A direct method of measuring nuclear spin–lattice relaxation times. Proc Phys Soc A. 1949;62:301–306.