. 2017 Mar 3;12(3):e0172955.
doi: 10.1371/journal.pone.0172955. eCollection 2017.

Site-specific gene expression profiling as a novel strategy for unravelling keloid disease pathobiology

Affiliations

Site-specific gene expression profiling as a novel strategy for unravelling keloid disease pathobiology

N Jumper et al. PLoS One. .

Abstract

Keloid disease (KD) is a fibroproliferative cutaneous tumour characterised by heterogeneity, excess collagen deposition and aggressive local invasion. Lack of a validated animal model and resistance to a multitude of current therapies has resulted in unsatisfactory clinical outcomes of KD management. In order to address KD from a new perspective, we applied for the first time a site-specific in situ microdissection and gene expression profiling approach, through combined laser capture microdissection and transcriptomic array. The aim here was to analyse the utility of this approach compared with established methods of investigation, including whole tissue biopsy and monolayer cell culture techniques. This study was designed to approach KD from a hypothesis-free and compartment-specific angle, using state-of-the-art microdissection and gene expression profiling technology. We sought to characterise expression differences between specific keloid lesional sites and elucidate potential contributions of significantly dysregulated genes to mechanisms underlying keloid pathobiology, thus informing future explorative research into KD. Here, we highlight the advantages of our in situ microdissection strategy in generating expression data with improved sensitivity and accuracy over traditional methods. This methodological approach supports an active role for the epidermis in the pathogenesis of KD through identification of genes and upstream regulators implicated in epithelial-mesenchymal transition, inflammation and immune modulation. We describe dermal expression patterns crucial to collagen deposition that are associated with TGFβ-mediated signalling, which have not previously been examined in KD. Additionally, this study supports the previously proposed presence of a cancer-like stem cell population in KD and explores the possible contribution of gene dysregulation to the resistance of KD to conventional therapy. Through this innovative in situ microdissection gene profiling approach, we provide better-defined gene signatures of distinct KD regions, thereby addressing KD heterogeneity, facilitating differential diagnosis with other cutaneous fibroses via transcriptional fingerprinting, and highlighting key areas for future KD research.


Conflict of interest statement

Competing Interests: GlaxoSmithKline partially funded this research but there are no financial competing interests, non-financial, personal or professional competing interests and does not alter our adherence to all PLOS ONE policies on sharing data and materials.

Figures

Fig 1
Fig 1. Experimental approaches for the comparison of site-specific keloid disease with normal skin.
A) Schematic diagram demonstrating laser capture microdissection (LCM) of epidermis and dermis for each of the shown keloid biopsy sites, centre (intralesional), margin (perilesional) and keloid-adjacent normal skin (extralesional). LCM was performed for keloid sites and normal skin. As shown, the elements pertaining to portions of each compartment (epidermis separate to dermis) were delineated, cut using ultraviolet (UV) laser and catapulted into the cap of an overhanging tube, where images confirmed their presence. This was then immersed in lysis buffer and stored at -80°C. B) The three methods of experimental technique used to compare keloid with normal skin: LCM, whole tissue biopsy and 2D monolayer cell culture. C) Principal component analysis (PCA) plot for the gene expression derived from experimental approaches described above. The epidermal and dermal samples are evident as separate clusters as are the laser captured material and the monolayer culture samples.
Fig 2
Fig 2. Comparison of in situ microdissection KD expression to whole tissue biopsy and monolayer culture expression.
(A) Venn diagram comparing microdissected keloid epidermal expression to whole tissue and keratinocyte culture expression. The red arrow and text indicates where all 3 methods overlap and the results of enrichment using Ingenuity Pathway Analysis (IPA) for this group. The blue arrows and text indicate where either alternative method overlaps with in situ expression and the associated enrichment for that group. The green arrow and text indicates the enrichment analysis result for the 1388 genes that were identified in the microdissection group alone. (B) Venn diagram comparing micro-dissected keloid dermal expression to whole tissue and fibroblast culture expression. The red arrow and text indicates where all 3 methods overlap and the results of enrichment using IPA for this group. The blue arrows and text indicate where either alternative method overlaps with in situ expression and the associated enrichment for that group. The green arrow and text indicates the enrichment analysis result for the 3749 genes that were identified in the microdissection group alone. ACKR3, atypical chemokine receptor 3; ATM, ataxia telangiectasia mutated; DACH1, dachshund family transcription factor 1; EGF, epidermal growth factor; EPHB4, ephrin (EPH) receptor B4; FOXF2, forkhead box F2; GNB, guanine nucleotide binding protein (G protein); IL, interleukin; IRAK4, interleukin-1 receptor associated kinase-4; KMT2A, lysine (K)-specific methyltransferase 2A; MAPK/ERK, mitogen-activated protein kinase; MEN1, menin; OSM, oncostatin M; PAX8, paired box 8; PDGF, platelet-derived growth factor; PI3K, phosphoinositide 3-kinase; PKNOX1, PBX/knotted 1 homeobox 1; PTEN, phosphatase and tensin homolog; TGFβ, transforming growth factor beta; TNF, tumour necrosis factor; TNFR2, tumour necrosis factor receptor 2; TP53, tumour protein 53; UR, upstream regulators; VEGF, vascular endothelial growth factor.
Fig 3
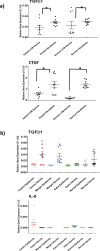
Fig 3. Site-specific contribution to differential gene expression in KD.
(A) Comparison of gene expression between laser-captured dermal tissue (in situ) and fibroblasts for both keloid and normal skin. qRT-PCR graph for both TGFβ1 and CTGF (additional examples found in S2A Fig). All data are mean ± SEM for at least three independent experiments. B) qRT-PCR for TGFβ1 and interleukin-8 (IL-8) showing relative contributions of different keloid sites to overall expression and comparison with normal skin (additional genes available in S2B Fig). Data are mean ± SEM where * p-value <0.05 using Student’s t test and ANOVA with Tukey post hoc correction. CTGF, connective tissue growth factor; TGFβ, transforming growth factor beta.
Fig 4
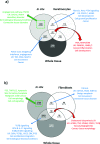
Fig 4. Gene enrichment analysis of microdissected site-specific keloid disease.
Venn diagram of keloid disease (KD) centre, margin and extralesional expression vs normal skin (NS), where A) refers to the epidermis and B) refers to the dermis. The red circle and text refer to the centre vs NS alone, the blue to margin vs NS and the green to extralesional keloid site alone vs NS. The black arrows and text refer to the enrichment results of where the expression of the indicated sites overlap. The orange arrow and text refers to the enrichment analysis of the indicated number of genes in common to all three keloid sites over NS. In both A) and B) enrichment analysis was performed with Ingenuity Pathway Analysis (IPA) and included canonical pathways, diseases & functions, networks and upstream regulators of interest. ANGPT2, angiopoietin 2; BCO1, beta-carotene oxygenase 1; BMP2, bone morphogenetic protein 2; BRD4, bromodomain containing 4; DAB2, Dab, mitogen-responsive phosphoprotein, homolog 2 (drosophila); EGF, epidermal growth factor; EIF3E, eukaryotic translation initiation factor 3 subunit E; EOMES, eomesodermin; FBN1, fibrillin 1; FLT3, fms related tyrosine kinase 3; GSTP1, glutathione s-transferase pi 1; HIF, hypoxia-inducible factor; HOXA13, homeobox A13; IFN, interferon; IGFBP, insulin-like growth factor binding protein; IL, interleukin; IRF, interferon regulatory factor; JAK, janus kinase; MAPK, mitogen-activated protein kinase; MYC, c-Myc; MYOCD, myocardin; NRG1, neuregulin-1; OCT4, octamer-binding transcription factor 4; ORMDL3, orosomucoid like 3; OSM, oncostatin M; PDGF, platelet-derived growth factor; PTEN, phosphatase and tensin homolog; PXR, pregnane X receptor; PRRX1, paired related homeobox 1RXR, retinoid X receptor; SERPINE1(PAI-1), serpin peptidase inhibitor. Clade E (plasminogen activator inhibitor 1); SMO, smoothened; SNAI1, snail family zinc finger 1; SOCS, suppressor of cytokine signalling; SPHK, sphingosine kinase; STAT, signal transducer and activator of transcription; STK11, serine/threonine kinase 11; TGF, transforming growth factor; TGM2, transglutaminase 2; TLE1, transducin like enhancer of split 1; TNF(R), tumour necrosis factor (receptor); TP53, tumour protein 53; TSPYL5, testis-specific protein Y encoded like 5; UR, upstream regulators; VEGF, vascular endothelial growth factor.
Fig 5
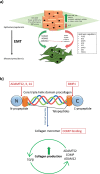
Fig 5. In situ microdissection expression contributing to epithelial-mesenchymal transition (EMT) and collagen production in KD.
A) Schematic diagram of the differentially expressed genes (DEG) in KD that contribute to an activated, hyper-proliferative and inflammatory epidermis. Also depicted are DEG from our microarray data hypothesised to contribute to EMT through upregulation (green arrow) or downregulation (red arrow), which are described along with the upstream regulators identified on enrichment analysis of our microarray data and which have been previously implicated in the EMT process. B) Schematic diagram depicting where ADAMTS and BMP cleave the procollagen peptides to form tropo-collagen and allow collagen fibril assembly necessary for collagen turnover. Once a collagen monomer, it may bind COMP. Collagen production in KD may be increased by the potential existence of positive feedback loops between ADAMTS2/COMP/ADAM12 and TGFβ. ADAM, a disintegrin and metalloproteinase; ADAMTS, a disintegrin and metalloproteinase with thrombospondin motifs; AKR1B10, aldo-keto reductase family 1, member 10; BMP, bone morphogenetic protein; CLDN, claudin; COMP, cartilage oligomeric protein; FGF, fibroblast growth factor; HOX, homeotic gene subset; IL, interleukin; K, keratin; LIMS2, LIM zinc finger domain containing 2; MAPK, mitogen-activated protein kinase; MUCL1, mucin-like 1; S100A8, S100 calcium-binding protein A8; TGFβ, transforming growth factor beta; WDR66, WD repeat domain 66; ZEB, zinc finger E-box-binding proteins.
Fig 6
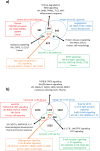
Fig 6. Cytokine relationship with potential inflammatory effects in KD.
Schematic diagram of the possible relationships existing between a number of cytokines and growth factors identified as dysregulated in KD microdissected epidermis and dermis in our microarray data. This figure should be correlated with Table 2 where the direction and fold change for each of these molecules can be found for each site within keloid epidermis and dermis. AP-1, activating protein 1; IL, interleukin; INF, interferon; JAK, janus kinase; MMP, matrix metalloproteinase; NFκB, nuclear factor kappa B; ROR, retinoic acid-related orphan receptor c; STAT, signal transducer and activator of transcription; TGFβ, transforming growth factor beta; TNF, tumour necrosis factor.
Fig 7
Fig 7. qRT-PCR validation of candidate genes.
Four candidate genes were chosen from each of the epidermis and dermis for validation by qRT-PCR. The bar graphs represent the qRT-PCR data for the microdissected keloid sites and normal skin and the line graph represents the associated microarray fold change in gene expression. In all cases the line graph follows the trend of the bar graph indicating the PCR reflects the microarray, thus validating the data. Data are presented as mean ± SEM and are from at least three independent experiments. For some of the genes there was no expression in normal skin and therefore for those genes no fold change for the qRT-PCR could be generated. In the interest of standardisation of all of the graphs they were then presented with the two axes. ADAM, a disintegrin and metalloproteinase; ADAMTS, a disintegrin and metalloproteinase with thrombospondin motifs; BMP2, bone morphogenetic protein 2; CD36, cluster of differentiation 36; COMP, cartilage oligomeric protein; NOTCH4, notch 4; WDR66, WD repeat domain 66.
Fig 8
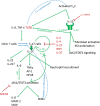
Fig 8. Summary figure of proposed processes and mechanisms contributing to keloid disease based on identification of DEG and subsequent analysis.

References

    1. Jumper N, Paus R, Bayat A. Functional histopathology of keloid disease. Histol Histopathol. 2015;30: 1033–57. 10.14670/HH-11-624 - DOI - PubMed
    1. Berman B, Kaufman J. Pilot study of the effect of postoperative imiquimod 5% cream on the recurrence rate of excised keloids. Journal of the American Academy of Dermatology. 2002;47: S209–11. - PubMed
    1. Marttala J, Andrews JP, Rosenbloom J, Uitto J. Keloids: Animal models and pathologic equivalents to study tissue fibrosis. Matrix Biol. 2016. - PMC - PubMed
    1. Butler PD, Longaker MT, Yang GP. Current progress in keloid research and treatment. J Am Coll Surg. 2008;206: 731–41. 10.1016/j.jamcollsurg.2007.12.001 - DOI - PubMed
    1. Seifert O, Bayat A, Geffers R, Dienus K, Buer J, Lofgren S, et al. Identification of unique gene expression patterns within different lesional sites of keloids. Wound repair and regeneration: official publication of the Wound Healing Society [and] the European Tissue Repair Society. 2008;16: 254–65. - PubMed

MeSH terms