. 2017 Mar 3;15(1):18.
doi: 10.1186/s12915-017-0357-7.

Meta-evaluation of meta-analysis: ten appraisal questions for biologists

Affiliations

Meta-evaluation of meta-analysis: ten appraisal questions for biologists

Shinichi Nakagawa et al. BMC Biol. .

Abstract

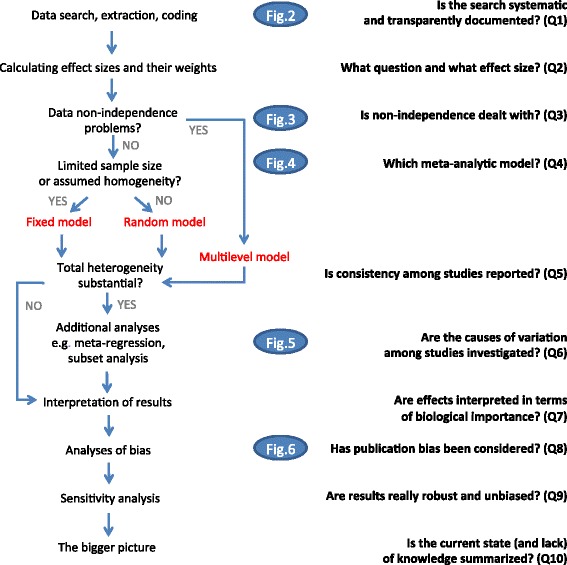
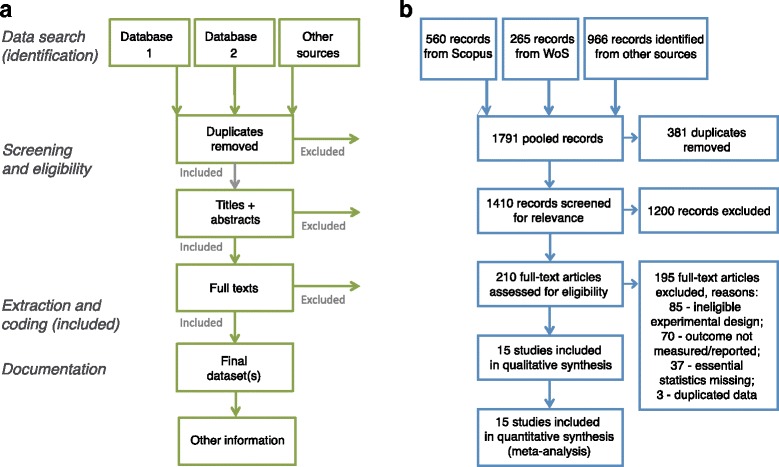
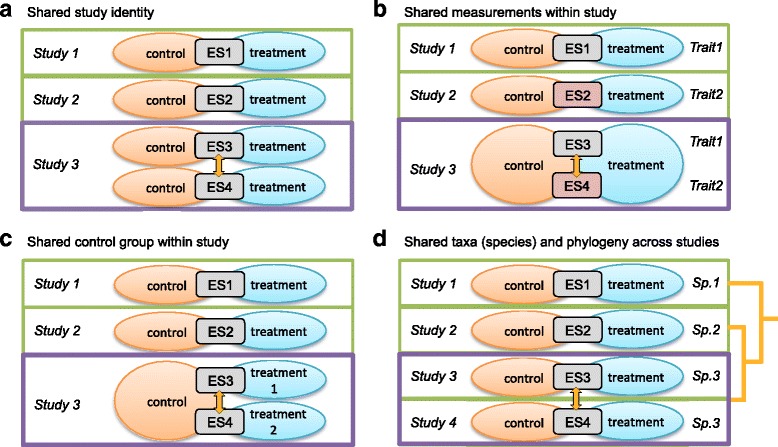
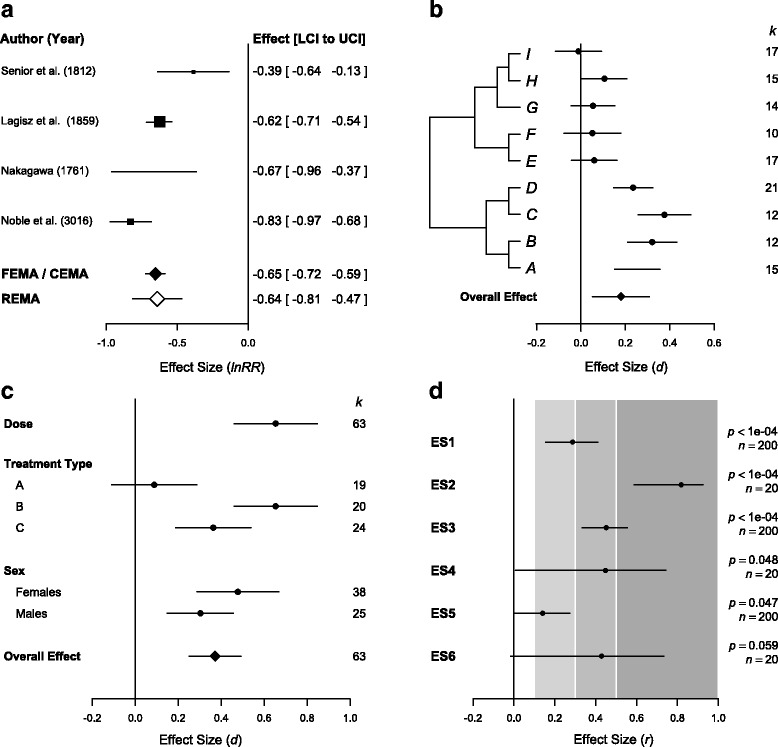
Meta-analysis is a statistical procedure for analyzing the combined data from different studies, and can be a major source of concise up-to-date information. The overall conclusions of a meta-analysis, however, depend heavily on the quality of the meta-analytic process, and an appropriate evaluation of the quality of meta-analysis (meta-evaluation) can be challenging. We outline ten questions biologists can ask to critically appraise a meta-analysis. These questions could also act as simple and accessible guidelines for the authors of meta-analyses. We focus on meta-analyses using non-human species, which we term 'biological' meta-analysis. Our ten questions are aimed at enabling a biologist to evaluate whether a biological meta-analysis embodies 'mega-enlightenment', a 'mega-mistake', or something in between.

Keywords: Biological importance; Effect size; Meta-regression; Meta-research; Non-independence; Publication bias; Quantitative synthesis; Reporting bias; Statistical significance; Systematic review.


Figures

Fig. 1.
Fig. 1.
Mapping the process (on the left) and main evaluation questions (on the right) for meta-analysis. References to the relevant figures (Figs. 2, 3, 4, 5 and 6) are included in the blue ovals
Fig. 2.
Fig. 2.
Preferred Reporting Items for Systematic Reviews and Meta-Analyses. (PRISMA). a The main components of a systematic review or meta-analysis. The data search (identification) stage should, ideally, be preceded by the development of a detailed study protocol and its preregistration. Searching at least two literature databases, along with other sources of published and unpublished studies (using backward and forward citations, reviews, field experts, own data, grey and non-English literature) is recommended. It is also necessary to report search dates and exact keyword strings. The screening and eligibility stage should be based on a set of predefined study inclusion and exclusion criteria. Criteria might differ for the initial screening (title, abstract) compared with the full-text screening, but both need to be reported in detail. It is good practice to have at least two people involved in screening, with a plan in place for disagreement resolution and calculating disagreement rates. It is recommended that the list of studies excluded at the full-text screening stage, with reasons for their exclusion, is reported. It is also necessary to include a full list of studies included in the final dataset, with their basic characteristics. The extraction and coding (included) stage may also be performed by at least two people (as is recommended in medical meta-analysis). The authors should record the figures, tables, or text fragments within each paper from which the data were extracted, as well as report intermediate calculations, transformations, simplifications, and assumptions made during data extraction. These details make tracing mistakes easier and improve reproducibility. Documentation should include: a summary of the dataset, information on data and study details requested from authors, details of software used, and code for analyses (if applicable). b It is now becoming compulsory to present a PRISMA diagram, which records the flow of information starting from the data search and leading to the final data set. WoS Web of Science
Fig. 3.
Fig. 3.
Common sources of non-independence in biological meta-analyses. ad Hypothetical examples of the four most common scenarios of non-independence (a-d). Orange lines and arrows indicate correlations between effect sizes. Effect size estimate (gray boxes, ‘ES’) is the ratio of (or difference between) the means of two groups (control versus treatment). Scenarios a, b, and d may apply to other types of effect sizes (e.g., correlation), while scenario c is unique to situations where two or more groups are compared to one control group. a Multiple effect sizes can be calculated from a single study. Effect sizes in study 3 are not independent of each other because effects (ES3 and ES4) are derived from two experiments using samples from the same population. For example, a study exposed females and males to increased temperatures, and the results are reported separately for the two sexes. b Effect sizes taken from the same study (study 3) are derived from different traits measured from the same subjects, resulting in correlations among these effect sizes. For example, body mass and body length are both indicators of body size, with studies 1 and 2 reporting just one of these measurements and study 3 reporting both for the same group of individuals. c Effect sizes can be correlated via contrast with a common ‘control’ group of individuals; for example, both effect sizes from study 3 share a common control treatment. A study may, for example, compare a balanced diet (control) with two levels of a protein-enriched diet. d In a multi-species study effect sizes can be correlated when they are based on data from organisms from the same taxonomic unit, due to evolutionary history. Effect sizes taken from studies 3 and 4 are not independent, because these studies were performed on the same species (Sp.3). Additionally, all species share a phylogenetic history, and thus all effect sizes can be correlated with one another in accordance with time since evolutionary divergence between species
Fig. 4.
Fig. 4.
Visualizations of the three main types of meta-analytic models and their assumptions. a The fixed-effect model can be written as y i = b 0 + e i, where y i is the observed effect for the ith study (i = 1…k; orange circles), b 0 is the overall effect (overall mean; thick grey line and black diamond) for all k studies and e i is the deviation from b 0 for the ith study (dashed orange lines), and e i is distributed with the sampling variance ν i (orange curves); note that this variance is sometimes called within-study variance in the literature, but we reserve this term for the multilevel model below. b The random-effects model can be written as y i = b 0 + s i + e i, where b 0 is the overall mean for different studies, each of which has a different study-specific mean (green squares and green solid lines), deviating by s i (green dashed lines) from b 0, s i is distributed with a variance of τ 2 (the between-study variance; green curves); note that this is the conventional notation for the between-study variance, but in a biological meta-analysis, it can be referred to as, say, σ 2 [study]. The other notation is as above. Displayed on the top-right is the formula for the heterogeneity statistic, I 2 for the random-effects model, where v¯ is a typical sampling variance (perhaps, most easily conceptualized as the average value of sampling variances, ν i). c The simplest multilevel model can be written as y ij = b 0 + s i + u ij + e ij, where u ij is the deviation from s i for jth effect size for the ith study (blue triangles and dashed blue lines) and is distributed with the variance of σ 2 (the within-study variance or it may be denoted as σ 2 [effect size]; blue curves), e ij is the deviation from u ij, and the other notations are the same as above. Each of k studies has m effect sizes (j = 1…m). Displayed on the top-right is the multilevel meta-analysis formula for the heterogeneity statistic, I 2, where both the numerator and denominator include the within-study variance, σ 2, in addition to what appears in the formula for the random-effects model
Fig. 5.
Fig. 5.
Examples of forest plots used in a biological meta-analysis to represent effect sizes and their associated precisions. a A conventional forest plot displaying the magnitude and uncertainty (95% confidence interval, CI) of each effect size in the dataset, as well as reporting the associated numerical values and a reference to the original paper. The sizes of the shapes representing point estimates are usually scaled based on their precision (1/Standard error). Diamonds at the bottom of the plot display the estimated overall mean based on both fixed-effect meta-analysis/‘common-effect’ meta-analysis (FEMA/CEMA) and random-effects meta-analysis (REMA) models. b A forest plot that has been augmented to display a phylogenetic relationship between different taxa in the analysis; the estimated d seems on average to be higher in some clades than in the others. A diamond at the bottom summarizes the aggregate mean as estimated by a multi-level meta-analysis accounting for the given phylogenetic structure. On the right is the number of effect sizes for each species (k), although similarly one could also display the number of individuals/sample-size (n), where only one effect size per species is included. c As well as displaying overall effect (diamond), forest plots are sometimes used to display the mean effects from different sub-groups of the data (e.g., effects separated by sex or treatment type), as estimated with data sub-setting or meta-regression, or even a slope from meta-regression (indicating how an effect changes with increasing continuous variable, e.g., dosage). d Different magnitudes of correlation coefficient (r), and associated 95% CIs, p values, and the sample size on which each estimate is based. The space is shaded according to effect magnitude based on established guidelines; light grey, medium grey, and dark grey correspond to small, medium, and large effects, respectively
Fig. 6.
Fig. 6.
Graphical assessment tools for testing for publication bias. a A funnel plot showing greater variance among effects that have larger standard errors (SE) and that are thus more susceptible to sampling variability. Some studies in the lower right corner of the plot, opposite to most major findings, with large SE (less likely to detect significant results) are potentially missing (not shown), suggesting publication bias. b Often funnel plots are depicted using precision (1/SE), giving a different perspective of publication bias, where studies with low precision (or large SE) are expected to show greater sampling variability compared to studies with high precision (or low SE). Note that the data in panel b are the same as in panel a, except that a trim-and-fill analysis has been performed in b. A trim-and-fill analysis estimates the number of studies missing from the meta-analysis and creates ‘mirrored’ studies on the opposite side of the funnel (unfilled dots) to estimate how the overall effect size estimate is impacted by these missing studies. c Radial (Galbraith) plot in which the slope should be close to zero, if little publication bias exists, indicating little asymmetry in a corresponding funnel plot (compare it with b); radial plots are closely associated with Egger’s tests. d Cumulative meta-analysis showing how the effect size changes as the number of studies on a particular topic increases. In this situation, the addition of effect size estimates led to convergence on an overall estimate of 0.36, and the confidence intervals decrease as the precision of the estimate increases. e Bubble plot showing a temporal trend in effect size (Zr) across years. Here effect sizes are weighted by their precision; larger bubbles indicate more precise estimates and smaller bubbles less precise. f Bubble plot of the relationship between effect size and impact factors of journals, indicating that larger magnitudes of effect sizes (the absolute values of Zr) tend to be published in higher impact journals

References

    1. Glass GV. Primary, secondary, and meta-analysis research. Educ Res. 1976;5:3–8. doi: 10.3102/0013189X005010003. - DOI
    1. Glass GV. Meta-analysis at middle age: a personal history. Res Synth Methods. 2015;6(3):221–31. doi: 10.1002/jrsm.1133. - DOI - PubMed
    1. Cooper H, Hedges LV, Valentine JC. The handbook of research synthesis and meta-analysis. New York: Russell Sage Foundation; 2009.
    1. Hedges L, Olkin I. Statistical methods for meta-analysis. New York: Academic Press; 1985.
    1. Egger M, Smith GD, Altman DG. Systematic reviews in health care: meta-analysis in context. 2. London: BMJ; 2001.

Publication types

LinkOut - more resources