. 2017 Mar 2;65(5):832-847.e4.
doi: 10.1016/j.molcel.2017.01.029.

Functions of Replication Protein A as a Sensor of R Loops and a Regulator of RNaseH1

Affiliations

Functions of Replication Protein A as a Sensor of R Loops and a Regulator of RNaseH1

Hai Dang Nguyen et al. Mol Cell. .

Abstract

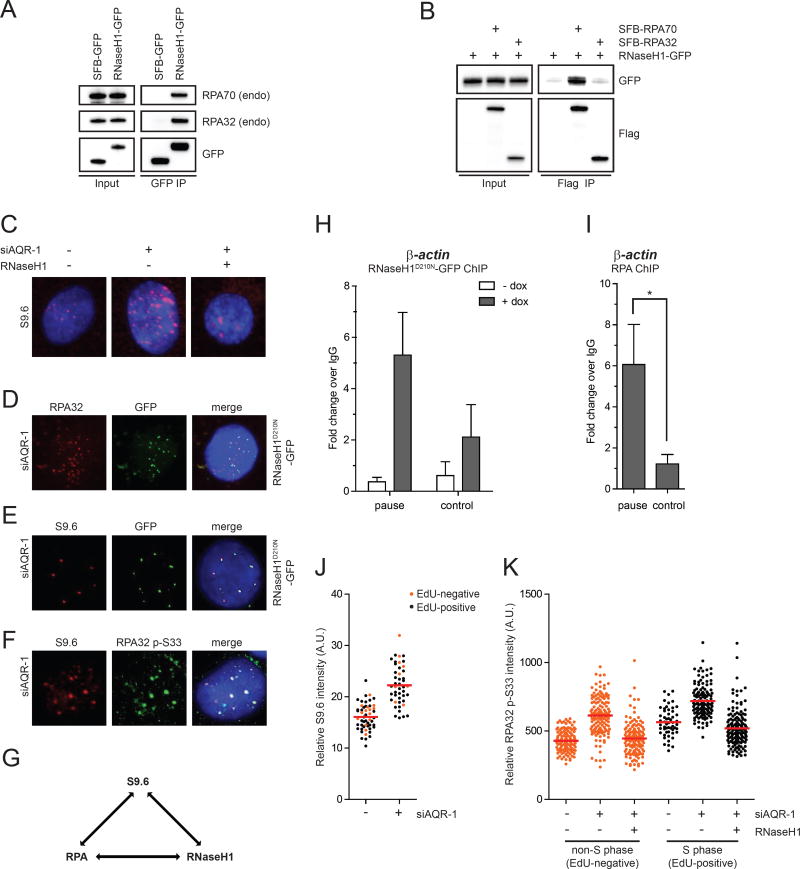
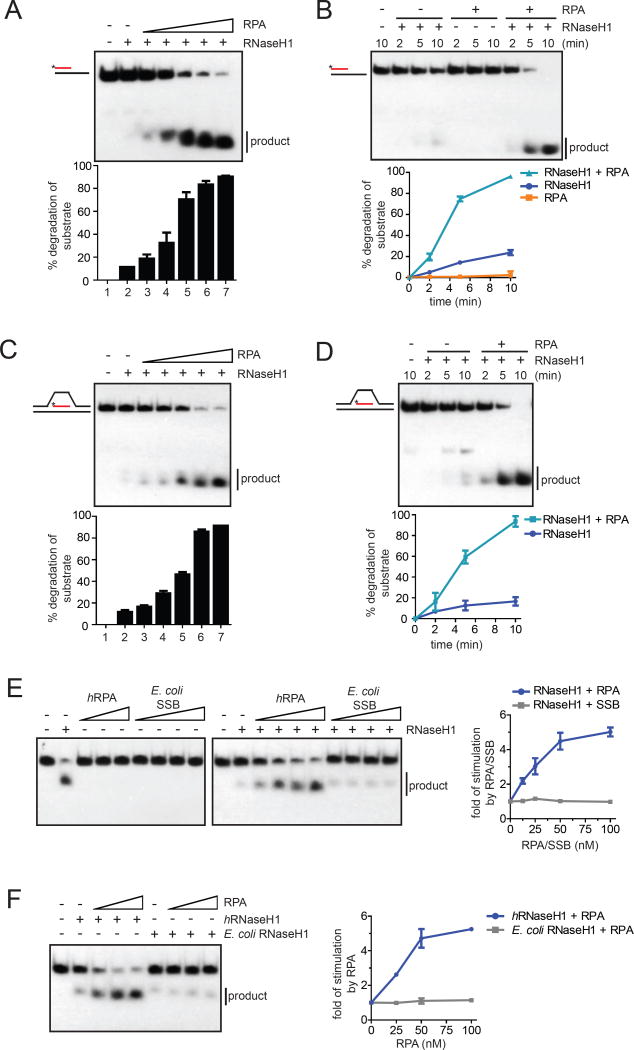
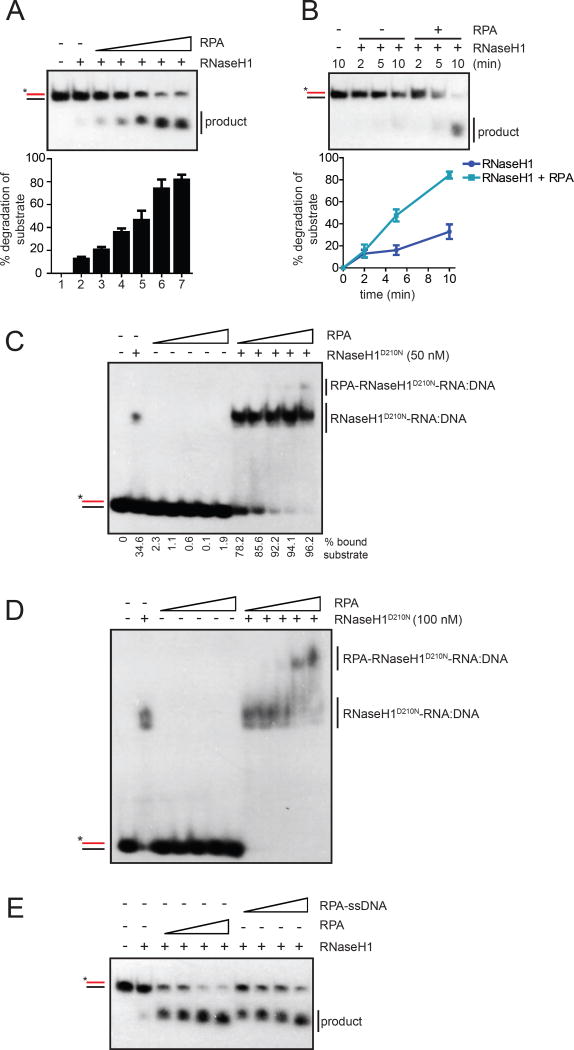
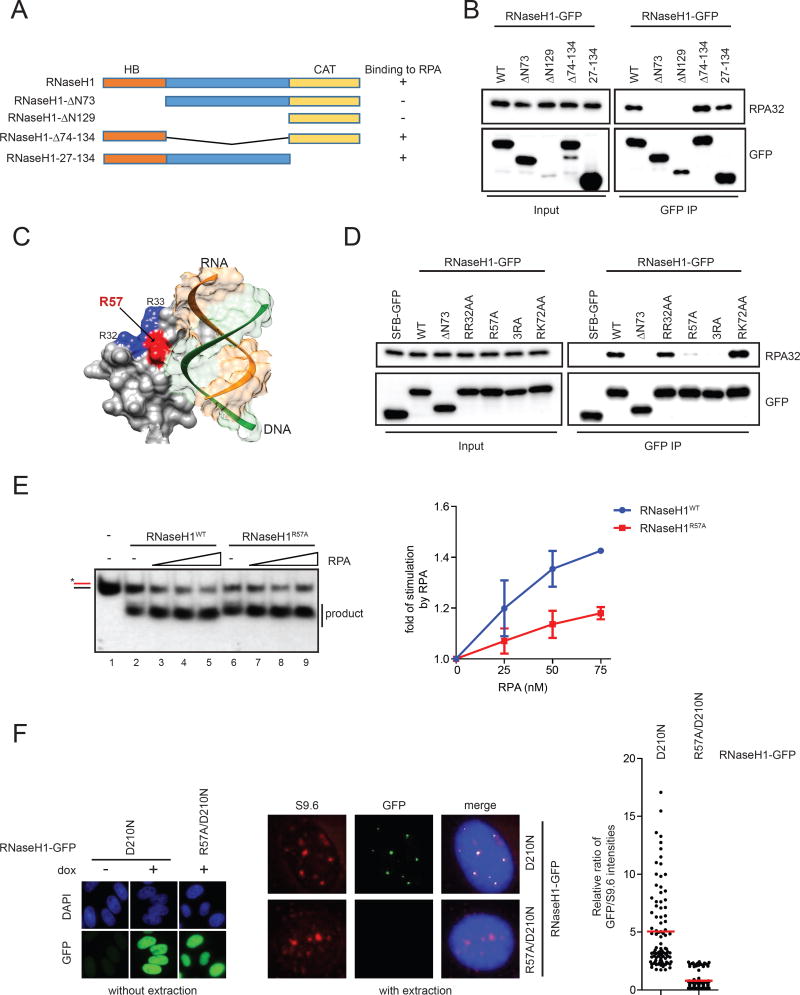
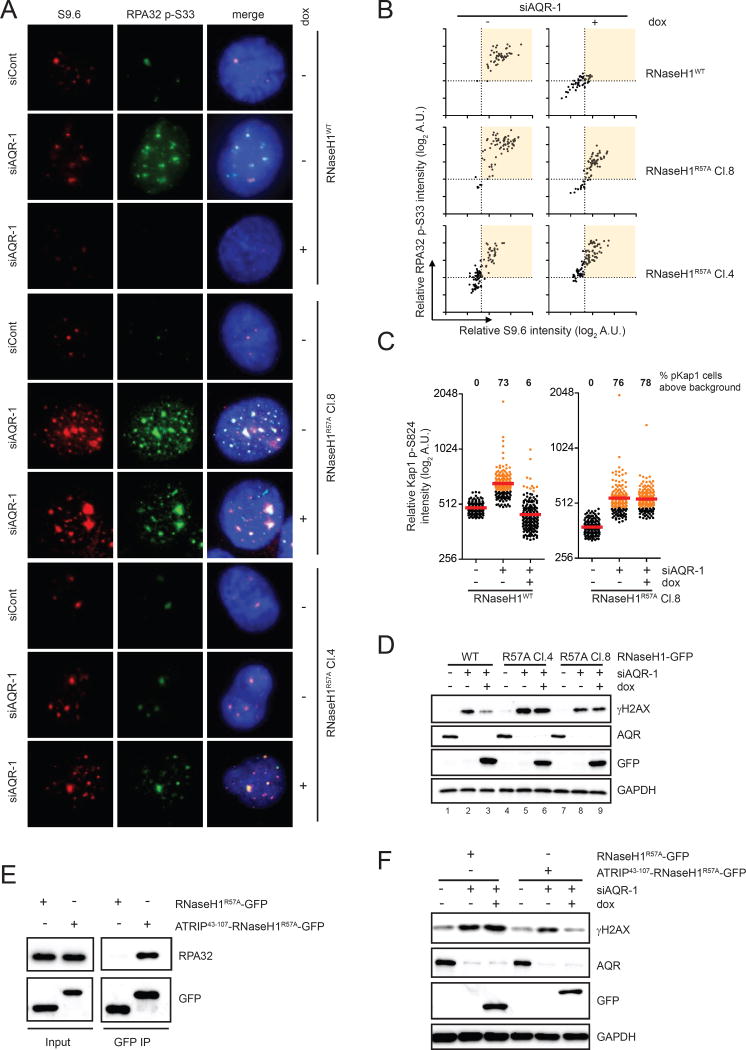
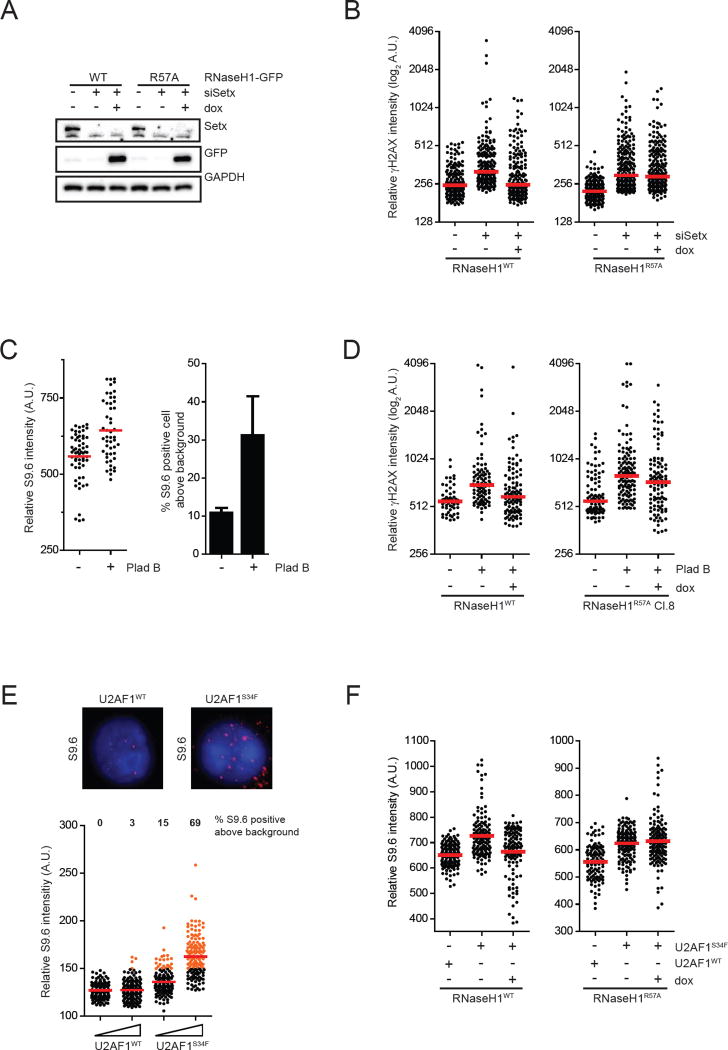
R loop, a transcription intermediate containing RNA:DNA hybrids and displaced single-stranded DNA (ssDNA), has emerged as a major source of genomic instability. RNaseH1, which cleaves the RNA in RNA:DNA hybrids, plays an important role in R loop suppression. Here we show that replication protein A (RPA), an ssDNA-binding protein, interacts with RNaseH1 and colocalizes with both RNaseH1 and R loops in cells. In vitro, purified RPA directly enhances the association of RNaseH1 with RNA:DNA hybrids and stimulates the activity of RNaseH1 on R loops. An RPA binding-defective RNaseH1 mutant is not efficiently stimulated by RPA in vitro, fails to accumulate at R loops in cells, and loses the ability to suppress R loops and associated genomic instability. Thus, in addition to sensing DNA damage and replication stress, RPA is a sensor of R loops and a regulator of RNaseH1, extending the versatile role of RPA in suppression of genomic instability.

Keywords: R loop; RNase H1; RPA; genome instability; splicing inhibitor; splicing mutation; ssDNA.


Figures

Fig. 1
Fig. 1. RPA interacts with RNaseH1 and colocalizes with RNaseH1 and R loops
(A) RNaseH1-GFP (the mitochondrial localization signal of RNaseH1 was removed) or SFB-GFP was expressed in HEK293T cells and immunoprecipitated using anti-GFP antibody. Endogenous RPA32 associated with RNaseH1-GFP was detected by Western blot. Cell lysates (1%) were loaded as input. (B) RNaseH1-GFP was expressed in HEK293T cells either alone or in combination with SFB-RPA70 or SFB-RPA32 and immunoprecipitated using anti-Flag antibody conjugated to agarose beads. Indicated tagged proteins were detected by Western blot. (C) HeLa-derived RNaseH1 inducible cells were transfected with control or AQR siRNA and cultured for 60 h. RNaseH1 expression was induced by doxycycline for 48 h. R loop levels in individual cells were analyzed using the S9.6 antibody. Representative images for each condition are shown. S9.6 intensity quantification and expression of RNaseH1-GFP are shown in Fig. S1E–F. (D-G) Pair-wise colocalization of RNaseH1D210N-GFP, endogenous RPA32 (or RPA32 p-S33), and R loops (S9.6 foci) were analyzed in AQR knockdown cells as indicated in D, E, and F. RNaseH1D210N-GFP was induced in D and E similar to C. A summary of the three-way colocalization is shown in G. (H-I) HeLa-derived RNaseH1D210N-GFP cells were induced with doxycycline for 48 h prior to fixation and fragmented. Chromatin was immunoprecipitated using anti-GFP (in H) and anti-RPA32 (in I). The association of RNaseH1D210N and RPA with the indicated loci was analyzed by ChIP-qPCR (n=3). Asterisks indicate p<0.05. (J) HeLa cells were transfected with control or AQR siRNA and cultured for 48 h. S-phase and non-S-phase cells were distinguished by 30-min EdU labeling. R loop levels in individual cells were analyzed with the S9.6 antibody (n=50). Red bars represent the mean S9.6 intensities of the indicated cell populations. (K) HeLa-derived cells were transfected with control or AQR siRNA and induced to express RNaseH1-GFP as indicated. S-phase and non-S-phase cells were distinguished by EdU labeling as in J. Levels of RPA32 p-S33 in individual cells were analyzed with the RPA p-S33 antibody (n>100). Red bars represent the mean RPA32 p-S33 intensities of the indicated cell populations. See also Fig. S1.
Fig. 2
Fig. 2. RPA stimulates the activity of RNaseH1 on R loops
(A) The R:D+ssDNA substrate with 32P-labeled RNA (25 nM) was incubated with RNaseH1 (2 nM) and increasing concentrations of RPA (0, 12.5, 25, 50, 100, 200 nM) for 5 min. The fractions of substrate cleaved by RNaseH1 were quantified. Data are presented as mean ± SD (n=3). (B) The R:D+ssDNA substrate (100 nM) was incubated with RNaseH1 (5 nM), RPA (100 nM), or both for the indicated amounts of time. Data are presented as mean ± SD (n=3). (C-D) In C, the R loop substrate (25 nM) was incubated with RNaseH1 (2 nM) and increasing concentrations of RPA (0, 12.5, 25, 50, 100, 200 nM) for 5 min. In D, the R loop substrate (100 nM) was incubated with RNaseH1 (2 nM) in the presence or absence of RPA (100 nM) for the indicated amounts of time. Data are presented as mean ± SD (n=3). (E) Left panel, RNA:DNA hybrid (25 nM) was incubated human RPA (0, 12.5*, 25, 50, 100 nM) or E. coli SSB (0, 12.5, 25, 50, 100 nM) in the presence or absence of human RNaseH1 for 5 min. *: only used in the presence of RNaseH1. Right panel, the cleavage of substrate was quantified, and the fold of simulation by RPA was determined. Data are presented as mean ± SD (n=3). (F) Left panel, RNA:DNA hybrid (25 nM) was incubated with human (2 nM) or E. coli RNaseH1 (0.05 nM) and increasing concentrations of human RPA (0, 25, 50, 100 nM). Right panel, the fold of stimulation by RPA was measured as in E. Data are presented as mean ± SD (n=3). See also Fig. S2.
Fig. 3
Fig. 3. RPA promotes association of RNaseH1 with RNA:DNA hybrids
(A-B) In A, the R:D substrate (25 nM) was incubated with RNaseH1 (2 nM) and increasing concentrations of RPA (0, 6.25, 12.5, 25, 50, 100 nM) for 5 min. In B, the R:D substrate (100 nM) was incubated with RNaseH1 (5 nM) in the presence or absence of RPA (100 nM) for the indicated amounts of time. The cleavage of substrate was quantified. Data are presented as mean ± SD (n=3). (C) A 25-bp probe of RNA:DNA hybrid (25 nM) was labeled with 32P and incubated with increasing concentrations of RPA (0, 25, 50, 100, 200, 400 nM) in the presence or absence of RNaseH1D201N (50 nM). The RNaseH1D210N-RNA:DNA complex was detected on a native polyacrylamide gel. (D) The RNA:DNA probe (20 nM) was incubated with RNaseH1D210N (100 nM) and increasing concentrations of RPA (0, 50, 100, 200, 400, 800 nM). The tertiary RPA-RNaseH1D210N-RNA:DNA complex was detected on a native polyacrylamide gel. (E) Increasing concentration of RPA (12.5, 25, 50 and 100 nM) were incubated without or with 80-nt ssDNA (1, 2, 4 and 8 nM, respectively) for 5 min (to form fully covered RPA-ssDNA complex) and RNaseH1WT (2 nM) was incubated for 5 min. Then after R:D substrate (25 nM) was incubated for 5 min in Buffer A with 50 mM KCl. See also Fig. S3.
Fig. 4
Fig. 4. RNaseH1R57A is compromised for RPA binding and RPA-mediated regulation
(A) A schematic representation of the domain structure of the nuclear RNaseH1. A summary of the RNaseH1 fragments tested in this study and their abilities to interact with RPA is shown on the right. (B) GFP-tagged RNaseH1 and the indicated mutant derivatives were expressed in HEK293T cells and immunoprecipitated using anti-GFP antibody. GFP and RPA32 in the immunoprecipitates were analyzed by Western blot. Cell lysates (0.5%) were loaded as input. (C) A structural image of the hybrid domain of human RNaseH1 (Nowotny et al., 2008) with a modeled RNA:DNA hybrid substrate was generated using the UCSF Chimera software (PDB ID: 3BSU) (Pettersen et al., 2004). Positively charged residues R32 and R33 are colored in blue, and R57 is highlighted in red. (D) GFP-tagged RNaseH1 and the indicated mutants were expressed in HEK293T cells and tested for RPA binding as in B. Cell lysates (0.5%) were loaded as input. (E) The R:D substrate (25 nM) substrate was incubated with RNaseH1WT (2 nM) or RNaseH1R57A (1 nM) and increasing concentrations of RPA (0, 25, 50, 75 nM) for 5 min in Buffer A with 150 mM KCl. The cleavage of substrate was quantified, and the fold of stimulation by RPA was determined. Data are presented as mean ± SD (n=3). (F) Left panel, induction of RNaseH1D210N-GFP and RNaseH1R57A/D210N-GFP was confirmed using anti-GFP antibody. Cells were not extracted with triton, and soluble GFP proteins were detected. Middle panel, localizations of GFP-tagged RNaseH1 proteins and R loops were analyzed with GFP and S9.6 antibodies. Cells were extracted and fixed with methanol/acetic acid, and only chromatin-bound proteins were detected. Right panel, intensities of S9.6 and GFP foci were quantified in individual cells, and GFP/S9.6 ratios were determined (n=100). Red bars represent the mean GFP/S9.6 ratios of the indicated cell populations. See also Fig. S4.
Fig. 5
Fig. 5. RNaseH1R57A fails to suppress R loops and associated genomic instability
(A-B) Inducible cell lines of RNaseH1WT-GFP or RNaseH1R57A-GFP were transfected with control or AQR siRNA and cultured for 60 h. GFP-tagged RNaseH1 proteins were induced by doxycycline for 48 h. Cells were analyzed by immunofluorescence using RPA32 p-S33 and S9.6 antibodies. Representative images are shown in A. Intensities of p-RPA32 and S9.6 staining were quantified in individual cells and plotted in 2-dimensional blots in B (n=80). Induction of RNaseH1WT and RNH1R57A was confirmed by immunofluorescence and Western blot in Fig. S5A and S5B. (C) Inducible cell lines of RNaseH1WT and RNH1R57A were transfected with control or AQR siRNA and induced by doxycycline for 48 h. Levels of Kap1 p-S824 in individual cells were analyzed by immunofluorescence (n>150). Red bars represent the mean p-Kap1 intensities of the indicated cell populations. AQR knockdown cells with p-Kap1 signals above the control cells are colored in orange, and the percentages of these cells in their respective cell populations were quantified. (D) Inducible cell lines of RNaseH1WT and RNH1R57A were treated as in C. Levels of γH2AX and other indicated proteins were analyzed by Western blot. (E) ATRIP43-107-RNaseH1R57A-GFP and RNaseH1R57A-GFP was expressed in HEK293T cells and immunoprecipitated using anti-GFP antibody. Endogenous RPA32 associated with RNaseH1-GFP was detected by Western blot. (F) Inducible cell lines of RNaseH1WT-GFP or RNaseH1R57A-GFP were treated as in D. Levels of γH2AX and other indicated proteins were analyzed by Western blot. See also Fig. S5.
Fig. 6
Fig. 6. RNaseH1R57A fails to suppress R loops in a variety of contexts
(A-B) Inducible cell lines of RNaseH1WT-GFP or RNaseH1R57A-GFP were transfected with control or SETX siRNA and cultured for 60 h. GFP-tagged RNaseH1 proteins were induced by doxycycline for 48 h. In A, levels of indicated proteins were analyzed by Western blot. In B, levels of γH2AX in individual cells were analyzed by immunofluorescence (n>180). Red bars represent the median γH2AX intensities of the indicated cell populations. (C) HeLa cells were either treated with DMSO or 1nM Plad-B for 24 h. Left panel, intensities of S9.6 staining in individual cells were analyzed by immunofluorescence (n>50). Red bars represent the mean S9.6 intensities of the indicated cell populations. Percent of S9.6 positive cells were calculated and plotted on the right panel (n=3). (D) Inducible cell lines of RNaseH1WT-GFP or RNaseH1R57A-GFP were either treated with DMSO or Plad-B for 24h. RNaseH1-GFP proteins were expressed 24 h prior to and the whole duration of Plad-B treatment. Levels of γH2AX in individual cells were analyzed by immunofluorescence (n>60). Red bars represent the median γH2AX intensities of the indicated cell populations. (E) K562-derived cells stably expressing different levels of either U2AF1WT or U2AF1S34F were seeded for 48h prior to analysis by immunofluorescence using S9.6 antibody. Representative images are shown on the top panel. Bottom panels, intensities of S9.6 staining in individual cells were analyzed by immunofluorescence (n>130). Red bars represent the mean S9.6 intensities of the indicated cell populations. Protein expression levels of U2AF1WT and U2AF1S34F are shown in Fig. S6A. (F) Inducible cell lines of RNaseH1WT-GFP or RNaseH1R57A-GFP were stably expressing either U2AF1WT or U2AF1S34F for 60 h. RNaseH1-GFP proteins were expressed by addition of doxycycline. Intensities of S9.6 staining in individual cells from two experiments were combined and analyzed by immunofluorescence (n>100). Red bars represent the mean S9.6 intensities of the indicated cell populations. Protein expression levels of U2AF1WT and U2AF1S34F are shown in Fig. S6B. See also Fig. S6.

References

    1. Alzu A, Bermejo R, Begnis M, Lucca C, Piccini D, Carotenuto W, Saponaro M, Brambati A, Cocito A, Foiani M, et al. Senataxin associates with replication forks to protect fork integrity across RNA-polymerase-II-transcribed genes. Cell. 2012;151:835–846. - PMC - PubMed
    1. Arora R, Lee Y, Wischnewski H, Brun CM, Schwarz T, Azzalin CM. RNaseH1 regulates TERRA-telomeric DNA hybrids and telomere maintenance in ALT tumour cells. Nat. Commun. 2014;5:5220. - PMC - PubMed
    1. Bhatia V, Barroso SI, García-Rubio ML, Tumini E, Herrera-Moyano E, Aguilera A. BRCA2 prevents R-loop accumulation and associates with TREX-2 mRNA export factor PCID2. Nature. 2014;511:362–365. - PubMed
    1. Boguslawski SJ, Smith DE, Michalak MA, Mickelson KE, Yehle CO, Patterson WL, Carrico RJ. Characterization of monoclonal antibody to DNA.RNA and its application to immunodetection of hybrids. J. Immunol. Methods. 1986;89:123–130. - PubMed
    1. Bubeck D, Reijns MAM, Graham SC, Astell KR, Jones EY, Jackson AP. PCNA directs type 2 RNase H activity on DNA replication and repair substrates. Nucleic Acids Res. 2011;39:3652–3666. - PMC - PubMed

MeSH terms