

Extraction frequencies at a university orthodontic clinic in the 21st century: Demographic and diagnostic factors affecting the likelihood of extraction
- PMID: 28257729
- PMCID: PMC5338460
- DOI: 10.1016/j.ajodo.2016.08.021
Extraction frequencies at a university orthodontic clinic in the 21st century: Demographic and diagnostic factors affecting the likelihood of extraction
Abstract
Introduction: The aims of this study were to report contemporary orthodontic extraction frequencies at a university center and to investigate what patient-related factors might influence the likelihood of extraction.
Methods: The records of 2184 consecutive patients treated at the University of North Carolina from 2000 to 2011 were analyzed. Year-by-year rates for overall orthodontic extractions and for extraction of 4 first premolars were calculated. Logistic regression, adjusting for all recorded patient risk factors for extraction, was used to examine both the changes in extraction frequencies over time and the influence of individual patient factors on the odds of extraction.
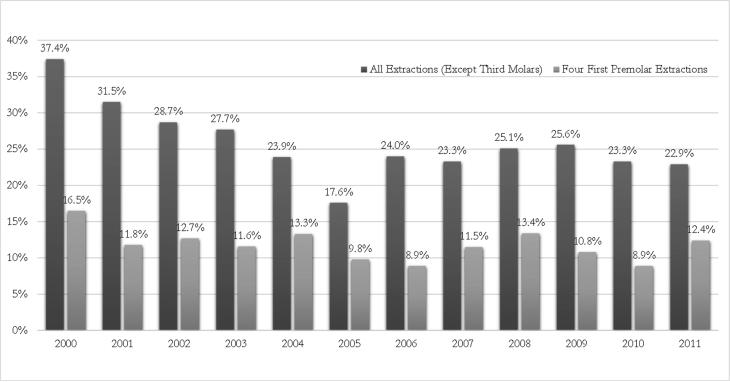
Results: Small linear decreases in orthodontic extraction frequency overall (OR, 0.91; 95% CI, 0.88-0.95) and in extraction of 4 first premolars (OR, 0.95; 95% CI, 0.90-0.99) were seen. The overall extraction rate was 37.4% in 2000, and it fell just below 25% from 2006 onward. Four first premolar extraction rates ranged from 8.9% to 16.5%. Extractions were significantly more likely as crowding and overjet increased (OR, 1.2; 95% CI, 1.14-1.25; OR, 1.1; 95% CI. 1.07-1.19), as overbite decreased (OR, 0.8; 95% CI, 0.77-0.89), with Class II dental or skeletal relationships (OR, 1.5; 95% CI, 1.12- 2.05; OR, 1.4; 95% CI, 1.04-1.85), and for nonwhite patients (OR, 3.0; 95% CI, 2.2-4.06 for other races; OR, 4.1; 95% CI, 3.03-5.66 for African Americans).
Conclusions: Extractions were just as likely to be associated with Class II dental and skeletal problems and with open-bite problems as with crowding alone.
Copyright © 2016 American Association of Orthodontists. Published by Elsevier Inc. All rights reserved.
Comment in
-
Extraction frequencies.Am J Orthod Dentofacial Orthop. 2017 Jul;152(1):9. doi: 10.1016/j.ajodo.2017.04.008. Am J Orthod Dentofacial Orthop. 2017. PMID: 28651772 No abstract available.
References
-
- Proffit WR. Forty-year review of extraction frequencies at a university orthodontic clinic. Angle Orthod. 1994;64(6):407–14. - PubMed
-
- O'Connor BM. Contemporary trends in orthodontic practice: a national survey. Am J Orthod Dentofacial Orthop. 1993 Feb;103(2):163–70. - PubMed
-
- Peck S, Peck H. Frequency of tooth extraction in orthodontic treatment. Am J Orthod. 1979 Nov;76(5):491–6. - PubMed
-
- Weintraub JA, Vig PS, Brown C, Kowalski CJ. The prevalence of orthodontic extractions. Am J Orthod Dentofacial Orthop. 1989 Dec;96(6):462–6. - PubMed
MeSH terms
Grants and funding
LinkOut - more resources
Full Text Sources
Other Literature Sources
