

Comment
doi: 10.1158/1078-0432.CCR-16-2926.
Epub 2017 Mar 3.
Can an Immune Checkpoint Inhibitor (Sometimes) Make Things Worse?
Affiliations
- PMID: 28258060
- PMCID: PMC7372951
- DOI: 10.1158/1078-0432.CCR-16-2926
Item in Clipboard
Comment
Can an Immune Checkpoint Inhibitor (Sometimes) Make Things Worse?
Clin Cancer Res.
.
Abstract
Champiat and colleagues suggest that a small subset of patients at their center treated with PD1/PDL1 inhibitors appear to exhibit hyperprogression of disease. This commentary goes over some limitations in their preliminary analysis, a possible mechanism to explain the phenomenon, and a means by which other investigators can attempt to validate and further characterize these results. Clin Cancer Res; 23(8); 1879-81. ©2017 AACRSee related article by Champiat et al., p. 1920.
©2017 American Association for Cancer Research.
Conflict of interest statement
No potential conflicts of interest were disclosed.
Figures
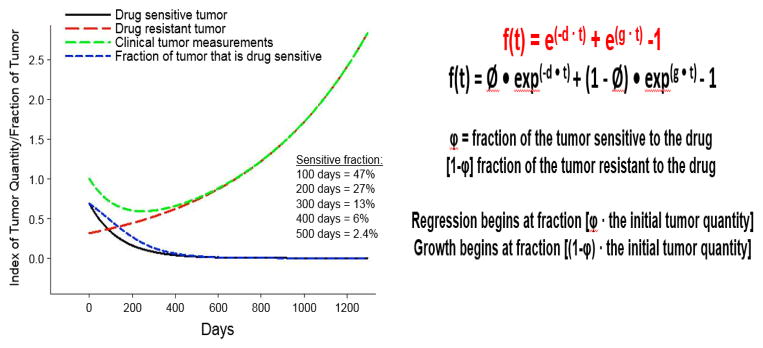
Panel A: In the tumor growth rate model developed by Stein and Fojo, tumors are composed of fractions of cells which are either sensitive or resistant to a drug being studied. As a result, an initial regression of a tumor may be transient if tumor cells resistant to the therapy continue to grow and divide. The effect seen on an imaging scan or by a biomarker can be represented by the green line in Panel A. Tumor growth continues after an initial regression as the proportion of drug sensitive tumor cells (represented by the blue line) decreases and tumor growth continues. Panel B: Equations used to derive tumor growth rate model. The constant d represents the rate of cell decay, and the constant g represents the rate of tumor growth. Panel A adapted from Burotto M et al. (2014) Continuing a Cancer Treatment Despite Tumor Growth May Be Valuable: Sunitinib in Renal Cell Carcinoma as Example. PLOS ONE 9(5): e96316. doi:10.1371/journal.pone.0096316.
Comment on
-
Hyperprogressive Disease Is a New Pattern of Progression in Cancer Patients Treated by Anti-PD-1/PD-L1.Clin Cancer Res. 2017 Apr 15;23(8):1920-1928. doi: 10.1158/1078-0432.CCR-16-1741. Epub 2016 Nov 8. Clin Cancer Res. 2017. PMID: 27827313
References
-
- Champiat S, et al. Hyperprogressive disease (HPD) is a new pattern of progression in cancer patients treated by anti-PD-1/PD-L1. Clinical Cancer Research. 2016 - PubMed
-
- Wilkerson J, et al. Estimation of tumour regression and growth rates during treatment in patients with advanced prostate cancer: a retrospective analysis. The Lancet Oncology - PubMed
Publication types
MeSH terms
Grants and funding
LinkOut - more resources
Full Text Sources
Other Literature Sources
Research Materials
