

Meta-analytical methods to identify who benefits most from treatments: daft, deluded, or deft approach?
- PMID: 28258124
- PMCID: PMC5421441
- DOI: 10.1136/bmj.j573
Meta-analytical methods to identify who benefits most from treatments: daft, deluded, or deft approach?
Abstract
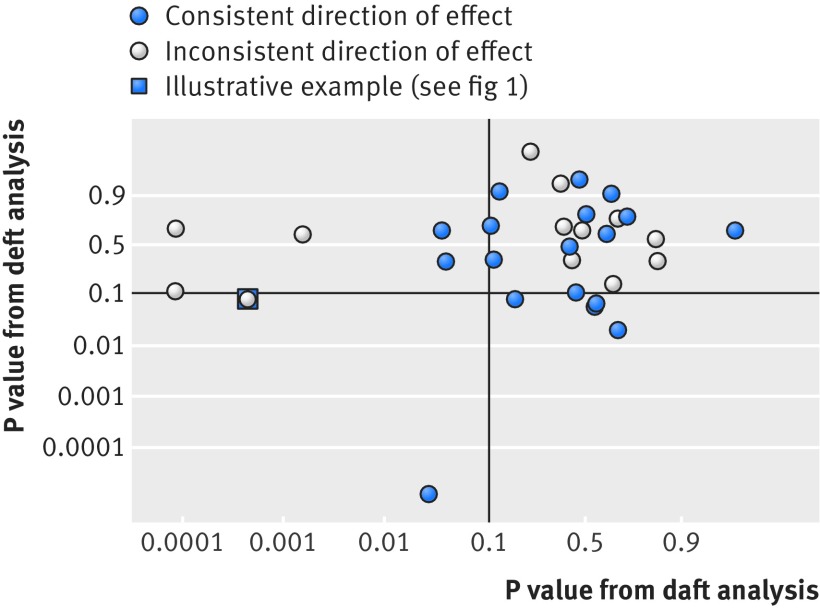
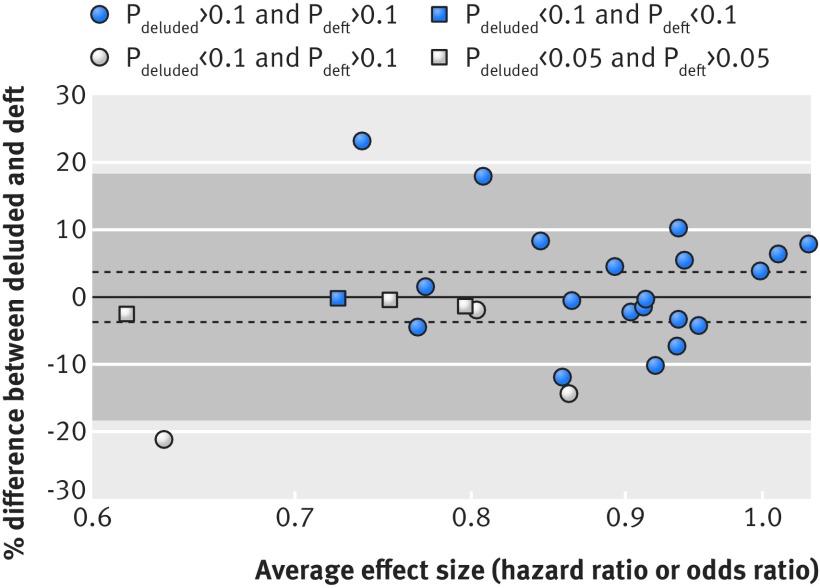
Identifying which individuals benefit most from particular treatments or other interventions underpins so-called personalised or stratified medicine. However, single trials are typically underpowered for exploring whether participant characteristics, such as age or disease severity, determine an individual’s response to treatment. A meta-analysis of multiple trials, particularly one where individual participant data (IPD) are available, provides greater power to investigate interactions between participant characteristics (covariates) and treatment effects. We use a published IPD meta-analysis to illustrate three broad approaches used for testing such interactions. Based on another systematic review of recently published IPD meta-analyses, we also show that all three approaches can be applied to aggregate data as well as IPD. We also summarise which methods of analysing and presenting interactions are in current use, and describe their advantages and disadvantages. We recommend that testing for interactions using within-trials information alone (the deft approach) becomes standard practice, alongside graphical presentation that directly visualises this.
Conflict of interest statement
Competing interests: All authors have completed the ICMJE uniform disclosure form at
Provenance and peer review: Not commissioned; externally peer reviewed.
Figures


Comment in
-
VA-ECMO for infarct-related cardiogenic shock.Lancet. 2024 Jun 8;403(10443):2487. doi: 10.1016/S0140-6736(24)00951-6. Lancet. 2024. PMID: 38851288 No abstract available.
References
-
- Stewart LA, Tierney JF. To IPD or not to IPD? Advantages and disadvantages of systematic reviews using individual patient data. Eval Health Prof 2002;25:76-97. 10.1177/0163278702025001006 pmid:11868447. - DOI - PubMed
-
- Fisher DJ, Copas AJ, Tierney JF, Parmar MK. A critical review of methods for the assessment of patient-level interactions in individual participant data meta-analysis of randomized trials, and guidance for practitioners. J Clin Epidemiol 2011;64:949-67. 10.1016/j.jclinepi.2010.11.016 pmid:21411280. - DOI - PubMed
-
- Riley RD, Lambert PC, Staessen JA, et al. Meta-analysis of continuous outcomes combining individual patient data and aggregate data. Stat Med 2008;27:1870-93. 10.1002/sim.3165 pmid:18069721. - DOI - PubMed
-
- Berlin JA, Santanna J, Schmid CH, Szczech LA, Feldman HI. Anti-Lymphocyte Antibody Induction Therapy Study Group. Individual patient- versus group-level data meta-regressions for the investigation of treatment effect modifiers: ecological bias rears its ugly head. Stat Med 2002;21:371-87. 10.1002/sim.1023 pmid:11813224. - DOI - PubMed
-
- Fearon P, Langhorne P. Early Supported Discharge Trialists. Services for reducing duration of hospital care for acute stroke patients. Cochrane Database Syst Rev 2012;9:CD000443.pmid:22972045. - PubMed
MeSH terms
Grants and funding
LinkOut - more resources
Full Text Sources
Other Literature Sources