. 2017 Apr 17;83(9):e03356-16.
doi: 10.1128/AEM.03356-16. Print 2017 May 1.

Unusual Versatility of the Filamentous, Diazotrophic Cyanobacterium Anabaena torulosa Revealed for Its Survival during Prolonged Uranium Exposure

Affiliations

Unusual Versatility of the Filamentous, Diazotrophic Cyanobacterium Anabaena torulosa Revealed for Its Survival during Prolonged Uranium Exposure

Celin Acharya et al. Appl Environ Microbiol. .

Abstract

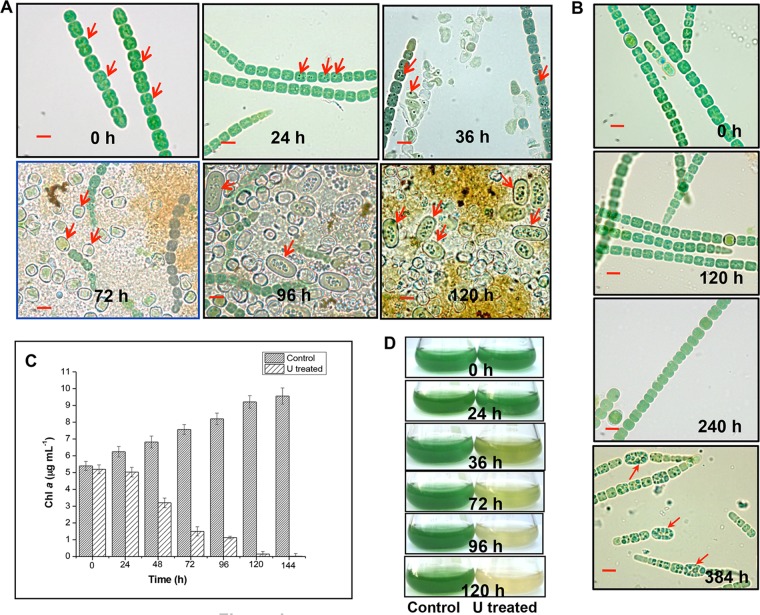
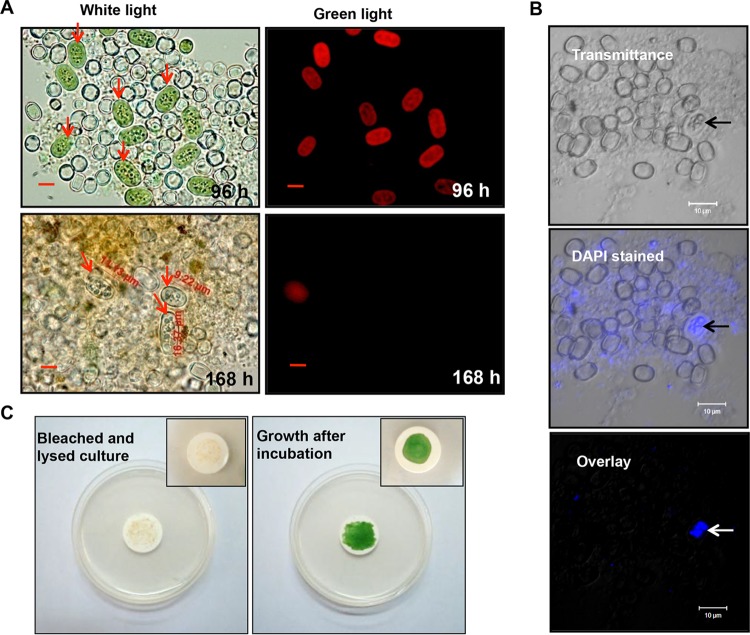
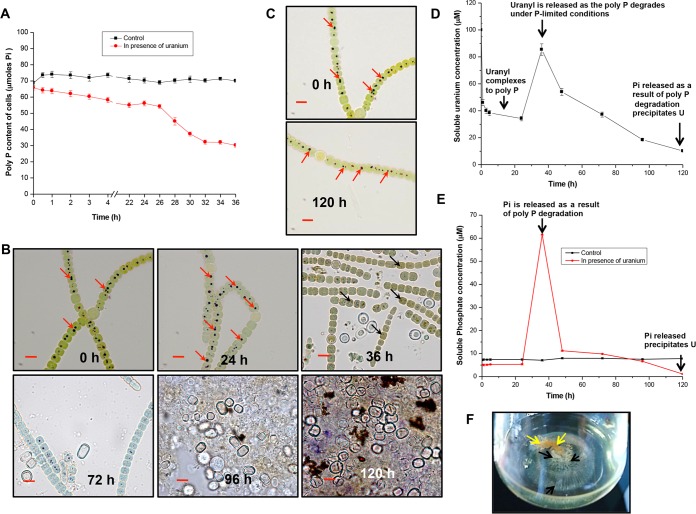
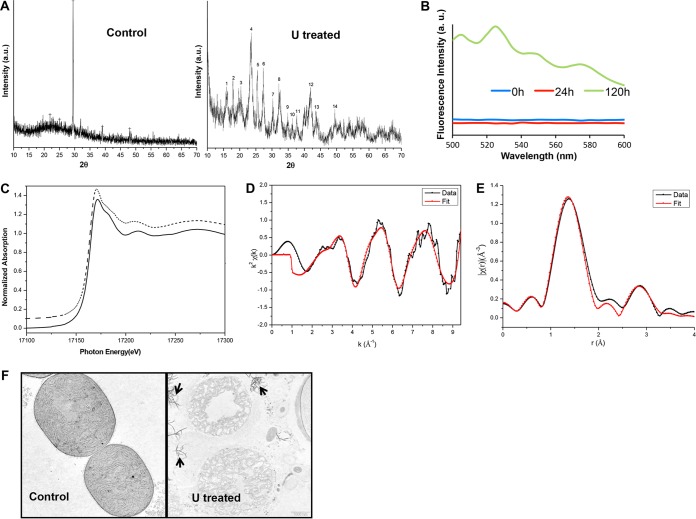
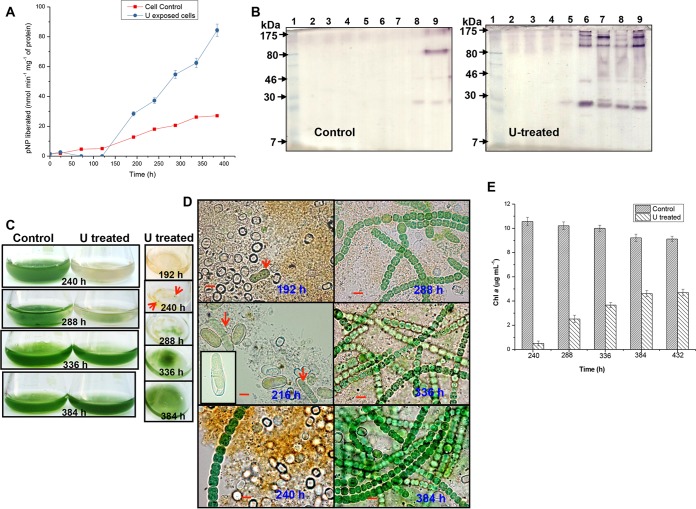
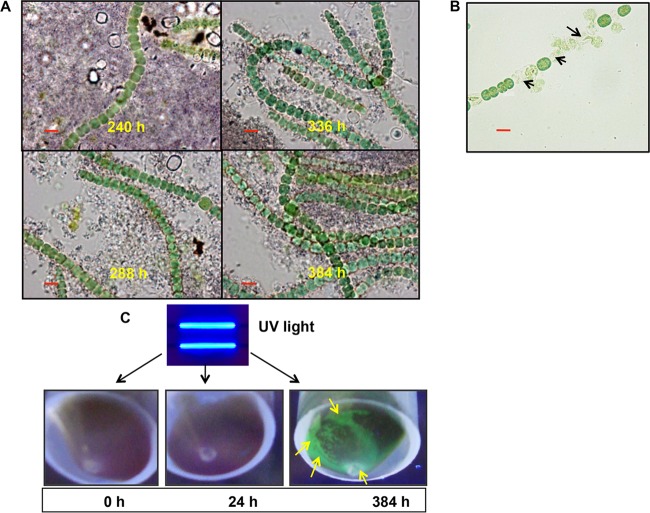
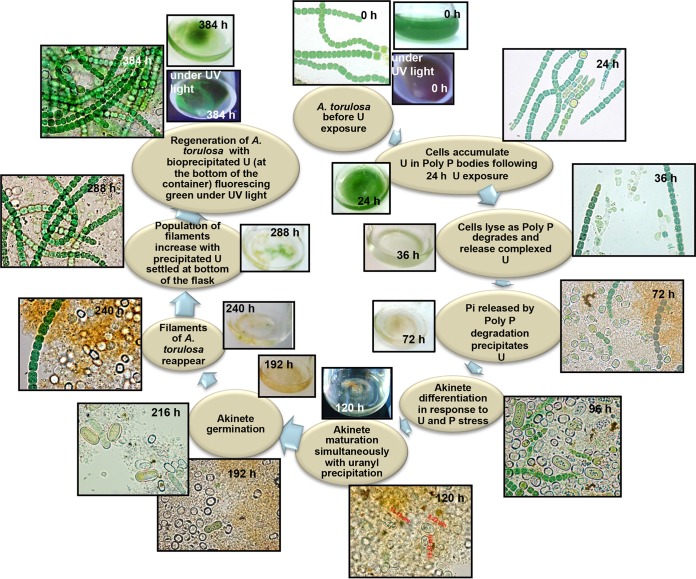
Reports on interactions between cyanobacteria and uranyl carbonate are rare. Here, we present an interesting succession of the metabolic responses employed by a marine, filamentous, diazotrophic cyanobacterium, Anabaena torulosa for its survival following prolonged exposure to uranyl carbonate extending up to 384 h at pH 7.8 under phosphate-limited conditions. The cells sequestered uranium (U) within polyphosphates on initial exposure to 100 μM uranyl carbonate for 24 to 28 h. Further incubation until 120 h resulted in (i) significant degradation of cellular polyphosphates causing extensive chlorosis and cell lysis, (ii) akinete differentiation followed by (iii) extracellular uranyl precipitation. X-ray diffraction (XRD) analysis, fluorescence spectroscopy, X-ray absorption near edge structure (XANES), and extended X-ray absorption fine structure (EXAFS) spectroscopy established the identity of the bioprecipitated uranium as a U(VI) autunite-type mineral, which settled at the bottom of the vessel. Surprisingly, A. torulosa cells resurfaced as small green flakes typical of actively growing colonies on top of the test solutions within 192 to 240 h of U exposure. A consolidated investigation using kinetics, microscopy, and physiological and biochemical analyses suggested a role of inducible alkaline phosphatase activity of cell aggregates/akinetes in facilitating the germination of akinetes leading to substantial regeneration of A. torulosa by 384 h of uranyl incubation. The biomineralized uranium appeared to be stable following cell regeneration. Altogether, our results reveal novel insights into the survival mechanism adopted by A. torulosa to resist sustained uranium toxicity under phosphate-limited oxic conditions.IMPORTANCE Long-term effects of uranyl exposure in cyanobacteria under oxic phosphate-limited conditions have been inadequately explored. We conducted a comprehensive examination of the metabolic responses displayed by a marine cyanobacterium, Anabaena torulosa, to cope with prolonged exposure to uranyl carbonate at pH 7.8 under phosphate limitation. Our results highlight distinct adaptive mechanisms harbored by this cyanobacterium that enabled its natural regeneration following extensive cell lysis and uranium biomineralization under sustained uranium exposure. Such complex interactions between environmental microbes such as Anabaena torulosa and uranium over a broader time range advance our understanding on the impact of microbial processes on uranium biogeochemistry.

Keywords: biomineralization; cyanobacteria; phosphatase; polyphosphates; regeneration; uranium.


Figures

FIG 1
FIG 1
Cell lysis, chlorosis, and akinete differentiation in U-exposed A. torulosa culture. Mid-log-phase cells at the equivalent of 0.2 mg (dry weight) ml−1 were exposed to 100 μM U (A) or unexposed to U (B) at pH 7.8 and were observed under a microscope under bright-field illumination (magnification, ×1,500; bars indicate 5 μm) at regular intervals. The data are a representative of three biological replicates. The red arrows in (A) show vegetative cells at 0 h, the dense dark granules formed as a result of colocalization of uranium with polyphosphate bodies at 24 h and 36 h in vegetative cells, heterocysts at 72 h, and akinetes at 96 h and 120 h. Red arrows in (B) indicate the differentiating akinetes at 384 h of incubation under control, uranium-unexposed phosphate-limited conditions. (C) Growth of U-unexposed control cells or cells exposed to 100 μM uranyl carbonate is represented by chlorophyll a (Chl a) contents. (D) The flasks containing control or U-challenged A. torulosa cultures corresponding to those mentioned in panel C.
FIG 2
FIG 2
Characteristics of akinetes in U-exposed A. torulosa culture. (A) A. torulosa cultures showing aggregates of akinetes (red arrows) (and isolated heterocysts) following 96 and 168 h of uranyl (100 μM) exposure were recorded with bright-field microscopy (magnification, ×1,500; bars indicate 5 μm) with their respective chlorophyll a fluorescence (see the text for details). Akinetes as large as 16.37 μm can be seen in 168-h U-exposed culture. (B) A 96-h, uranyl-exposed akinete-bearing A. torulosa culture was stained with DAPI and observed using a laser scanning confocal microscope. The transmitted light image, wavelength color-coded image, and a superposition of both images are presented. Strong blue fluorescence signal (in overlay) indicates the concentration of nucleic acids (indicated with arrows) in the central part of the akinete. The photomicrographs in panels A and B are representative of three biological replicates. (C) The bleached and lysed 120-h U-challenged A. torulosa culture was spotted onto filter discs (0.45 μm, MF-Millipore membrane filter; Merck Millipore, Germany), inoculated onto BG-11 agar plates, and incubated under continuous illumination for 168 h. The bleached and lysed culture resumed its normal growth following incubation. The insets show a closer view of the filter discs spotted with A. torulosa culture before and after incubation.
FIG 3
FIG 3
Polyphosphate degradation and uranium bioprecipitation in A. torulosa. (A) Mid-log-phase cells at the equivalent of 0.2 mg (dry weight) ml−1 were incubated under control conditions or challenged with 100 μM uranyl carbonate wherein the polyP contents of the cells were measured (expressed in μmol Pi per 0.5 optical density at 750 nm [OD750] per liter) until 36 h. (B) Uranyl-challenged cells (extending from 0 h to 120 h) were stained with toluidine blue and were observed with bright-field microscopy using a Carl Zeiss Axioskop 40 microscope with oil-immersion objectives (magnification, ×1,500; bars indicate 5 μm). These correspond to the cells shown in Fig. 1A. Note that the polyphosphates showing a characteristic red color (at 0 h and 24 h, marked by red arrows) degrade by 36 h and appear as dark spots (marked by black arrows). Images corresponding to cells exposed to U for 120 h show lysis following polyP degradation in contrast to control U-unexposed cells (C) stained with toluidine blue showing no such polyphosphate (marked by red arrows) degradation. (D and E) Soluble uranium (in U-exposed culture) (D) and soluble phosphate (E) concentrations in control and U-exposed cultures during 120 h of incubation. (F) Flask displaying the uranium precipitates formed by A. torulosa cells following 120 h of U exposure. The layer of yellowish uranyl precipitates that settled at the bottom of the flask is indicated by black arrows underneath the brownish cell aggregates comprising bleached and degraded A. torulosa cells (yellow arrows).
FIG 4
FIG 4
Characterization of bioprecipitated uranium. (A) XRD spectra of A. torulosa cells before and after 120 h of exposure to 100 μM uranyl carbonate. (B) Time-resolved fluorescence spectra of A. torulosa cells following 0 h, 24 h, and 120 h of uranium confrontation. The peaks at 505, 526, 550, and 575 nm, characteristic of chernikovite/meta-autunite, were observed for 120-h uranyl-exposed cells. (C) Normalized uranium LIII edge XANES spectra of 10−3 M U(VI) in 1 M HClO4 (dotted line) and 120-h uranyl-exposed cells (solid line). (D and E) Uranium LIII edge k2-weighted EXAFS spectrum (D) and corresponding FT (E) of uranium complexes formed by 120-h U-exposed A. torulosa cells. (F) Transmission electron micrographs of thin sections of A. torulosa cells before and after 120 h U exposure. The uranyl phosphate precipitates (indicated with arrows) were found to be scattered around the degraded cell aggregates. Uranyl composition of the precipitates was previously confirmed by energy dispersive X-ray fluorescence (EDXRF) spectroscopy, which revealed all components of uranium L (UL) X rays, i.e., ULl, ULα, ULβ1, and ULβ2.
FIG 5
FIG 5
Regeneration of A. torulosa following prolonged uranyl exposure. (A) Alkaline phosphatase (APase) activity and the corresponding zymogram (B) of control U-untreated cells or cells treated with 100 μM U at various time points during incubation for up to 384 h. The lanes in the zymogram (B) contained cell extracts from control U-untreated cells and U-treated cells at 0 h (lane 2), 24 h (lane 3), 72 h (lane 4), 120 h (lane 5), 192 h (lane 6), 240 h (lane 7), 288 h (lane 8), and 384 h (lane 9). Protein extracts (corresponding to 50 μg and 28 μg for control and U-treated cells, respectively, except for 19 μg in 288-h U-treated cells) were electrophoretically resolved by nonreducing SDS-PAGE along with prestained molecular mass standards (lane 1) and stained for in-gel phosphatase activity. (C) The flasks containing control U-unchallenged or U-challenged cultures demonstrating the regeneration following 384 h of uranium exposure. Also seen here is a top view of the flasks containing U-exposed cultures at definite intervals. Tiny green patches (marked by red arrows) heralding the regeneration were seen on the top of the experimental solution by 240 h of U exposure. (D) Bright-field microscopy (magnification, ×1,500; bars indicate 5 μm) of regenerating cultures corresponding to those shown in panel C. The germination of the akinetes is visualized by the elongation and division of the spore-like cells (192 h, indicated by red arrow) followed by the emergence of the germling (216 h, indicated by red arrows) comprising 2 to 3 vegetative cells (the inset in the image presents a closer view of the emerging germling). Images corresponding to 240 to 384 h of U exposure represent the progression of the regeneration of the cells. (E) Growth of control and regenerated A. torulosa cultures following uranium exposure is represented by chlorophyll a contents.
FIG 6
FIG 6
Features of regenerated A. torulosa cells and stability of the biomineralized uranyl following cell regeneration. (A) Regenerated cells stained with toluidine blue were observed using bright-field microscopy in a Carl Zeiss Axioskop 40 microscope (Carl Zeiss, Germany) (magnification, ×1,500; bars indicate 5 μm) following 240 to 384 h of uranium exposure. No polyphosphates were visualized in these regenerating cells. (B) Regenerated cells exposed to 100 μM U for 5 min under shaking conditions were observed using bright-field microscopy (bar indicates 5 μm). The regenerated cells showed lysis (marked by black arrows) suggestive of their sensitivity to U toxicity. (C) Cells of A. torulosa were incubated with 100 μM U for 0 h, 24 h, or 384 h and the respective cell pellets were exposed to UV light and photographed. The uranyl precipitates at the bottom of the regenerated biomass at 384 h displayed a distinct green fluorescence (marked by yellow arrows) consistent with autunite mineral.
FIG 7
FIG 7
Summary of the events exhibited by A. torulosa following exposure to 100 μM uranyl carbonate at pH 7.8 for 384 h, extending from cell lysis to regeneration.

Similar articles

Cited by

References

    1. Cavalier-Smith T. 2006. Cell evolution and Earth history: stasis and revolution. Philos Trans R Soc Lond B Biol Sci 361:969–1006. doi:10.1098/rstb.2006.1842. - DOI - PMC - PubMed
    1. Wackett LP, Dodge AG, Ellis LB. 2004. Microbial genomics and the periodic table. Appl Environ Microbiol 70:647–655. doi:10.1128/AEM.70.2.647-655.2004. - DOI - PMC - PubMed
    1. Denef VJ, Mueller RS, Banfield JF. 2010. AMD biofilms: using model communities to study microbial evolution and ecological complexity in nature. ISME J 4:599–610. doi:10.1038/ismej.2009.158. - DOI - PubMed
    1. Hemme CL, Deng Y, Gentry TJ, Fields MW, Wu L, Barua S, Barry K, Tringe SG, Watson DB, He Z, Hazen TC. 2010. Metagenomic insights into evolution of a heavy metal-contaminated groundwater microbial community. ISME J 4:660–672. doi:10.1038/ismej.2009.154. - DOI - PubMed
    1. Neu MR, Boukhalfa H, Merroun ML. 2010. Biomineralization and biotransformations of actinide materials. MRS Bull 35:849–857. doi:10.1557/mrs2010.711. - DOI

MeSH terms

Substances

LinkOut - more resources