. 2017 Apr 17;83(9):e00113-17.
doi: 10.1128/AEM.00113-17. Print 2017 May 1.

Pseudomonas aeruginosa Aggregate Formation in an Alginate Bead Model System Exhibits In Vivo-Like Characteristics

Affiliations

Pseudomonas aeruginosa Aggregate Formation in an Alginate Bead Model System Exhibits In Vivo-Like Characteristics

Majken Sønderholm et al. Appl Environ Microbiol. .

Abstract

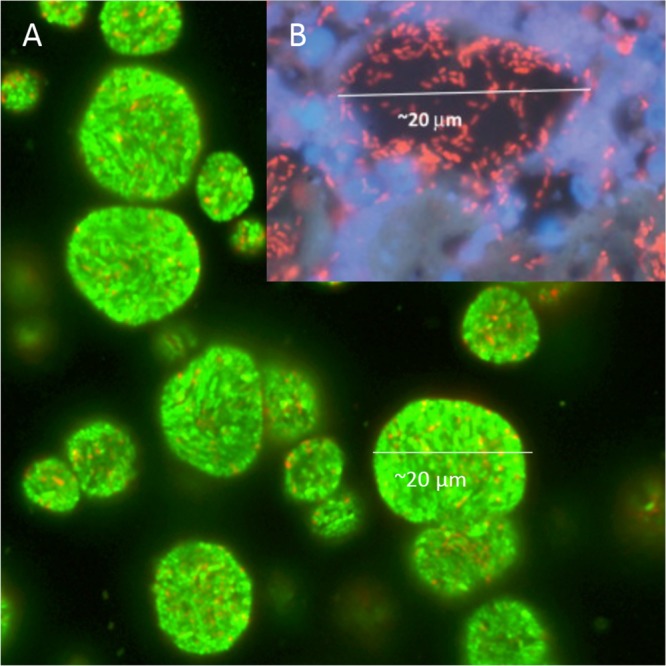
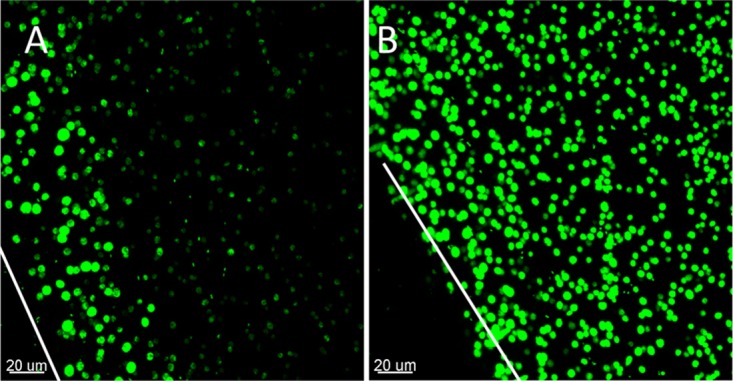
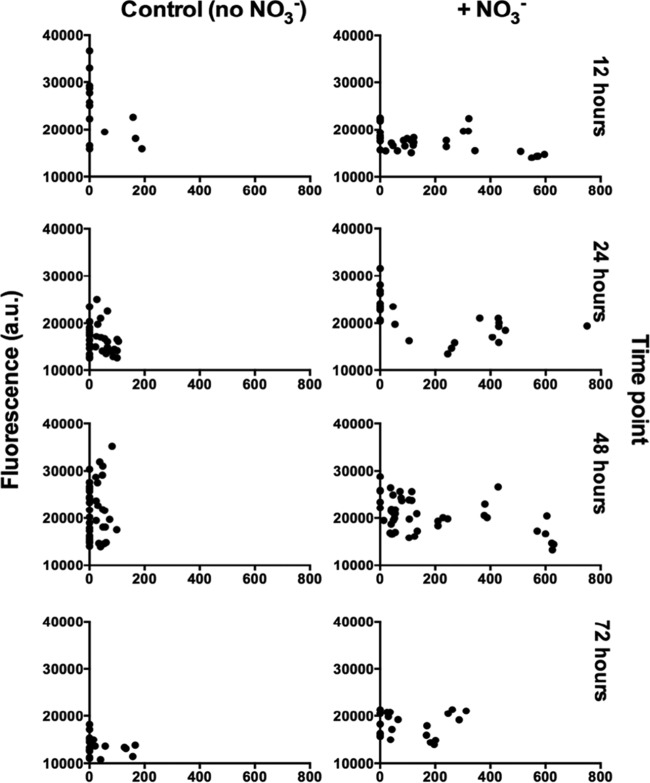
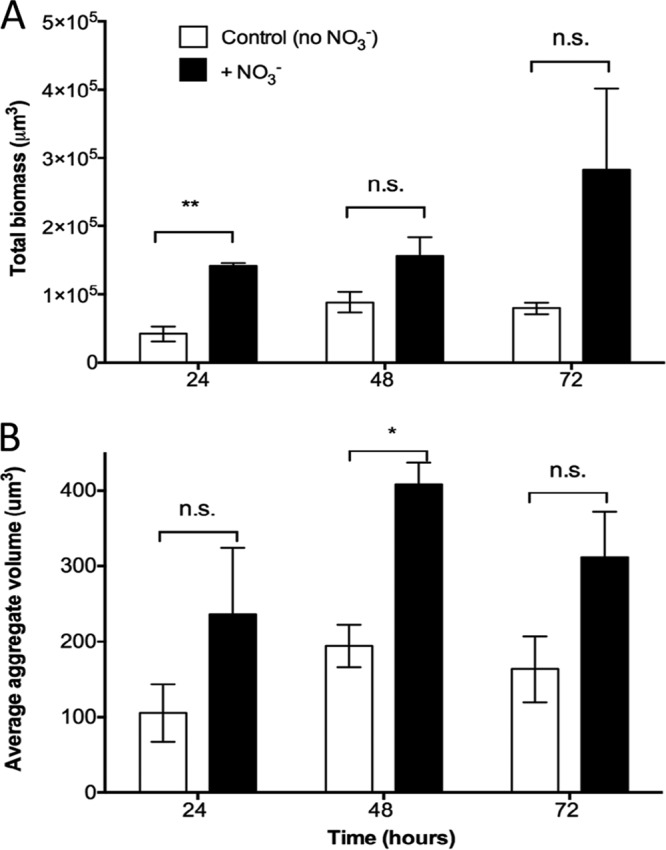
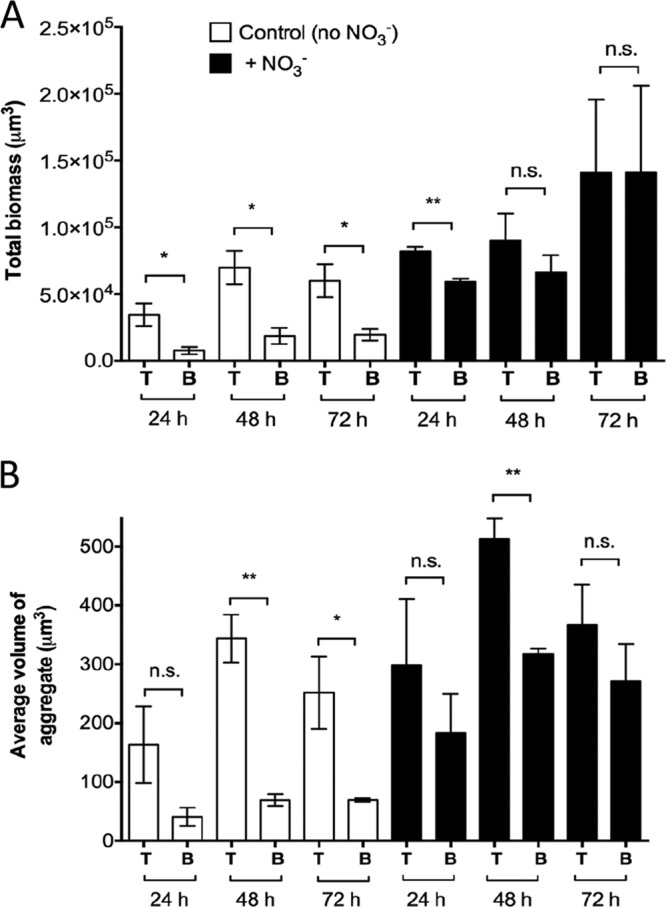
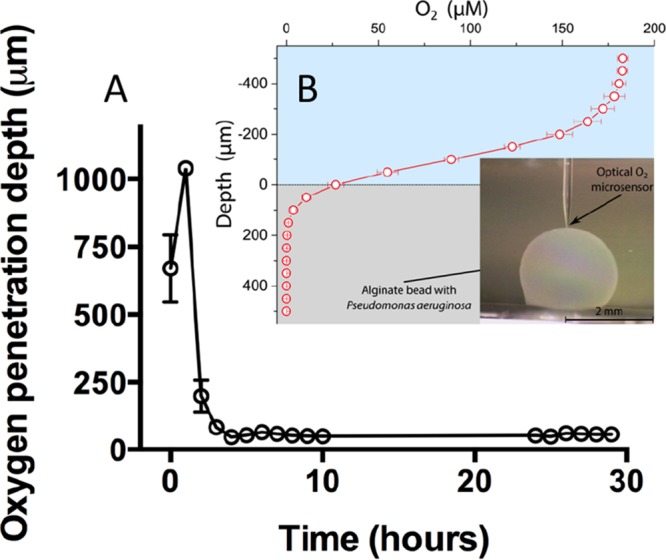
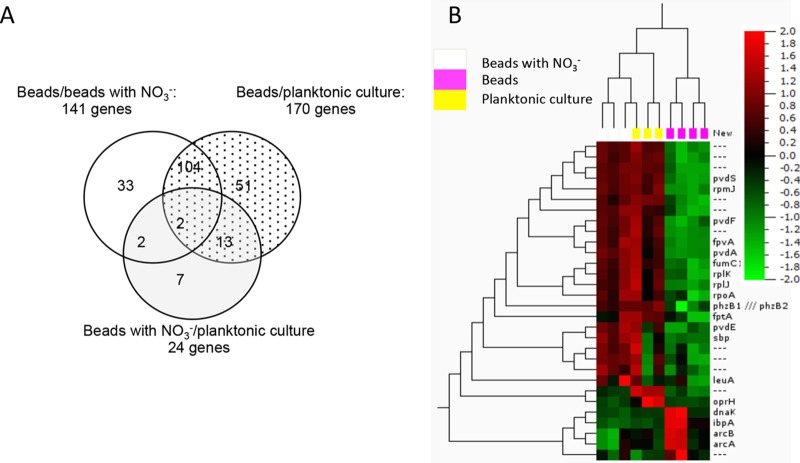
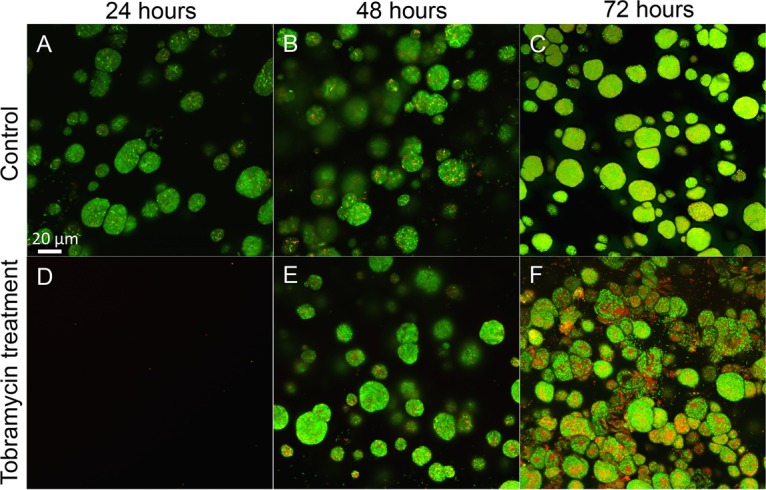
Alginate beads represent a simple and highly reproducible in vitro model system for diffusion-limited bacterial growth. In this study, alginate beads were inoculated with Pseudomonas aeruginosa and followed for up to 72 h. Confocal microscopy revealed that P. aeruginosa formed dense clusters similar in size to in vivo aggregates observed ex vivo in cystic fibrosis lungs and chronic wounds. Bacterial aggregates primarily grew in the bead periphery and decreased in size and abundance toward the center of the bead. Microsensor measurements showed that the O2 concentration decreased rapidly and reached anoxia ∼100 μm below the alginate bead surface. This gradient was relieved in beads supplemented with NO3- as an alternative electron acceptor allowing for deeper growth into the beads. A comparison of gene expression profiles between planktonic and alginate-encapsulated P. aeruginosa confirmed that the bacteria experienced hypoxic and anoxic growth conditions. Furthermore, alginate-encapsulated P. aeruginosa exhibited a lower respiration rate than the planktonic counterpart and showed a high tolerance toward antibiotics. The inoculation and growth of P. aeruginosa in alginate beads represent a simple and flexible in vivo-like biofilm model system, wherein bacterial growth exhibits central features of in vivo biofilms. This was observed by the formation of small cell aggregates in a secondary matrix with O2-limited growth, which was alleviated by the addition of NO3- as an alternative electron acceptor, and by reduced respiration rates, as well as an enhanced tolerance to antibiotic treatment.IMPORTANCEPseudomonas aeruginosa has been studied intensively for decades due to its involvement in chronic infections, such as cystic fibrosis and chronic wounds, where it forms biofilms. Much research has been dedicated to biofilm formation on surfaces; however, in chronic infections, most biofilms form small aggregates of cells not attached to a surface, but embedded in host material. In this study, bacteria were encapsulated in small alginate beads and formed aggregates similar to what is observed in chronic bacterial infections. Our findings show that aggregates are exposed to steep oxygen gradients, with zones of oxygen depletion, and that nitrate may serve as an alternative to oxygen, enabling growth in oxygen-depleted zones. This is important, as slow growth under low-oxygen conditions may render the bacteria tolerant toward antibiotics. This model provides an alternative to surface biofilm models and adds to the comprehension that biofilms do not depend on a surface for formation.

Keywords: Pseudomonas aeruginosa; antibiotics; biofilm; chronic infection; growth; model system; respiration; spatial structure.


Figures

FIG 1
FIG 1
In vitro and in vivo aggregates of P. aerugionsa. (A) Confocal laser scanning microscopy (CLSM) image of alginate-encapsulated green fluorescent protein (GFP)-tagged P. aeruginosa PAO1 (green) grown in vitro for 24 h. (B) CLSM image of in vivo aggregate of P. aeruginosa (red) from chronic infected cystic fibrosis (CF) lung visualized with a peptide nucleic acid (PNA) fluorescence in situ hybridization (FISH) probe. The polymorphonuclear leukocytes surrounding the aggregate are stained with DAPI (4′,6-diamidino-2-phenylindole; blue). Reprinted from Bjarnsholt et al. (1) with permission.
FIG 2
FIG 2
Alginate-encapsulated GFP-tagged P. aeruginosa PAO1 after 24 h of growth. CLSM images are of controls without (A) and those with (B) NO3. The white lines correspond to the edge of the alginate beads (z lines), which are cut in half and imaged from the cut surface.
FIG 3
FIG 3
Growth rates expressed as relative fluorescence in arbitrary units (a.u.) as a function of depth within the alginate beads, grown with and without NO3 and at different growth stages. P. aeruginosa was fluorescently labeled with a Texas Red-conjugated PNA-FISH probe and imaged by CLSM, and the fluorescence intensities were quantified in ImageJ.
FIG 4
FIG 4
(A) Growth of alginate-encapsulated GFP-tagged P. aeruginosa as determined by quantification of total biomass in control beads (no NO3) and NO3-supplemented beads over time. Total biomass was quantified as the number of green fluorescent voxels. (B) Average P. aeruginosa aggregate volumes in alginate beads over time. Bars represent averages ± standard errors of the means from three replicates. In each group, >1,000 aggregates were analyzed. n.s., not significant; *, P < 0.05; **, P < 0.001.
FIG 5
FIG 5
Spatial structure of alginate-encapsulated GFP-tagged P. aeruginosa PAO1. (A) Total biomass in the top (T) part, near the surface of the bead, and bottom (B) part of the image representing deeper parts of the beads. (B) Average aggregate volumes in the top (T) and bottom (B) parts of the images. The images were split in half at approximately 106 μm from the surface of the bead across the x axis. Bars represent averages ± standard errors of the means from three replicates. n.s., not significant, *, P < 0.05; **, P < 0.001.
FIG 6
FIG 6
Respiration rate of P. aeruginosa PAO1. (A) Linear decrease in O2 concentration over time exemplified by the respiration rate of alginate-encapsulated P. aeruginosa after 4 h 50 min growth (r2 = 0.998; P < 0.0001). (B) Volumetric respiration rates, R, for alginate-encapsulated and planktonic P. aeruginosa calculated from the change in O2 concentrations at different time points during the experiment. Bars represent averages ± standard errors of the means from three or four replicates. ***, P < 0.0001.
FIG 7
FIG 7
Oxygen penetration depth in alginate beads with P. aeruginosa. (A) Calculated O2 penetration depth (μm) during the time course of the experiment. Bars represent averages ± standard errors of the means from four replicates. Calculations were performed on the background of respiration rate measurements. (B) O2 microsensor profiles of P. aeruginosa grown in alginate beads for 24 h. The depicted profile is an average from six profiles obtained on three independent beads. Bars represent averages ± standard deviations. The inset shows the optical O2 microsensor touching the surface of the bead. All measurements were performed at 37°C.
FIG 8
FIG 8
Differentially regulated genes, including those >3-fold up- and downregulated, in comparisons among the three in vitro conditions investigated with microarray. (A) Venn diagram comparing the genetic expressions of alginate-encapsulated P. aeruginosa (beads) with those of a planktonic reference culture of P. aeruginosa (dotted), where 170 genes showed >3-fold differential expression. When comparing alginate-encapsulated P. aeruginosa with and without NO3 (white), 141 genes were >3-fold differentially expressed, and 104 of the genes were identical with those differentially regulated when comparing beads to planktonic culture. When comparing alginate-encapsulated P. aeruginosa with NO3 with a planktonic reference culture (gray), just 24 genes showed differential expression of >3-fold. The differential expression of 2 genes (PA0456 and PA1869) was shared between all three subsets of comparisons (see Table S2, highlighted in gray). (B) Heat map of microarray data from alginate-encapsulated P. aeruginosa with and without NO3 and a planktonic culture. The relative gene expressions are depicted according to the color scale shown in the top right corner.
FIG 9
FIG 9
Antibiotic tolerance of alginate-encapsulated P. aeruginosa PAO1. (A to C) CLSM images of nontreated control beads with P. aeruginosa grown for 24, 48, and 72 h. (D to F) CLSM images of alginate-encapsulated P. aeruginosa treated with 100 μg/ml tobramycin for 24 h. (D) P. aeruginosa exposed to tobramycin just after encapsulation (when still in single-cell planktonic state). P. aeruginosa was allowed to form aggregates for 24 h (E) or 48 h (F) before the exposure to tobramycin. Tobramycin exposure lasted for 24 h. Notice how the majority of the bacteria are green (alive) in spite of 24-h antibiotic treatment. Viability staining was with Syto9 and PI. Green bacteria are alive and red/yellow bacteria are dead. Bar, 20 μm.

Similar articles

Cited by

References

    1. Bjarnsholt T, Alhede M, Alhede M, Eickhardt-Sørensen SR, Moser C, Kühl M, Jensen PØ, Høiby N. 2013. The in vivo biofilm. Trends Microbiol 21:466–474. doi:10.1016/j.tim.2013.06.002. - DOI - PubMed
    1. Roberts AE, Kragh KN, Bjarnsholt T, Diggle SP. 2015. The limitations of in vitro experimentation in understanding biofilms and chronic infection. J Mol Biol 427:3646–3661. doi:10.1016/j.jmb.2015.09.002. - DOI - PubMed
    1. Siddiqui AR, Bernstein JM. 2010. Chronic wound infection: facts and controversies. Clin Dermatol 28:519–526. doi:10.1016/j.clindermatol.2010.03.009. - DOI - PubMed
    1. Hoiby N. 1977. Pseudomonas aeruginosa infection in cystic fibrosis. Diagnostic and prognostic significance of pseudomonas aeruginosa precipitins determined by means of crossed immunoelectrophoresis. A survey. Acta Pathol Microbiol Scand Suppl 262:1–96. - PubMed
    1. Parsek MR, Singh PK. 2003. Bacterial biofilms: an emerging link to disease pathogenesis. Annu Rev Microbiol 57:677–701. doi:10.1146/annurev.micro.57.030502.090720. - DOI - PubMed