. 2017 Jun;16(6):1080-1091.
doi: 10.1158/1535-7163.MCT-16-0626. Epub 2017 Mar 3.

G-1 Inhibits Breast Cancer Cell Growth via Targeting Colchicine-Binding Site of Tubulin to Interfere with Microtubule Assembly

Affiliations

G-1 Inhibits Breast Cancer Cell Growth via Targeting Colchicine-Binding Site of Tubulin to Interfere with Microtubule Assembly

Xiangmin Lv et al. Mol Cancer Ther. 2017 Jun.

Abstract

G-protein-coupled estrogen receptor 1 (GPER1) has been reported to play a significant role in mediating the rapid estrogen actions in a wide range of normal and cancer cells. G-1 was initially developed as a selective agonist for GPER. However, the molecular mechanisms underlying the actions of G-1 are unknown, and recent studies report inconsistent effects of G-1 on the growth of breast cancer cells. By employing high-resolution laser scanning confocal microscopy and time-lapse imaging technology, as well as biochemical analyses, in the current study, we provide convincing in vitro and in vivo evidence that G-1 is able to suppress the growth of breast cancer cells independent of the expression status of GPERs and classic estrogen receptors. Interestingly, we found that triple-negative breast cancer cells (TNBC) are very sensitive to G-1 treatment. We found that G-1 arrested the cell cycle in the prophase of mitosis, leading to caspase activation and apoptosis of breast cancer cells. Our mechanistic studies indicated that G-1, similar to colchicine and 2-methoxyestradiol, binds to colchicine binding site on tubulin, inhibiting tubulin polymerization and subsequent assembly of normal mitotic spindle apparatus during breast cancer cell mitosis. Therefore, G-1 is a novel microtubule-targeting agent and could be a promising anti-microtubule drug for breast cancer treatment, especially for TNBC treatment. Mol Cancer Ther; 16(6); 1080-91. ©2017 AACR.


Conflict of interest statement

Conflict of Interest: The authors have no competing interests to declare.

Figures

Figure 1
Figure 1. G-1 inhibits the proliferation of breast cancer cells independent of the expression status of GPER and classic estrogen receptors
A) G-1 inhibits the proliferation of breast cancer cells in a concentration-dependent manner. Cells were treated with increasing concentrations of G-1 for 48 h. Cell numbers were counted using an automatic cell counter and presented as percentages of that of control group (0.1% DMSO treated). Each bar represents mean ± SEM of four repeats. Bars with different letters are significantly different from each other (P < 0.05). B) G-1 inhibits the proliferation of breast cancer cells in a time-dependent manner. Cells were treated with 2 μM G-1 for different time. Cell numbers were presented as percentages of that of control group (0 h group). Each bar represents mean ± SEM of four repeats. Bars with different letters are significant different from each other (P < 0.05). C) Representative Images showing colony formation of breast cancer cells in the presence of different concentrations of G-1 for 7 days. Quantitative data show the colony numbers. Colonies were stained with MTT. Scale bar: 200 μm. CTRL: 0.1% DMSO treatment. ***: P < 0.001 compared to control. D) Representative images showing the nude mice bearing breast cancer xenograft treated with or without G-1 for 2 weeks (left panel), and the harvested tumors (right panel). Red circles indicate xenograft location and size. CTRL: sesame oil control treatment every other day for 2 weeks; G-1: 5 mg/kg G-1 treatment every other day for 2 weeks. E) Tumor xenograft growth curves in athymic nude mice treated with or without G-1. The xenograft volume was measured weekly. Student’s T test was used to compare the tumor volumes between control and G-1 treated groups. Each point represents mean ± SEM (n = 6). *: P < 0.05. F) The weight of tumor xenografts from nude mice treated with or without G-1 for 2 weeks. Each bar represents mean ± SEM (n = 6). **: P < 0.01 compared to control. G) Representative images showing expression of Ki67 in control and G-1 treated tumor xenografts determined by fluorescent immunohistochemistry. Ki67 was labeled in green; Actin was stained with rhodamine-phalloidin (red); Nuclei were stained with DAPI (blue). Scale bar: 20 μm. The number of Ki67 positive cells and total cells in control and G-1 treated groups were also counted under a fluorescent microscope and the ratio of Ki67 positive cells was calculated. Each bar represents mean ± SEM (n = 6), ***: P < 0.001. H) The body weight of athymic nude mice with or without G-1 treatment. Each bar represents mean ± SEM (n = 6). Student’s T test was used to do statistical analysis. No statistical significance on the body weight was observed between control and G-1 treated groups.
Figure 2
Figure 2. G-1 arrests cell cycle progression of breast cancer cells in the prophase of mitosis
A) Representative images showing morphology of MDA-MB-231 cells incubated for 8 h in the absence (CTRL) or presence of G-1 (2 μM) for 8 h. Microtubules were stained with β-tubulin antibody (red) and the nuclei were stained with DAPI (blue). Phosphorylated histone H3 (S10) was used as cell cycle progression marker (green). Cells in different stages of cell cycle were indicated by white arrows. Scale bar: 20 μm. B) Representative high-resolution confocal microscopy images showing detailed morphology of microtubules of MDA-MB-231 breast cancer cells incubated in the absence (top panel) or presence (lower panel) of G-1 (2 μM) for 8 h. Scale bar: 20 μm. Microtubules were stained with β-tubulin antibody (red) and the nuclei were stained with DAPI (blue). Phosphorylated histone H3 (S10) was used as cell cycle progression marker (green). I: interphase; P: prophase; M: metaphase; A: anaphase; T&C: telophase and cytokinesis. C) A representative high-resolution image showing the microtubule asters formed in MDA-MB-231 cells after G-1 treatment for 8 h. Microtubules were stained with β-tubulin antibody (red) and the nuclei were stained with DAPI (blue). Phosphorylated histone H3 (S10) was used as cell cycle progression marker (green). White arrowheads point to spindle-like microtubule asters. Scale bar: 20 μm.
Figure 3
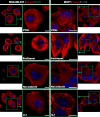
Figure 3. G-1 disrupts microtubule assembly in vivo
Representative high-resolution images showing microtubule structures (red) of MDA-MB-231 and MCF7 cells incubated in the presence or absence of vehicle (0.1% DMSO), paclitaxel (10 μM), nocodazole (10 μM), or G-1 (10 μM) for 2 h. Representative high-resolution image (focusing on a single cell) in each groups was presented in the middle panels to show the detail of the microtubule structure. The low magnification image with multiple cells in each group was also presented (on the according side). Scale bar = 10 μm. Paclitaxel stabilizes microtubule, while G-1, similar to nocodazole, disrupts microtubule formation.
Figure 4
Figure 4. G-1 disrupts microtubule assembly in vitro
A) High-resolution laser scanning confocal images showing effect of G-1 on microtubule assembly in vitro. Paclitaxel was used as a positive control. Addition of DMSO (≤ 0.05%, CTRL) had no effect on microtubule assembly, which is indicated by appearance of many microtubules formed by polymerization of X-rhodamine-labelled tubulin in the in vitro reaction system. Addition of paclitaxel greatly increased microtubule assembly, whereas addition of G-1 to the reaction drastically disrupted microtubule assembly. B) Effects of G-1 on microtubule assembly evaluated through a microtubule sedimentation assay. The left panel showed the representative gels loaded with pellet or supernatant after incubation with paclitaxel, control (0.05% DMSO) or G-1. The graphs show quantitative results. Each bar represents mean ± SEM (n = 3). *: P < 0.05; **: P < 0.01; ***: P < 0.001 compared to control. Taxol: with 20μM paclitaxel; CTRL: with DMSO vehicle treatment; G-1: with G-1 treatment.
Figure 5
Figure 5. Screenshots of cell division videos support the notion that G-1 targets microtubules to suppress cell growth
Hela cells with GFP labelled α-tubulin were incubated in the culture chamber. Cell division and microtubule dynamics were monitored with a high-resolution laser scanning microscope and a live cell imaging system. A) Screenshots from the time-lapse video showing the dynamics of microtubules in cells treated with vehicle (0.1% DMSO, top panel) or G-1 (lower panel). White arrows point to the intact and depolymerized microtubules. B) Representative screenshots from time-lapse videos showing the microtubule dynamics and morphology cells with or without G-1 treatment. Red arrows indicate the time point when DMSO or G-1 was added to the culture system. This video clearly shows that G-1 treatment interrupts microtubule assembly, leading to the failure of spindle formation and subsequent activation of cell death pathways, which is indicated by the formation of apoptotic bodies.
Figure 6
Figure 6. G-1 binds to the colchicine binding site in β-tubulin
The ability of G-1 to bind to the colchicine binding site in tubulin was evaluated with a colchicine site competitive assay. Incubation with colchicine, G-1, fluorescein-labelled G-1 and 2-ME suppressed H3-Colchicine binding in a concentration dependent manner. Incubation with vinblastine, which was used as a negative control, had no effect on H3-Colchicine binding to β-tubulin. Each point represents mean ± SEM (n = 4). The competition analysis was repeated for three times. FG-1: fluorescein-labelled G-1. 2-ME; 2-methoxyestradiol.

Similar articles

Cited by

References

    1. Burns KA, Korach KS. Estrogen receptors and human disease: an update. Arch Toxicol. 2012;86:1491–1504. - PMC - PubMed
    1. Revankar CM, Cimino DF, Sklar LA, Arterburn JB, Prossnitz ER. A transmembrane intracellular estrogen receptor mediates rapid cell signaling. Science. 2005;307:1625–1630. - PubMed
    1. Bologa CG, Revankar CM, Young SM, Edwards BS, Arterburn JB, Kiselyov AS, et al. Virtual and biomolecular screening converge on a selective agonist for GPR30. Nat Chem Biol. 2006;2:207–212. - PubMed
    1. Prossnitz ER, Barton M. The G-protein-coupled estrogen receptor GPER in health and disease. Nat Rev Endocrinol. 2011;7:715–726. - PMC - PubMed
    1. Albanito L, Madeo A, Lappano R, Vivacqua A, Rago V, Carpino A, et al. G protein-coupled receptor 30 (GPR30) mediates gene expression changes and growth response to 17beta-estradiol and selective GPR30 ligand G-1 in ovarian cancer cells. Cancer Res. 2007;67:1859–1866. - PubMed

Publication types

MeSH terms

Substances

LinkOut - more resources