. 2017 Mar 21;114(12):3169-3174.
doi: 10.1073/pnas.1701690114. Epub 2017 Mar 3.

ZNF50 3/ Zpo2 drives aggressive breast cancer progression by down-regulation of GATA3 expression

Affiliations

ZNF50 3/ Zpo2 drives aggressive breast cancer progression by down-regulation of GATA3 expression

Payam Shahi et al. Proc Natl Acad Sci U S A. .

Abstract

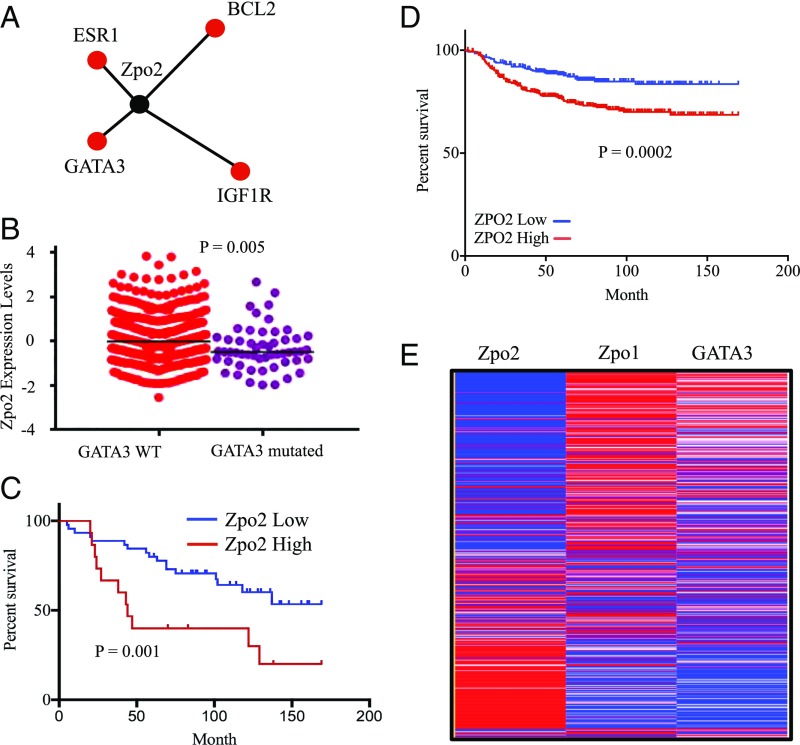
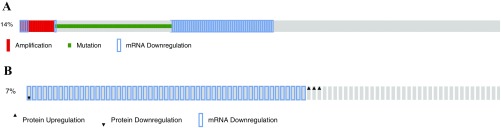
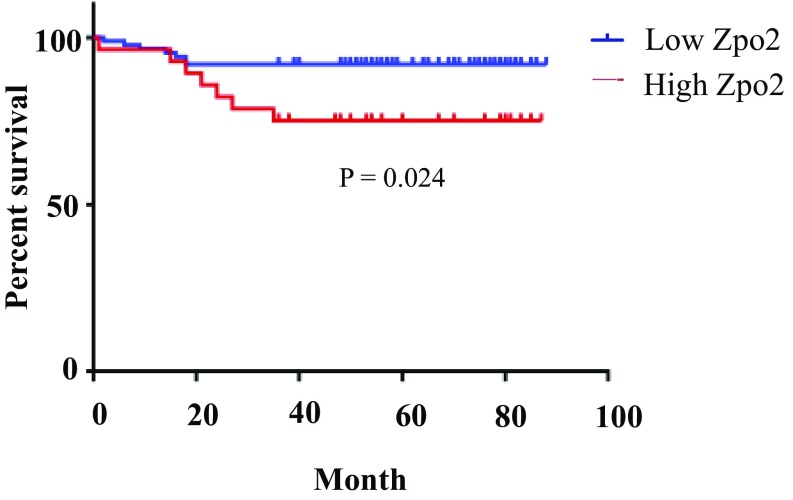
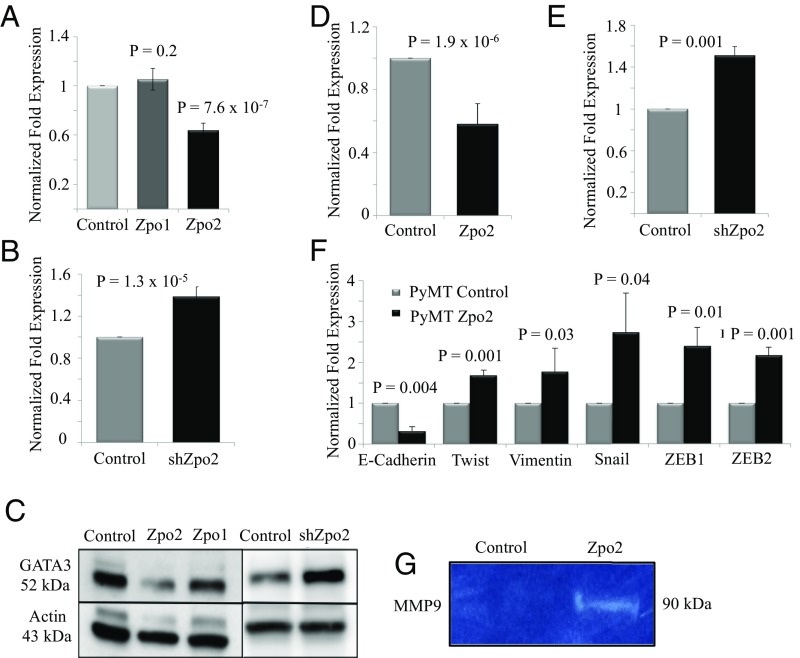
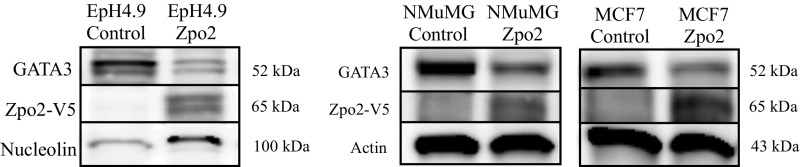
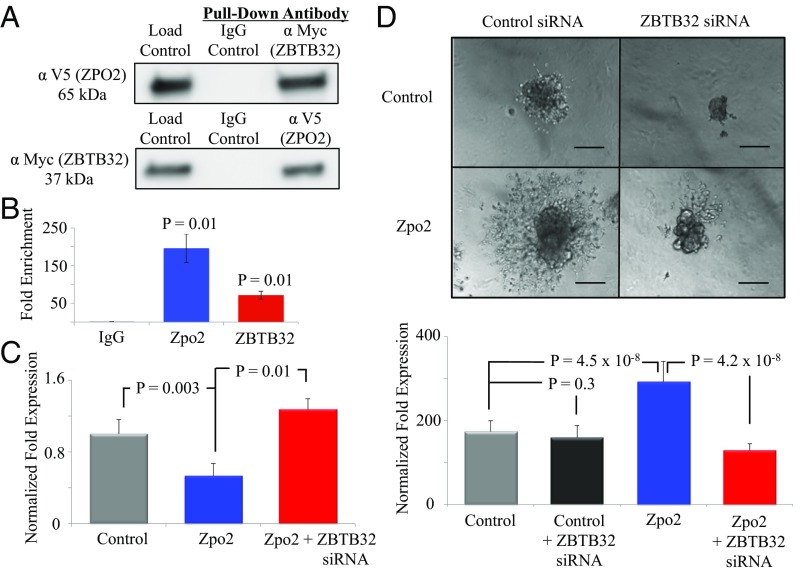
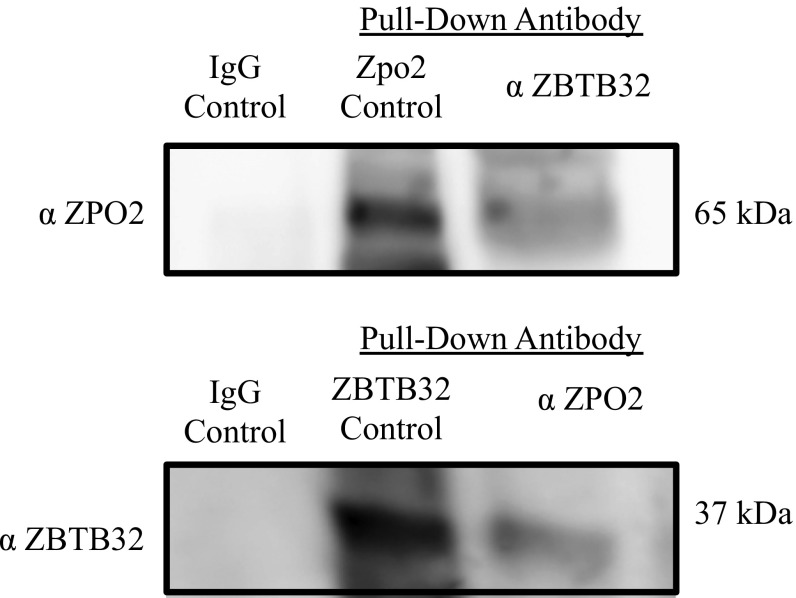
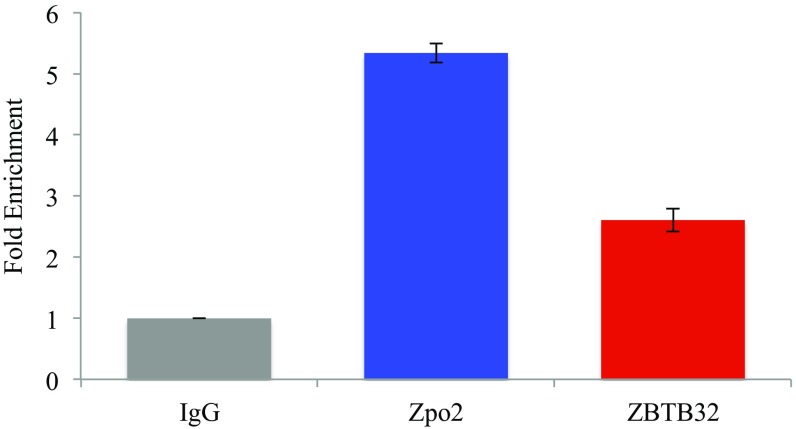
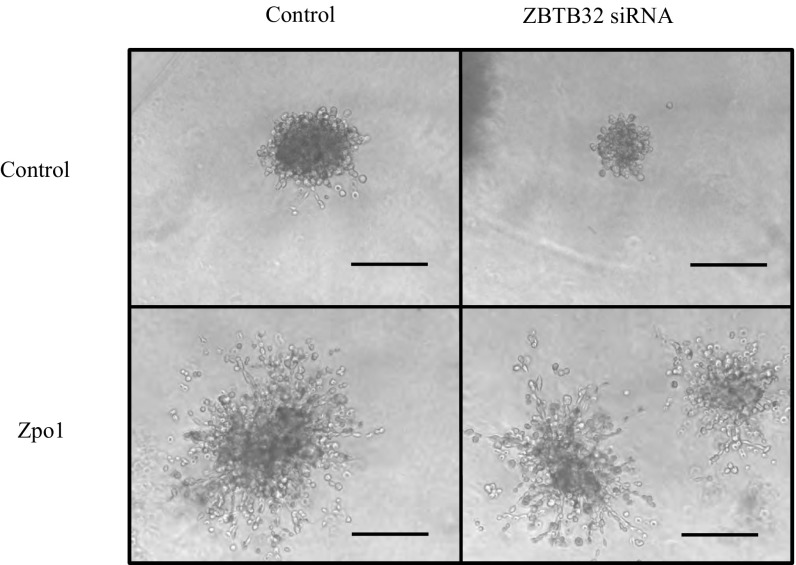
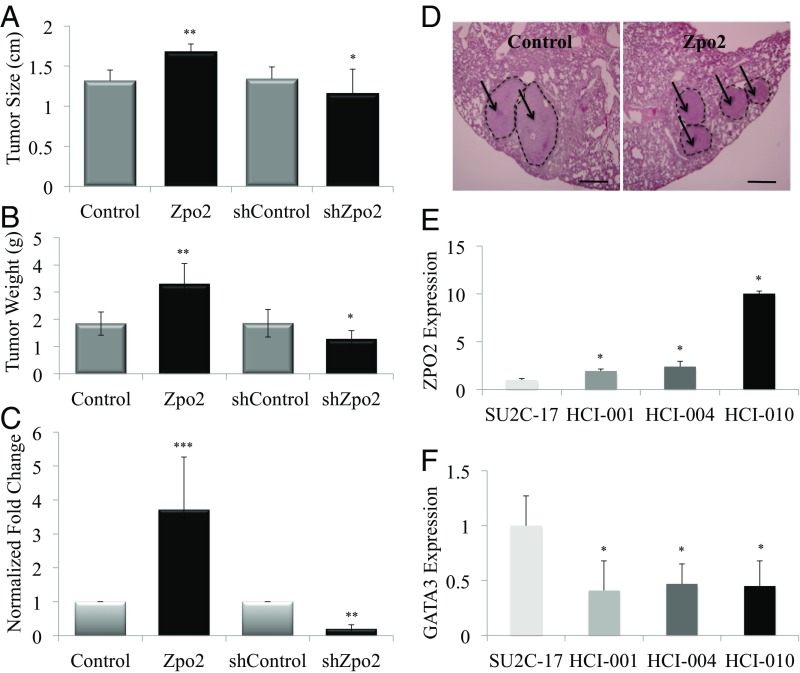
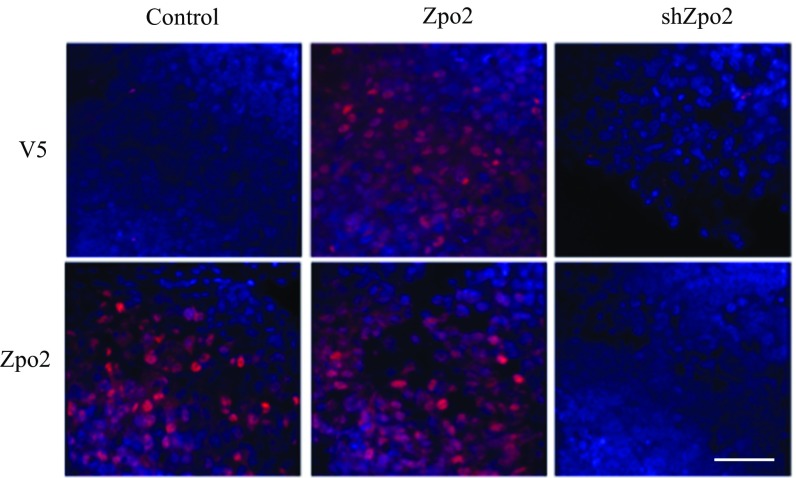
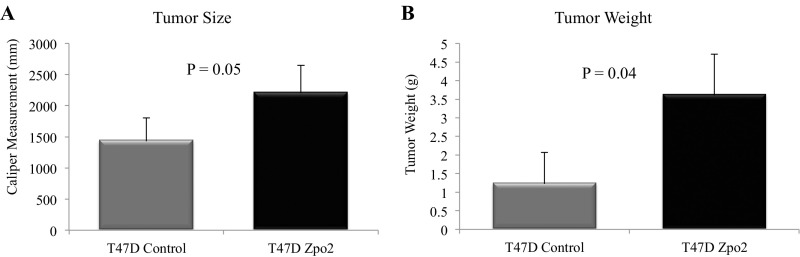
The transcription factor GATA3 is the master regulator that drives mammary luminal epithelial cell differentiation and maintains mammary gland homeostasis. Loss of GATA3 is associated with aggressive breast cancer development. We have identified ZNF503/ZEPPO2 zinc-finger elbow-related proline domain protein 2 (ZPO2) as a transcriptional repressor of GATA3 expression and transcriptional activity that induces mammary epithelial cell proliferation and breast cancer development. We show that ZPO2 is recruited to GATA3 promoter in association with ZBTB32 (Repressor of GATA, ROG) and that ZBTB32 is essential for down-regulation of GATA3 via ZPO2. Through this modulation of GATA3 activity, ZPO2 promotes aggressive breast cancer development. Our data provide insight into a mechanism of GATA3 regulation, and identify ZPO2 as a possible candidate gene for future diagnostic and therapeutic strategies.

Keywords: GATA3; ZBTB32; ZNF503/ZPO2; breast cancer; tumor metastasis.


Conflict of interest statement

The authors declare no conflict of interest.

Figures

Fig. 1.
Fig. 1.
In silico analysis of ZPO2 expression using a breast cancer database. (A) Protein network analysis indicating pairwise association between ZPO2 and GATA3. The analysis was performed with Regulome Explorer using the TCGA database. (B) TCGA database analysis of ZPO2 expression in breast cancer samples with either WT or mutated GATA3. WT GATA3: mean ± SD, 0.093 ± 1.056; SEM, ± 0.049. Mutated GATA3: mean ± SD, −0.328 ± 0.982; SEM, ± 0.134. (C) Patient survival analysis based on high or low ZPO2 expression. The GSE1378 breast cancer dataset was downloaded from the National Center for Biotechnology Information’s Gene Expression Omnibus database. We divided the patients into two groups with different survival curves using ZPO2 gene expression (quartile cutoff was set at 25% high and 75% low ZPO2 expression). Higher ZPO2 expression was associated with poor prognosis. (D) Kaplan–Meier analysis of distant metastasis free survival using the DMFS database. HR, 1.99; 95% CI, 1.38–2.86; P = 0.0002. (E) Heat map of the TCGA database analysis for ZPO2, ZPO1, and GATA3 expression in breast cancer patients.
Fig. S1.
Fig. S1.
TCGA analysis for GATA3 expression via cBioPortal. (A) 14% of analyzed breast cancer samples show GATA3 alterations, including mutation and amplification. (B) 7% of analyzed breast cancer samples indicate mRNA down-regulation without the presence of mutations.
Fig. S2.
Fig. S2.
ZPO2 expression analysis using the GSE19615 dataset. Overexpression of ZPO2 correlates with low patient survival.
Fig. 2.
Fig. 2.
Effect of elevated Zpo2 levels on Zpo1-, GATA3-, and EMT-associated genes. (A) qRT-PCR analysis indicating GATA3 levels in EpH4.9 cells overexpressing Zpo1 and Zpo2. (B) qRT-PCR analysis indicating that shRNA-mediated down-regulation of Zpo2 increases Gata3 levels. (C) Western blot analysis in EpH4.9 mammary epithelial cell extracts. Zpo2 overexpression lowers GATA3 levels. Zpo1 overexpression does not alter GATA3 levels. Down-regulation of Zpo2 elevates GATA3 levels. (D) qRT-PCR analysis of Gata3 expression in PyMT cells overexpressing Zpo2. Zpo2 down-regulates Gata3 levels. (E) qRT-PCR analysis in PyMT cells. Down-regulation of Zpo2 results in increased Gata3 levels. (F) qRT-PCR analysis of EMT-associated genes in PyMT cells. Overexpression of Zpo2 alters EMT-associated gene expression (G) Zymogram analysis indicating increased MMP9 levels in EpH4.9 mammary epithelial cells overexpressing Zpo2.
Fig. S3.
Fig. S3.
Zpo2 down-regulates GATA3. Control plasmid or full-length Zpo2 constructs were transiently transfected in EpH4.9, NMuMg, and MCF7 mammary cells. At 2 d posttransfection, the cells were lysed, and the cell lysate was analyzed for GATA3 and Zpo2 via Western blot analysis. Overexpression of Zpo2 resulted in down-regulation of GATA3 in all cell lines.
Fig. 3.
Fig. 3.
Analysis of Zpo2 and ZBTB32 interaction. (A) Co-IP experiment indicating Zpo2 and ZBTB32 interaction. EpH4.9 cells were cotransfected with V5-tagged Zpo2 and Myc-tagged Zbtb32 constructs. Pull-down was performed with control IgG, anti-Myc (ZBTB32), or anti-V5 tag (ZPO2) antibodies. Western blot analysis for the presence of Zpo2 or ZBTB32 was performed with anti-V5 tag or anti-Myc antibodies, respectively. (B) ChIP analysis indicating the presence of Zpo2 and ZBTB32 on the Gata3 promoter. qRT-PCR analysis was performed using primers specific to the Gata3 promoter. n = 4. (C) qRT-PCR analysis for Gata3 expression in EpH4.9 control or EpH4.9 Zpo2-overexpressing cells in the presence or absence of ZBTB32. Inhibition of Zbtb32 restored Gata3 levels. (D) 3D Matrigel culture assay of control or Zpo2-overexpressing EpH4.9 cells. Inhibition of Zbtb32 interferes with cellular invasion mediated by Zpo2. (Scale bar: 150 µm.)
Fig. S4.
Fig. S4.
Co-IP experiment indicating endogenous ZPO2 and ZBTB32 interaction in EpH4.9 cells. For each experiment, 10 mg of total protein was pulled down via anti-ZPO2 or anti-ZBTB32 antibody. The samples were examined via Western blot analysis using anti-ZPO2 or anti-ZBTB32 antibody. Bidirectional co-IP indicates that ZPO2 and ZBTB32 form a complex in EpH4.9 mammary cells.
Fig. S5.
Fig. S5.
ChIP analysis indicating that ZPO2 and ZBTB32 occupy the Gata3 promoter. EpH4.9 cells were grown in 150-mm culture dishes and cotransfected with full-length Zpo2 and Myc-tagged ZBTB32 (generous gifts from Dr. I.-Cheng Ho, Harvard Medical School) constructs via FuGENE6 transfection reagent (Promega). ChIP analysis was performed using the ChIP-IT High-Sensitivity Kit (Active Motif) in accordance with the manufacturer’s protocol. qPCR for ChIP samples was performed using Gata3 promoter sequence primers listed in the text. ChIP analysis indicated that both ZPO2 and ZBTB32 occupy the promoter sequence of GATA3.
Fig. S6.
Fig. S6.
Zpo1-overexpressing EpH4.9 cells were placed in 3D Matrigel cultures. Zpo1 induced an aggressive phenotype. Zpo1-overexpressing cells infiltrated through the Matrigel matrix. Knockdown of Zbtb32 did not alter Zpo1-induced cellular invasion. (Scale bar: 150 µm.)
Fig. 4.
Fig. 4.
Zpo2 promotes aggressive mammary tumor development. (A) Tumor measurement of orthotopically transplanted PyMT tumor cells. Zpo2 overexpression enhances tumor growth. Knockdown of Zpo2 reduces tumor size compared with controls. Zpo2-overexpressing tumors, **P ≤ 0.01. Zpo2 knockdown tumors, *P < 0.05. n = 10. (B) Zpo2 overexpression leads to increased tumor weight, and knockdown of Zpo2 decreases tumor weight compared with controls. Zpo2-overexpressing tumors, **P < 0.01; Zpo2 knockdown tumors, *P < 0.05. n = 10. (C) qRT-PCR analysis using PyMT-specific primers for the presence of metastatic PyMT cells in the lung. Zpo2 enhances tumor metastasis. Knockdown of Zpo2 reduces the metastatic ability of PyMT cells to the lung. Zpo2-overexpressing tumors, ***P < 0.0001. Zpo2 knockdown tumors. **P < 0.001. n = 10. (D) H&E staining of lung tissue. Overexpression of Zpo2 in PyMT cells enhances metastatic colony formation in the recipient lungs. The arrows point at metastatic colonies in the recipient lung. (Scale bar: 200 μm.) (E) qRT-PCR analysis of ZPO2 expression in PDX tumor lines. More aggressive tumor lines indicate higher ZPO2 expression. *P < 0.001. (F) qRT-PCR analysis of GATA3 levels in PDX tumor lines. GATA3 expression is reduced in more metastatic tumor lines. *P < 0.001.
Fig. S7.
Fig. S7.
Immunostaining analysis of Zpo2 expression in orthotopic PyMT tumor transplants. Tumor sections were stained either with anti-Zpo2 antibody for analysis of endogenous Zpo2 expression or with anti-V5 tag antibody for the overexpressed construct. Control and Zpo2- overexpressing tumor sections stained positive for anti-Zpo2 staining. Only Zpo2-overexpressing tumor sections stained positive for anti-V5 tag antibody. The tumor sections expressing shZpo2 did not stain for either of the antibodies. (Scale bar: 50 μm.)
Fig. S8.
Fig. S8.
Zpo2 enhances T47D xenograft tumor growth. Analysis of orthotopically transplanted T47D tumors at 4 wk posttransplantation. Tumor cells overexpressing Zpo2 gave rise to larger tumors (A) and increased tumor weight (B) (n = 5).

Similar articles

Cited by

References

    1. Kouros-Mehr H, Slorach EM, Sternlicht MD, Werb Z. GATA-3 maintains the differentiation of the luminal cell fate in the mammary gland. Cell. 2006;127(5):1041–1055. - PMC - PubMed
    1. Asselin-Labat ML, et al. Gata-3 is an essential regulator of mammary gland morphogenesis and luminal cell differentiation. Nat Cell Biol. 2007;9(2):201–209. - PubMed
    1. Kouros-Mehr H, Kim JW, Bechis SK, Werb Z. GATA-3 and the regulation of the mammary luminal cell fate. Curr Opin Cell Biol. 2008;20(2):164–170. - PMC - PubMed
    1. Cancer Genome Atlas N. Cancer Genome Atlas Network Comprehensive molecular portraits of human breast tumours. Nature. 2012;490(7418):61–70. - PMC - PubMed
    1. Bertucci F, et al. Gene expression profiling of primary breast carcinomas using arrays of candidate genes. Hum Mol Genet. 2000;9(20):2981–2991. - PubMed

Publication types

MeSH terms

Substances