. 2017 May;206(1):451-465.
doi: 10.1534/genetics.116.197335. Epub 2017 Mar 3.

A Pooled Sequencing Approach Identifies a Candidate Meiotic Driver in Drosophila

Affiliations

A Pooled Sequencing Approach Identifies a Candidate Meiotic Driver in Drosophila

Kevin H-C Wei et al. Genetics. 2017 May.

Abstract

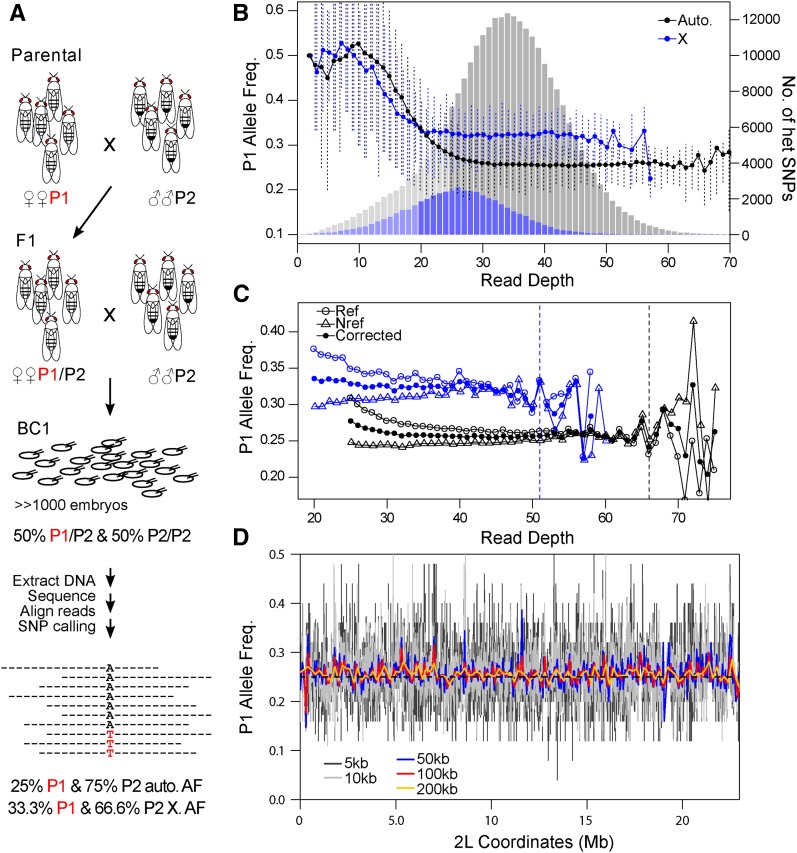
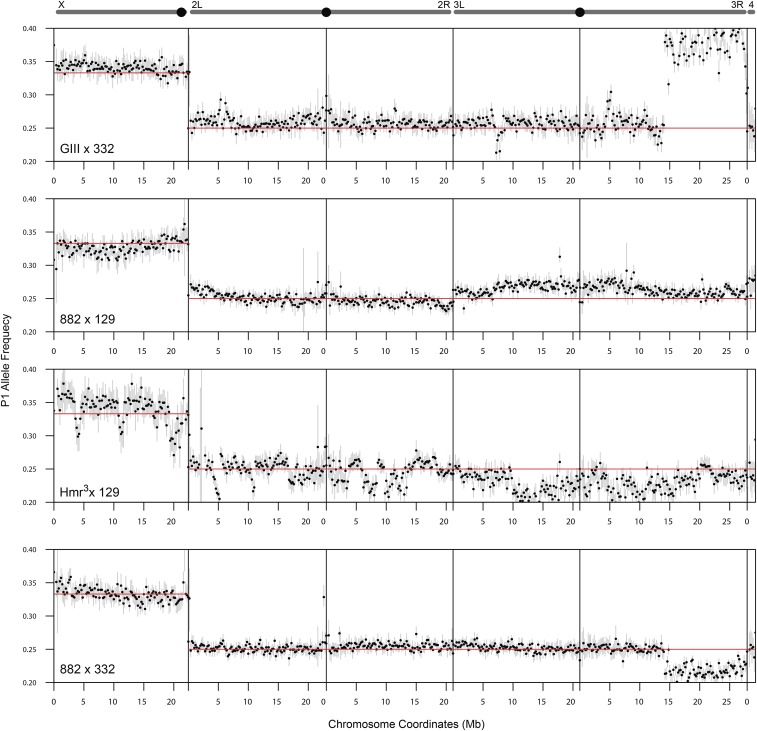
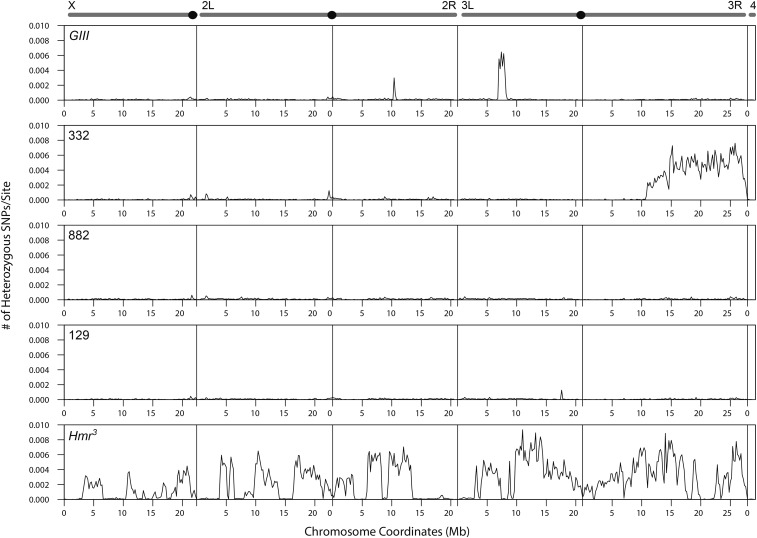
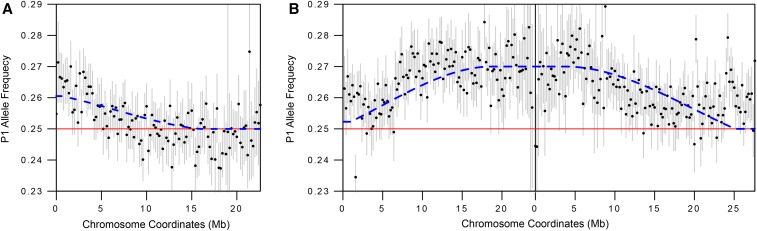
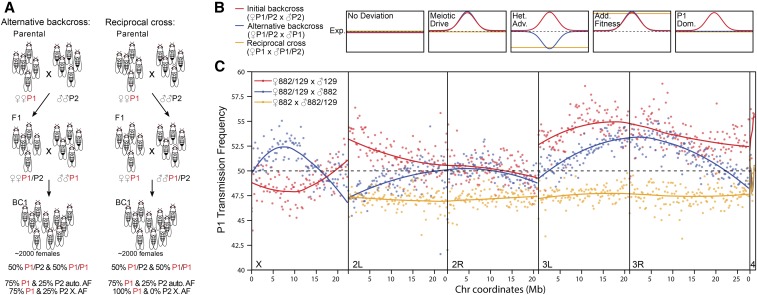
Meiotic drive occurs when a selfish element increases its transmission frequency above the Mendelian ratio by hijacking the asymmetric divisions of female meiosis. Meiotic drive causes genomic conflict and potentially has a major impact on genome evolution, but only a few drive loci of large effect have been described. New methods to reliably detect meiotic drive are therefore needed, particularly for discovering moderate-strength drivers that are likely to be more prevalent in natural populations than strong drivers. Here, we report an efficient method that uses sequencing of large pools of backcross (BC1) progeny to test for deviations from Mendelian segregation genome-wide with single-nucleotide polymorphisms (SNPs) that distinguish the parental strains. We show that meiotic drive can be detected by a characteristic pattern of decay in distortion of SNP frequencies, caused by recombination unlinking the driver from distal loci. We further show that control crosses allow allele-frequency distortion caused by meiotic drive to be distinguished from distortion resulting from developmental effects. We used this approach to test whether chromosomes with extreme telomere-length differences segregate at Mendelian ratios, as telomeric regions are a potential hotspot for meiotic drive due to their roles in meiotic segregation and multiple observations of high rates of telomere sequence evolution. Using four different pairings of long and short telomere strains, we find no evidence that extreme telomere-length variation causes meiotic drive in Drosophila However, we identify one candidate meiotic driver in a centromere-linked region that shows an ∼8% increase in transmission frequency, corresponding to a ∼54:46 segregation ratio. Our results show that candidate meiotic drivers of moderate strength can be readily detected and localized in pools of BC1 progeny.

Keywords: Drosophila; centromeres; drive; meiotic; telomeres.


Figures

Figure 1
Figure 1
Natural variation in telomere length as assayed by Het-A quantities. (A) Het-A copy number was measured using qPCR on the DGRP lines as well as the long-telomere strain GIII (Siriaco et al. 2002; Mackay et al. 2012). The primer pair (convergent arrows) targeting the 5′ region is depicted on the schematic of one full length HeT-A transcript, where the gag CDS is colored in blue, the promoter in red, and UTRs are dotted lines. The most extreme lines at each end of the distribution are labeled. Error bars represent the relative error estimated from triplicates. (B) Polytene chromosome spreads of DGRP-332, DGRP-882, and an F1 heterozygote are probed with Het-A probe (green). DNA is labeled by DAPI (blue). In the heterozygote, the long allele is labeled by a red arrow and the short allele by a white arrow. (C) Relative HeT-A quantities were determined at the 3′ CDS and promoter regions, as indicated on the schematic, in a subset of the DGRP and mutant lines. HeT-A quantities at the 5′CDS from Figure 1A are also replotted. Note that different qPCR protocols were used for the two different experiments (see Materials and Methods). Quantities are therefore plotted relative to DGRP-332 so that the three regions can be compared. Hmr3 was not assayed at the 5′CDS (ND). (D) HeT-A quantities were measured in whole females, ovaries, and carcasses with ovaries removed in a long (GIII) and a short (DGRP-332) line, using the 3′ CDS primer pair. (E) HeT-A quantities were measured in F1s heterozygous for long (GIII) and short (DGRP-332) telomeres and backcross embryos of the F1 females crossed to DGRP-332 males using the 3′ CDS primer pair. Note that the y-axis here is in a linear scale.
Figure 2
Figure 2
Experimental strategy and statistical considerations for assessing allele frequency by pooled sequencing. (A) Strategy to measure distortion of Mendelian segregation using whole-genome sequencing of pooled embryos. Females (P1) and males (P2) of different telomere lengths are mated to generate F1s. The F1 females are backcrossed to P2 and a large number of 3- to 4-hr-old BC1 embryos collected for sequencing. Heterozygous SNP sites are identified to infer segregation frequency. At the bottom are shown the allele frequencies (AF) expected under Mendelian segregation for autosomal (auto.) and X-linked (X) alleles. (B–D) Analysis of SNPs from the DGRP-882 and DGRP-129 cross. (B) Observed average frequencies of the P1 allele in backcross progeny across heterozygous sites at different read depths are plotted for the autosomal (black line), and X-linked SNPs (blue line). Error-bars delineate the 0.25 and 0.75 quantiles. Underneath is the distribution of autosomal (gray) and X-linked (blue) heterozygous (het) SNPs for each read depth. Bins with lighter shades are sites removed from allele frequency estimation in downstream analyses. (C) The average allele frequency in backcross progeny is plotted when P1 is the reference allele (open circles) and when it is the alternative allele (triangles). The allele frequency after correction for reference is plotted in closed circles. Autosomal and X-linked sites are distinguished by black and blue, respectively. Dotted lines mark the cutoffs for reference allele correction. (D) Aggregating heterozygous sites reduces the sampling noise. Allele frequencies are estimated from simulated reads that have 25% P1 frequency (dotted black lines), and plotted after binning sites at different window sizes (colored lines).
Figure 3
Figure 3
P1 allele frequency estimates across chromosomes. Schematics of chromosomes are shown at the top with centromeres labeled as black circles, except for the 4th chromosome at the far right. For each of the crosses, the frequencies of allele counts at heterozygous sites are averaged in 200 kb windows and plotted across all chromosomes. Red horizontal lines mark the Mendelian expectation. Error bars represent 99% confidence intervals, which are derived from Monte-Carlo simulations that sum sites with counts randomly generated using the beta-binomial distribution (see Materials and Methods).
Figure 4
Figure 4
Frequency of heterozygous sites of parental lines. For each of the parental lines, the frequency of heterozygous sites per base is plotted across the chromosomes in 200 kb windows.
Figure 5
Figure 5
Allele frequency decay due to recombination. (A, B) Magnified views of chromosomes 2L (A) and 3 (B) from the DGRP-882 × DGRP-129 cross. The blue dotted line indicates the expected decline in signal of distortion for a telomeric (A) or centromeric (B) drive locus, based on genome-wide recombination rate estimates.
Figure 6
Figure 6
Crosses to distinguish developmental effects from meiotic drive. (A) Two cross schemes to determine whether the deviations observed with the initial cross scheme (Figure 2A) are true meiotic drive effects as opposed to developmental effects. At the bottom are shown the genotype frequencies above the autosomal allele frequencies (AF) expected under Mendelian segregation. Note that only adult females were collected. (B) Patterns of deviation of P1 transmission frequency from the Mendelian expectation (dotted lines) depending on the cross scheme (colored lines) are depicted for meiotic drive, heterozygous advantage (Het. Adv.), and P1-allele-specific fitness advantage that is additive (Add. Fitness) or dominant (P1 Dom.). (C) The transmission frequency of the P1 allele (DGRP-882), averaged across 200 kb windows, is plotted for the initial cross from Figure 3A (red), the alternative backcross (blue), and the reciprocal cross (yellow). The curves for each cross scheme and chromosome were fitted using local regression (LOESS).

Similar articles

Cited by

References

    1. Anderson J. A., Song Y. S., Langley C. H., 2008. Molecular population genetics of Drosophila subtelomeric DNA. Genetics 178: 477–487. - PMC - PubMed
    1. Bélanger S., Clermont I., Esteves P., Belzile F., 2016. Extent and overlap of segregation distortion regions in 12 barley crosses determined via a Pool-GBS approach. Theor. Appl. Genet. 129: 1393–1404. - PubMed
    1. Blumenstiel J. P., 2011. Evolutionary dynamics of transposable elements in a small RNA world. Trends Genet. 27: 23–31. - PubMed
    1. Brand C. L., Larracuente A. M., Presgraves D. C., 2015. Origin, evolution, and population genetics of the selfish Segregation Distorter gene duplication in European and African populations of Drosophila melanogaster. Evolution 69: 1271–1283. - PMC - PubMed
    1. Cai G., Li H., Lu Y., Huang X., Lee J., et al. , 2012. Accuracy of RNA-Seq and its dependence on sequencing depth. BMC Bioinformatics 13(Suppl. 13): S5. - PMC - PubMed

Publication types

LinkOut - more resources