

The Bacterial Sequential Markov Coalescent
- PMID: 28258183
- PMCID: PMC5419479
- DOI: 10.1534/genetics.116.198796
The Bacterial Sequential Markov Coalescent
Abstract
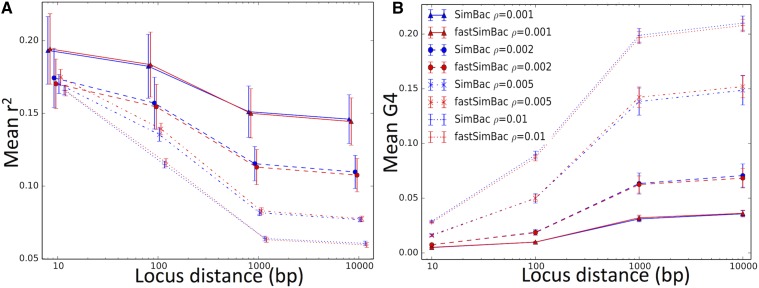
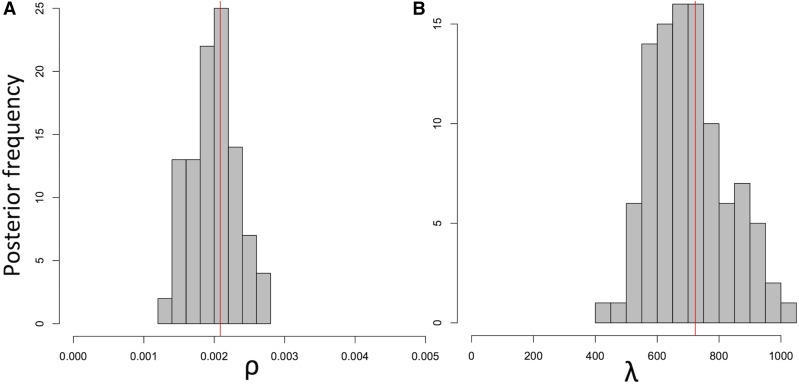
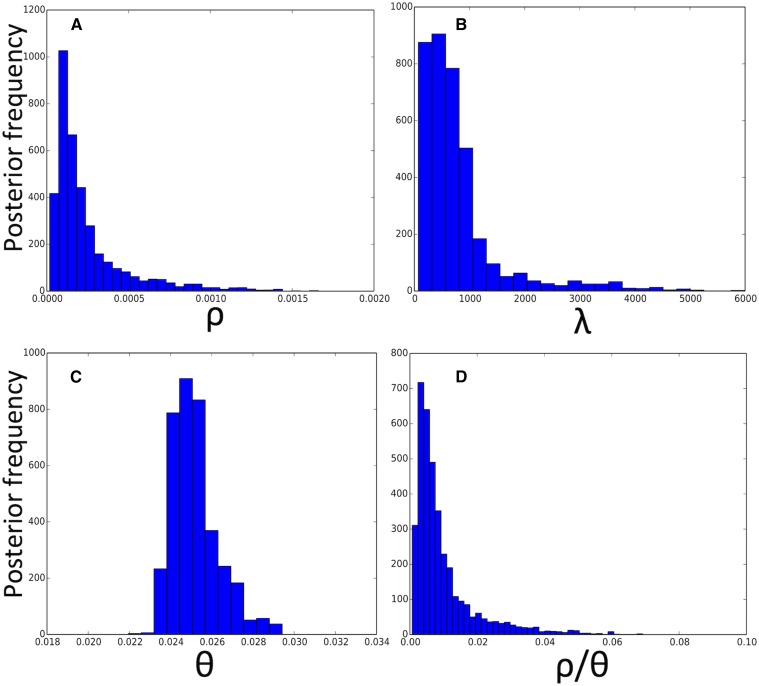
Bacteria can exchange and acquire new genetic material from other organisms directly and via the environment. This process, known as bacterial recombination, has a strong impact on the evolution of bacteria, for example, leading to the spread of antibiotic resistance across clades and species, and to the avoidance of clonal interference. Recombination hinders phylogenetic and transmission inference because it creates patterns of substitutions (homoplasies) inconsistent with the hypothesis of a single evolutionary tree. Bacterial recombination is typically modeled as statistically akin to gene conversion in eukaryotes, i.e., using the coalescent with gene conversion (CGC). However, this model can be very computationally demanding as it needs to account for the correlations of evolutionary histories of even distant loci. So, with the increasing popularity of whole genome sequencing, the need has emerged for a faster approach to model and simulate bacterial genome evolution. We present a new model that approximates the coalescent with gene conversion: the bacterial sequential Markov coalescent (BSMC). Our approach is based on a similar idea to the sequential Markov coalescent (SMC)-an approximation of the coalescent with crossover recombination. However, bacterial recombination poses hurdles to a sequential Markov approximation, as it leads to strong correlations and linkage disequilibrium across very distant sites in the genome. Our BSMC overcomes these difficulties, and shows a considerable reduction in computational demand compared to the exact CGC, and very similar patterns in simulated data. We implemented our BSMC model within new simulation software FastSimBac. In addition to the decreased computational demand compared to previous bacterial genome evolution simulators, FastSimBac provides more general options for evolutionary scenarios, allowing population structure with migration, speciation, population size changes, and recombination hotspots. FastSimBac is available from https://bitbucket.org/nicofmay/fastsimbac, and is distributed as open source under the terms of the GNU General Public License. Lastly, we use the BSMC within an Approximate Bayesian Computation (ABC) inference scheme, and suggest that parameters simulated under the exact CGC can correctly be recovered, further showcasing the accuracy of the BSMC. With this ABC we infer recombination rate, mutation rate, and recombination tract length of Bacillus cereus from a whole genome alignment.
Keywords: ABC; bacterial evolution; coalescent; recombination; simulations.
Copyright © 2017 Maio and Wilson.
Figures


Similar articles
-
SimBac: simulation of whole bacterial genomes with homologous recombination.Microb Genom. 2016 Jan 19;2(1):e000044. doi: 10.1099/mgen.0.000044. Microb Genom. 2016. PMID: 27713837 Free PMC article.
-
Critical assessment of coalescent simulators in modeling recombination hotspots in genomic sequences.BMC Bioinformatics. 2014 Jan 3;15:3. doi: 10.1186/1471-2105-15-3. BMC Bioinformatics. 2014. PMID: 24387001 Free PMC article.
-
Inference of the properties of the recombination process from whole bacterial genomes.Genetics. 2014 Jan;196(1):253-65. doi: 10.1534/genetics.113.157172. Epub 2013 Oct 30. Genetics. 2014. PMID: 24172133 Free PMC article.
-
Are you my mother? Bayesian phylogenetic inference of recombination among putative parental strains.Appl Bioinformatics. 2003;2(3):131-44. Appl Bioinformatics. 2003. PMID: 15130798 Review.
-
On the use of kernel approximate Bayesian computation to infer population history.Genes Genet Syst. 2015;90(3):153-62. doi: 10.1266/ggs.90.153. Genes Genet Syst. 2015. PMID: 26510570 Review.
Cited by
-
Horizontal transmission and recombination maintain forever young bacterial symbiont genomes.PLoS Genet. 2020 Aug 25;16(8):e1008935. doi: 10.1371/journal.pgen.1008935. eCollection 2020 Aug. PLoS Genet. 2020. PMID: 32841233 Free PMC article.
-
phastSim: efficient simulation of sequence evolution for pandemic-scale datasets.bioRxiv [Preprint]. 2021 Sep 23:2021.03.15.435416. doi: 10.1101/2021.03.15.435416. bioRxiv. 2021. Update in: PLoS Comput Biol. 2022 Apr 29;18(4):e1010056. doi: 10.1371/journal.pcbi.1010056. PMID: 33758852 Free PMC article. Updated. Preprint.
-
phastSim: Efficient simulation of sequence evolution for pandemic-scale datasets.PLoS Comput Biol. 2022 Apr 29;18(4):e1010056. doi: 10.1371/journal.pcbi.1010056. eCollection 2022 Apr. PLoS Comput Biol. 2022. PMID: 35486906 Free PMC article.
-
Hotspots of genetic change in Yersinia pestis.Nat Commun. 2025 Jan 4;16(1):388. doi: 10.1038/s41467-024-55581-4. Nat Commun. 2025. PMID: 39755708 Free PMC article.
-
Fitness Tradeoffs of Antibiotic Resistance in Extraintestinal Pathogenic Escherichia coli.Genome Biol Evol. 2018 Feb 1;10(2):667-679. doi: 10.1093/gbe/evy030. Genome Biol Evol. 2018. PMID: 29432584 Free PMC article.
References
-
- Arnesen L. P. S., Fagerlund A., Granum P. E., 2008. From soil to gut: Bacillus cereus and its food poisoning toxins. FEMS Microbiol. Rev. 32: 579–606. - PubMed
Publication types
MeSH terms
Grants and funding
LinkOut - more resources
Full Text Sources
Other Literature Sources
