. 2017 Jun;31(6):2576-2591.
doi: 10.1096/fj.201601021R. Epub 2017 Mar 3.

Selective expression of TSPAN2 in vascular smooth muscle is independently regulated by TGF-β1/SMAD and myocardin/serum response factor

Affiliations

Selective expression of TSPAN2 in vascular smooth muscle is independently regulated by TGF-β1/SMAD and myocardin/serum response factor

Jinjing Zhao et al. FASEB J. 2017 Jun.

Abstract

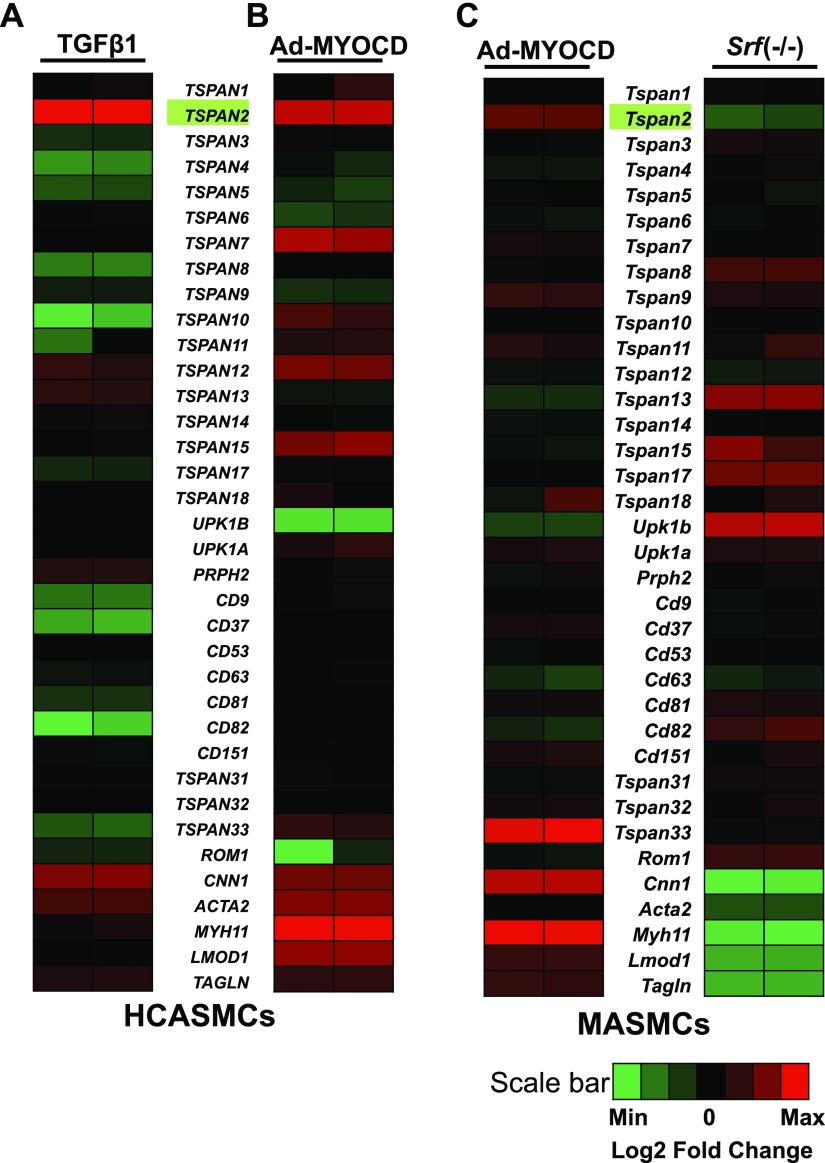
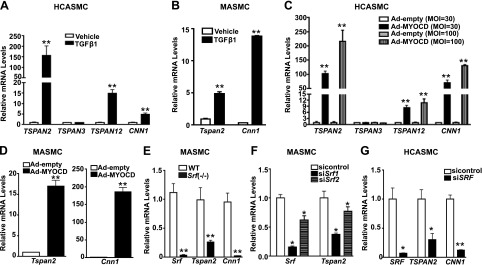
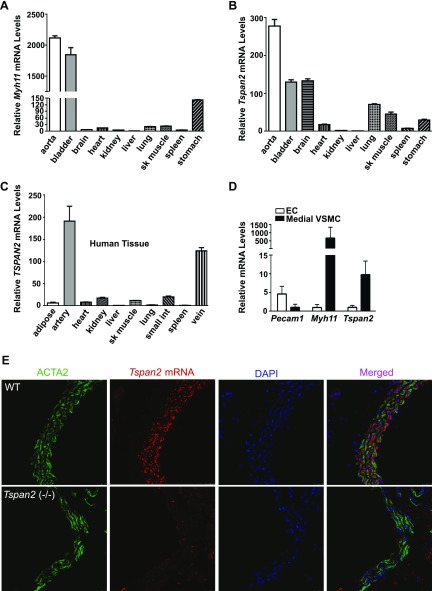
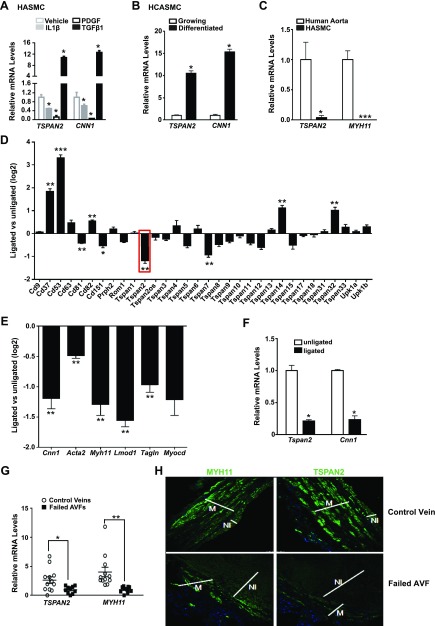
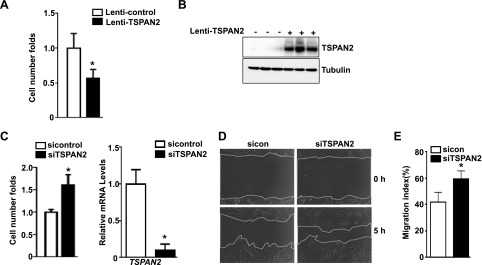
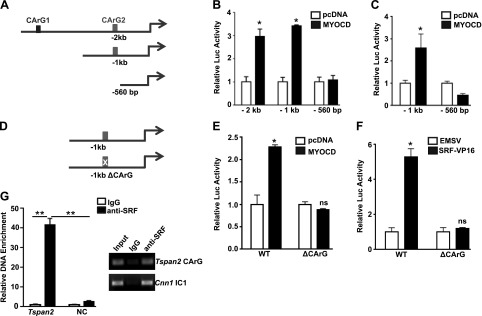
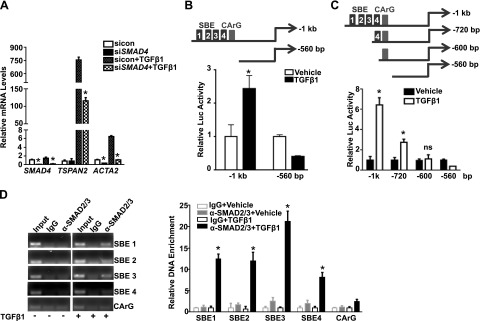
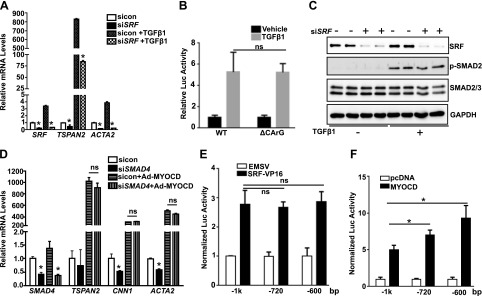
Tetraspanins (TSPANs) comprise a large family of 4-transmembrane domain proteins. The importance of TSPANs in vascular smooth muscle cells (VSMCs) is unexplored. Given that TGF-β1 and myocardin (MYOCD) are potent activators for VSMC differentiation, we screened for TGF-β1 and MYOCD/serum response factor (SRF)-regulated TSPANs in VSMC by using RNA-seq analyses and RNA-arrays. TSPAN2 was found to be the only TSPAN family gene induced by TGF-β1 and MYOCD, and reduced by SRF deficiency in VSMCs. We also found that TSPAN2 is highly expressed in smooth muscle-enriched tissues and down-regulated in in vitro models of VSMC phenotypic modulation. TSPAN2 expression is attenuated in mouse carotid arteries after ligation injury and in failed human arteriovenous fistula samples after occlusion by dedifferentiated neointimal VSMC. In vitro functional studies showed that TSPAN2 suppresses VSMC proliferation and migration. Luciferase reporter and chromatin immunoprecipitation assays demonstrated that TSPAN2 is regulated by 2 parallel pathways, MYOCD/SRF and TGF-β1/SMAD, via distinct binding elements within the proximal promoter. Thus, we identified the first VSMC-enriched and MYOCD/SRF and TGF-β1/SMAD-dependent TSPAN family member, whose expression is intimately associated with VSMC differentiation and negatively correlated with vascular disease. Our results suggest that TSPAN2 may play important roles in vascular disease.-Zhao, J., Wu, W., Zhang, W., Lu, Y. W., Tou, E., Ye, J., Gao, P., Jourd'heuil, D., Singer, H. A., Wu, M., Long, X. Selective expression of TSPAN2 in vascular smooth muscle is independently regulated by TGF-β1/SMAD and myocardin/serum response factor.

Keywords: arteriovenous fistula; differentiation; phenotypic modulation; tetraspanins.


Figures

Figure 1.
Figure 1.
RNA-seq analyses and RNA-arrays for TSPAN family genes that are modulated by TGF-β1 and MYOCD/SRF in VSMCs. Heat map illustrates log2-transformed fold change of the transcript levels of TSPAN family members compared with their levels under basal condition. Contractile genes served as positive controls. Duplicate samples were included for each condition. A) Subconfluent HCASMCs were starved overnight, followed by TGF-β1 treatment for 24 h before total RNA was isolated for RNA-seq. Heat map shown illustrates the relative expression of each individual TSPAN gene of duplicate samples of vehicle or TGF-β1–treated HCASMCs. B) HCASMCs were transduced with adenovirus that carried MYOCD (Ad-MYOCD) or empty control adenovirus (Ad-Control) for 72 h before isolating RNA for RNA-seq. Heat map depicts the relative expression of TSPANs of the duplicate samples of HCASMCs treated with Ad-Control or Ad-MYOCD. C) MASMCs were transduced with Ad-MYOCD or Ad-Control for 72 h, and RNA was subjected to RNA-array analysis. Heat map shows the relative expression of each individual mouse Tspan gene of the duplicate MASMCs treated with Ad-Control or Ad-MYOCD (left). MASMCs were isolated from VSMC-specific Srf-knockout (Srf −/−) or WT littermates. RNA was isolated for RNA array. Heat map illustrates the relative expression of each individual Tspan gene of duplicate samples of Srf−/− compared with WT aortic MASMCs (right).
Figure 2.
Figure 2.
Quantitative RT-PCR validation of TSPAN2 gene expression regulated by TGF-β1 and MYOCD/SRF in VSMCs. A) HCASMCs were starved overnight, followed by TGF-β1 treatment for 24 h. RNA was isolated for quantitative RT-PCR analysis of indicated TSPAN genes and the positive control CNN1. (Robust induction of TSPAN2 was seen after treatment of TGF-β1.) B) Quantitative RT-PCR analysis of Tspan2 and Cnn1 gene expression in MASMCs treated with TGF-β1 (5 ng/ml) for 24 h. C) HCASMCs were transduced with adenovirus that carried MYOCD (Ad-MYOCD) or empty control adenovirus (Ad-Control) with indicated doses for 72 h before RNA was isolated for quantitative RT-PCR of indicated genes. D) MASMCs were transduced with Ad-MYOCD or control virus, as previously described. RNA was isolated for assessment of gene expression of Tspan2 and Cnn1. E) Quantitative RT-PCR of indicated genes in WT versus Srf-knockout MASMCs. F) Srf-knockdown effect on Tspan2 gene expression in MASMCs using 2 separate siRNAs. G) Effect of SRF knockdown on TSPAN2 gene expression in HCASMCs. MOI, multiplicity of infection. Values are means ± sd of at least 3 repeats. *P < 0.05, **P < 0.01.
Figure 3.
Figure 3.
TSPAN2 is enriched in VSMCs. A, B) Quantitative RT-PCR analysis of Myh11 (A) and Tspan2 (B) mRNA levels across different mouse tissues. C) Quantitative RT-PCR analysis of TSPAN2 mRNA levels in different human tissues. Relative mRNA levels of mouse Myh11, Tspan2, and human TSPAN2 were normalized to levels of the liver (set to 1). Representative data are shown from 3 independent experiments. D) ECs and medial layer VSMCs were purified from mouse aortas. RNA was then isolated for quatitative RT-PCR assessment of indicated genes. Values are means ± sd (n = 5). E) Double staining for Tspan2 mRNA by in situ hybridization and ACTA2 protein by immunofluorescence staining in aorta from WT and Tspan2−/− mice. (Note: Tspan2 transcripts (red) and ACTA2 protein (green) are colocalized in the medial layer VSMCs in mouse aortas.) sk muscle, skeletal muscle; small int, small intestine. Results are representative of ≥3 separate experiments.
Figure 4.
Figure 4.
TSPAN2 expression is down-regulated during VSMC phenotypic modulation and in diseased vessels. A) HASMCs were starved overnight, followed by treatment of indicated growth factors for 24 h. RNA was extracted for quantitative RT-PCR of TSPAN2 and CNN1. *P < 0.05. B) Quantitative RT-PCR analysis of TSPAN2 and CNN1 in growing vs. differentiated HCASMCs induced by conditioned medium for 72 h. *P < 0.05. C) Quantitative RT-PCR analysis of TSPAN2 and MYH11 in the medial layer VSMCs of human aortas compared with primary culture of HASMCs isolated from the same vessels. Values are means ± sd of at least 3 repeats. *P < 0.05, ***P < 0.001. D, E) Relative expression of Tspan family members (D) and the indicated VSMC contractile genes and Myocd (E) determined by RNA microarray of mouse carotid arteries at 5 d after complete ligation (28). Gene expression fold-change (log2) comparing ligated with unligated carotid arteries is shown as mean ± sem (n = 4). False discovery rate–adjusted P values for the comparison are reported. *P ≤ 0.05, **P ≤ 0.01; ***P ≤ 0.001. F) Tspan2 and Cnn1 mRNA levels were analyzed by quantitative RT-PCR in unligated and ligated mouse carotid arteries 2 wk after complete ligation surgery. Values are means ± sd (n = 4). *P < 0.05. G) Quantitative RT-PCR assessment of TSPAN2 and MYH11 mRNA in replacement control veins vs. failed AVF samples. Relative expression was normalized to the average mRNA value of the examined failed arteriovenous fistula (AVF) samples (set to 1). The source of AVF samples was described previously (26), and AVF samples were the unidentified discarded segments from patients with chronic kidney disease who underwent surgical revision of failed AVFs. *P < 0.05; **P < 0.01. H) Immunofluorescence staining of MYH11 (left) and TSPAN2 (right) proteins in the replacement control veins and failed AVF samples. [Note: higher levels of TSPAN2 protein were observed in control veins; medial layer VSMCs (M) have relatively higher levels of TSPAN2 protein compared with neointima (NI) cells in failed AVF samples.] Results are representative of 3 separate experiments.
Figure 5.
Figure 5.
Effect of TSPAN2 on VSMC proliferation and migration. A) Growing HCASMCs were transduced with lentivirus that carried TSPAN2 (Lenti-TSPAN2) or equal amounts of lenti-vector control (Lenti-control). Cells were starved overnight, then stimulated with growth medium. Cells were counted by using a hemocytometer at 4 d after serum stimulation. Cell proliferation was defined as fold change to Lenti-control group (set to 1). Values are means ± sd, and data are representative of 3 separate experiments (n = 3). B) Protein was isolated from cells in panel A for Western blot analysis of TSPAN2; representative results are shown. C) Growing HCASMCs were transfected with siRNA to TSPAN2 (siTSPAN2) or the same amount of negative control siRNA (sicontrol). Cell proliferation analysis was performed as in panel A (left). Quantitative RT-PCR was performed to assess TSPAN2 knockdown efficiency (right). Values are means ± sd, and data are representative of 3 separate experiments (n = 3). D) HCASMCs were treated with siTSPAN2 or sicontrol as in panel C. Scratch wound was created, and cell migration was assessed by time-lapse microscopy. Representative images at 5 h after creation of the scratch wound are shown. E) Quantitative analysis of panel D. Migration index was defined as the percentage of the area covered by migrating cells to the original wound area (n = 6). *P < 0.05.
Figure 6.
Figure 6.
TSPAN2 is a direct transcriptional target for SRF/MYOCD. A) Schematic of truncated versions of TSPAN2 luciferase reporters. B, C) Indicated TSPAN2 reporters were transfected in 10T1/2 cells (B) or SKLMS cells (C) in the presence of either control pcDNA vector or MYOCD expression plasmid for 36 h before assessment of luciferase activity. Luciferase activity was normalized to the internal control reporter Renilla. MYOCD-dependent activation of the TSPAN2 promoter was defined as the fold increase to the pcDNA control group (set to 1). D) Schematic of the −1-kb WT reporter and its CArG mutant. E, F) Both reporters were transfected in SKLMS cells for MYOCD-mediated (E) or SRF-VP16–mediated (F) activation, as described in panel C. G) ChIP assays were carried out in growing MASMCs for analysis of SRF binding to the putative CArG box. Signals of amplified DNA were normalized to the input control. Relative enrichment of the CArG box–containing fragment was expressed as the fold increase to the IgG control (set to 1). Primers to a region close to Dhx32 without any predicted CArG box (NC) and primers to CArG1 in the intron1 (IC1) of mouse Cnn1 were used as negative and positive controls, respectively. EMSV, empty vector; NC, negative control; ns, not significant. Representative data are shown from 3 independent experiments. Values are means ± sd, and data are representative of at least 3 separate experiments. *P < 0.05, **P < 0.01.
Figure 7.
Figure 7.
TSPAN2 is a direct transcriptional target for TGF-β1/SMAD. A) HCASMCs were transfected with siRNA to SMAD4 (siSMAD4) for 24 h. Cells were then starved overnight, followed by treatment of TGF-β1 (4 ng/ml) for another 24 h before RNA was isolated for quantitative RT-PCR analysis of indicated genes. B) The −1-kb TSPAN2 WT luciferase reporter and –560-bp truncated version (with all 4 SBEs deleted), as depicted (top), were transfected in 10T1/2 cells. Cells were then starved overnight and stimulated by TGF-β1 (5 ng/ml) for 24 h before assessment of luciferase activity. TGF-β1 activation was defined as fold increase to the vehicle-treated control group (set to 1). Representative data from 3 separate experiments are expressed as the average of triplicates. C) Schematic of the truncated TSPAN2 luciferase reporters, as indicated (top). Luciferase activity of the indicated reporters in 10T1/2 cells treated with vehicle or TGF-β1, as described in panel B (bottom). D) ChIP assays were performed in starved HCASMCs or HCASMCs that were stimulated with TGF-β1 (5 ng/ml) for 5 h to examine the binding of SMAD2/3 to each individual putative SBE, denoted as SBE1, SBE2, SBE3, and SBE4. Semiquantitative PCR (left) and quantitative PCR (right) of the enrichment of each individual putative SBE-containing fragment is shown. Amplified DNA signal was normalized to the input control, and the relative enrichment of the individual SBE-containing fragment was expressed as fold increases to its IgG control (set to 1). ns, not significant. Values are means ± sd, and data are representative of 3 separate experiments. *P < 0.05.
Figure 8.
Figure 8.
SRF/MYOCD and TGF-β1/SMAD regulate TSPAN2 transcription in a parallel way. A) HCASMCs were transfected with siRNA to SRF (siSRF) for 24 h, and cells were starved overnight before treatment of TGF-β1 for another 24 h. RNA was subjected to quantitative RT-PCR analysis of indicated genes. B) Luciferase assays for indicated reporters were performed in 10T1/2 cells, followed by TGF-β1 treatment, as described above. C) Growing HCASMCs were transfected with siSRF for 48 h, followed by serum starvation overnight. Cells were then stimulated with TGF-β1 for 5 h before protein extraction for Western blot analysis of the indicated proteins. D) Growing HCASMCs were transfected with siRNA to SMAD4 (siSMAD4) for 24 h. Cells were then transduced with Ad-MYOCD or Ad-empty for 48 h before RNA was extracted for quantitative RT-PCR analysis of indicated genes. E, F) Indicated TSPAN2 reporters were cotransfected with either SRF-VP16 vs. vector control EMSV (E) or MYOCD vs. pcDNA vector control (F) in SKLMS cells, and luciferase activity was assessed, as described in Fig. 6. GAPDH, glyceraldehyde 3-phosphate dehydrogenase; ns, not significant. Values are means ± sd and data are representative of 3 separate experiments. EMSV, empty vector. *P < 0.05.

Similar articles

Cited by

References

    1. Thyberg J. (1998) Phenotypic modulation of smooth muscle cells during formation of neointimal thickenings following vascular injury. Histol. Histopathol. 13, 871–891 - PubMed
    1. Owens G. K., Kumar M. S., Wamhoff B. R. (2004) Molecular regulation of vascular smooth muscle cell differentiation in development and disease. Physiol. Rev. 84, 767–801 - PubMed
    1. Herring B. P., Hoggatt A. M., Burlak C., Offermanns S. (2014) Previously differentiated medial vascular smooth muscle cells contribute to neointima formation following vascular injury. Vasc. Cell 6, 21 - PMC - PubMed
    1. Pauletto P., Sarzani R., Rappelli A., Chiavegato A., Pessina A. C., Sartore S. (1994) Differentiation and growth of vascular smooth muscle cells in experimental hypertension. Am. J. Hypertens. 7, 661–674 - PubMed
    1. Bennett M. R., Sinha S., Owens G. K. (2016) Vascular smooth muscle cells in atherosclerosis. Circ. Res. 118, 692–702 - PMC - PubMed

Publication types

MeSH terms