

Dimethyl Fumarate Selectively Reduces Memory T Cells and Shifts the Balance between Th1/Th17 and Th2 in Multiple Sclerosis Patients
- PMID: 28258191
- PMCID: PMC5464403
- DOI: 10.4049/jimmunol.1601532
Dimethyl Fumarate Selectively Reduces Memory T Cells and Shifts the Balance between Th1/Th17 and Th2 in Multiple Sclerosis Patients
Abstract
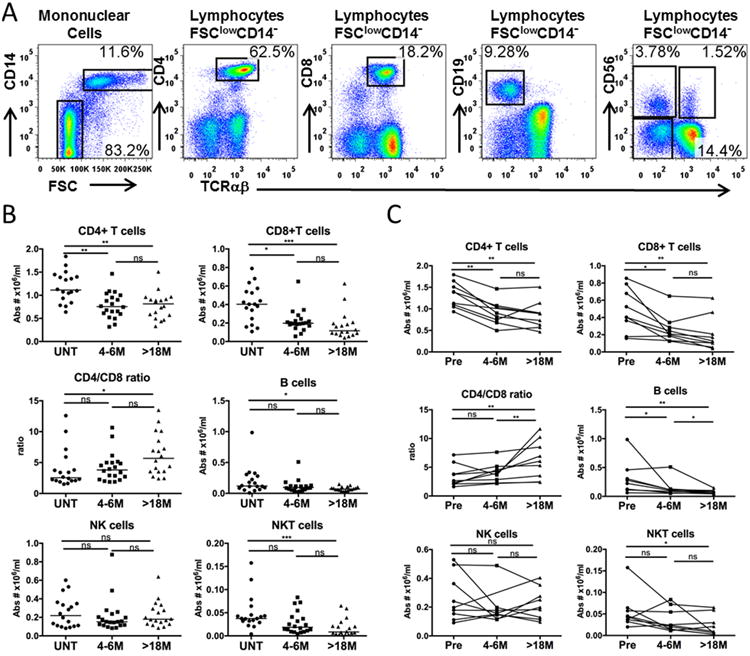
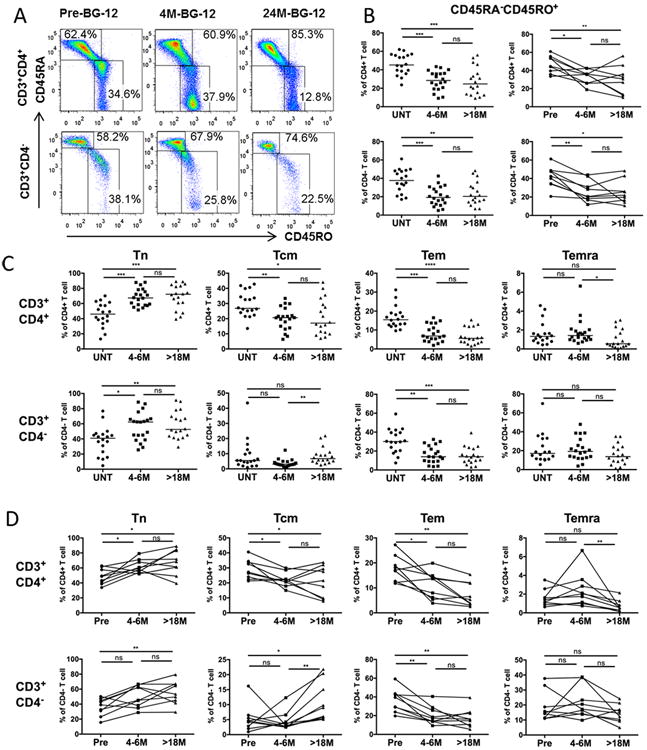
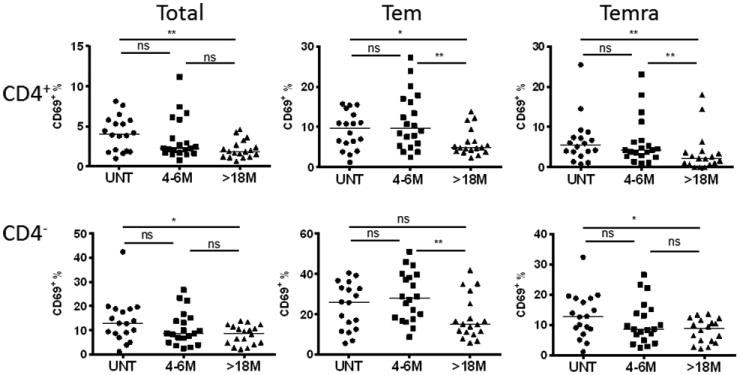
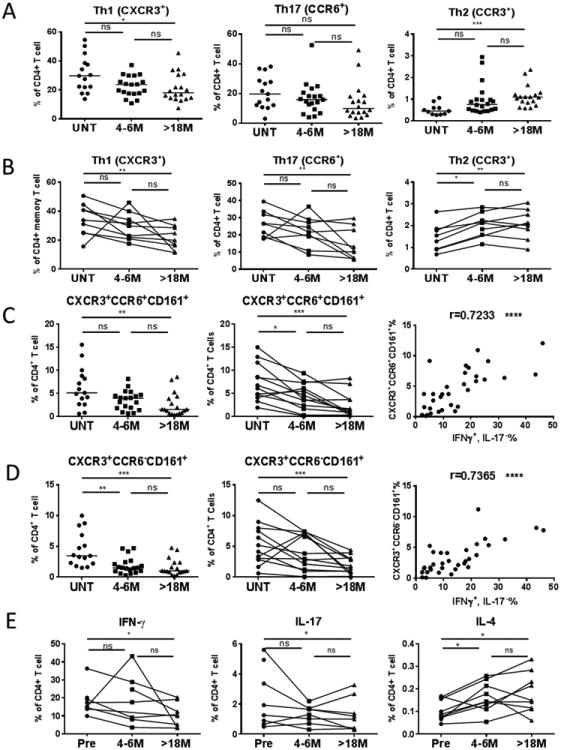
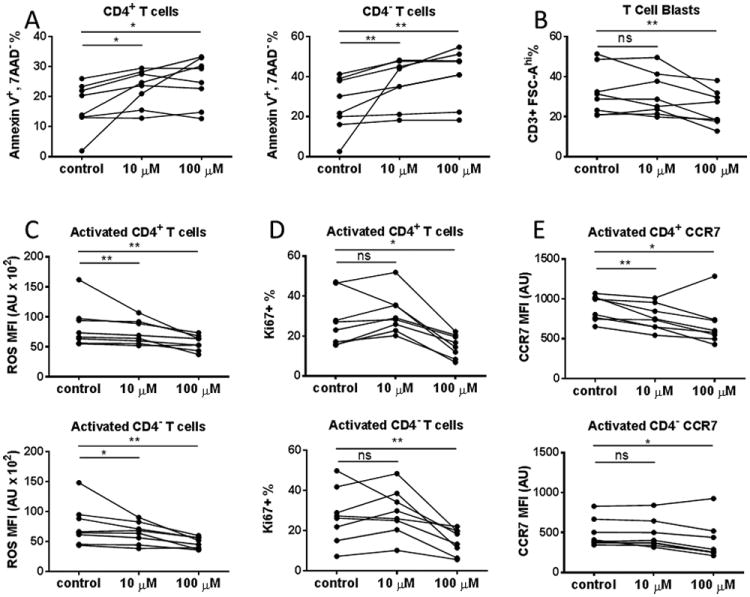
Dimethyl fumarate (DMF; trade name Tecfidera) is an oral formulation of the fumaric acid ester that is Food and Drug Administration approved for treatment of relapsing-remitting multiple sclerosis. To better understand the therapeutic effects of Tecfidera and its rare side effect of progressive multifocal leukoencephalopathy, we conducted cross-sectional and longitudinal studies by immunophenotyping cells from peripheral blood (particularly T lymphocytes) derived from untreated and 4-6 and 18-26 mo Tecfidera-treated stable relapsing-remitting multiple sclerosis patients using multiparametric flow cytometry. The absolute numbers of CD4 and CD8 T cells were significantly decreased and the CD4/CD8 ratio was increased with DMF treatment. The proportions of both effector memory T cells and central memory T cells were reduced, whereas naive T cells increased in treated patients. T cell activation was reduced with DMF treatment, especially among effector memory T cells and effector memory RA T cells. Th subsets Th1 (CXCR3+), Th17 (CCR6+), and particularly those expressing both CXCR3 and CD161 were reduced most significantly, whereas the anti-inflammatory Th2 subset (CCR3+) was increased after DMF treatment. A corresponding increase in IL-4 and decrease in IFN-γ and IL-17-expressing CD4+ T cells were observed in DMF-treated patients. DMF in vitro treatment also led to increased T cell apoptosis and decreased activation, proliferation, reactive oxygen species, and CCR7 expression. Our results suggest that DMF acts on specific memory and effector T cell subsets by limiting their survival, proliferation, activation, and cytokine production. Monitoring these subsets could help to evaluate the efficacy and safety of DMF treatment.
Copyright © 2017 by The American Association of Immunologists, Inc.
Figures
Similar articles
-
Relapsing-Remitting Multiple Sclerosis Is Characterized by a T Follicular Cell Pro-Inflammatory Shift, Reverted by Dimethyl Fumarate Treatment.Front Immunol. 2018 May 29;9:1097. doi: 10.3389/fimmu.2018.01097. eCollection 2018. Front Immunol. 2018. PMID: 29896193 Free PMC article.
-
Dimethyl fumarate selectively reduces memory T cells in multiple sclerosis patients.Mult Scler. 2016 Jul;22(8):1061-1070. doi: 10.1177/1352458515608961. Epub 2015 Oct 12. Mult Scler. 2016. PMID: 26459150 Free PMC article.
-
Dimethyl fumarate induces changes in B- and T-lymphocyte function independent of the effects on absolute lymphocyte count.Mult Scler. 2018 May;24(6):728-738. doi: 10.1177/1352458517707069. Epub 2017 May 8. Mult Scler. 2018. PMID: 28480794 Free PMC article.
-
[Dimethyl fumarate (tecfidera) is the first line treatment choice in patients with remitting multiple sclerosis].Zh Nevrol Psikhiatr Im S S Korsakova. 2017;117(11):140-145. doi: 10.17116/jnevro2017117111140-145. Zh Nevrol Psikhiatr Im S S Korsakova. 2017. PMID: 29265100 Review. Russian.
-
Insight into the mechanism of action of dimethyl fumarate in multiple sclerosis.J Mol Med (Berl). 2019 Apr;97(4):463-472. doi: 10.1007/s00109-019-01761-5. Epub 2019 Feb 28. J Mol Med (Berl). 2019. PMID: 30820593 Review.
Cited by
-
Comparative Efficacy and Safety of Ozanimod and Dimethyl Fumarate for Relapsing-Remitting Multiple Sclerosis Using Matching-Adjusted Indirect Comparison.CNS Drugs. 2021 Jul;35(7):795-804. doi: 10.1007/s40263-021-00805-0. Epub 2021 Apr 13. CNS Drugs. 2021. PMID: 33847901 Free PMC article.
-
Increased NK Cell Count in Multiple Sclerosis Patients Treated With Dimethyl Fumarate: A 2-Year Longitudinal Study.Front Immunol. 2019 Jul 19;10:1666. doi: 10.3389/fimmu.2019.01666. eCollection 2019. Front Immunol. 2019. PMID: 31379857 Free PMC article.
-
Dimethyl fumarate-related immune and transcriptional signature is associated with clinical response in multiple sclerosis-treated patients.Front Immunol. 2023 Jul 7;14:1209923. doi: 10.3389/fimmu.2023.1209923. eCollection 2023. Front Immunol. 2023. PMID: 37483622 Free PMC article.
-
Multiple Sclerosis: Mechanisms of Disease and Strategies for Myelin and Axonal Repair.Neurol Clin. 2018 Feb;36(1):1-11. doi: 10.1016/j.ncl.2017.08.002. Neurol Clin. 2018. PMID: 29157392 Free PMC article. Review.
-
Environmental pollutants and the immune response.Nat Immunol. 2020 Dec;21(12):1486-1495. doi: 10.1038/s41590-020-0802-6. Epub 2020 Oct 12. Nat Immunol. 2020. PMID: 33046888 Review.
References
-
- Stadelmann C, Brück W. Interplay between mechanisms of damage and repair in multiple sclerosis. Journal of neurology. 2008;255:12–18. - PubMed
-
- Geginat J, Lanzavecchia A, Sallusto F. Proliferation and differentiation potential of human CD8+ memory T-cell subsets in response to antigen or homeostatic cytokines. Blood. 2003;101:4260–4266. - PubMed
-
- Teixeira AM, Rama L, Carvalho HM, Borges G, Carvalheiro T, Gleeson M, Alves F, Trindade H, Paiva A. Changes in naive and memory T-cells in elite swimmers during a winter training season. Brain, behavior, and immunity. 2014;39:186–193. - PubMed
-
- Lyck R, Engelhardt B. Going against the tide–how encephalitogenic T cells breach the blood-brain barrier. Journal of vascular research. 2012;49:497–509. - PubMed
-
- Sallusto F, Geginat J, Lanzavecchia A. Central memory and effector memory T cell subsets: function, generation, and maintenance. Annu Rev Immunol. 2004;22:745–763. - PubMed
Publication types
MeSH terms
Substances
Grants and funding
LinkOut - more resources
Full Text Sources
Other Literature Sources
Research Materials
