. 2017 Apr 15;198(8):3326-3335.
doi: 10.4049/jimmunol.1601864. Epub 2017 Mar 3.

Structural Implications for the Formation and Function of the Complement Effector Protein iC3b

Affiliations

Structural Implications for the Formation and Function of the Complement Effector Protein iC3b

Malvina Papanastasiou et al. J Immunol. .

Abstract

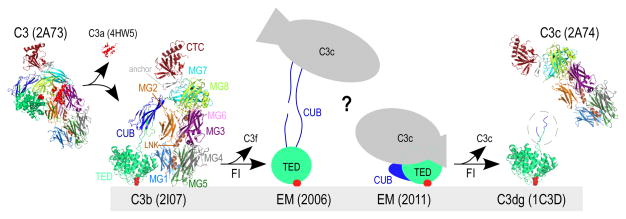
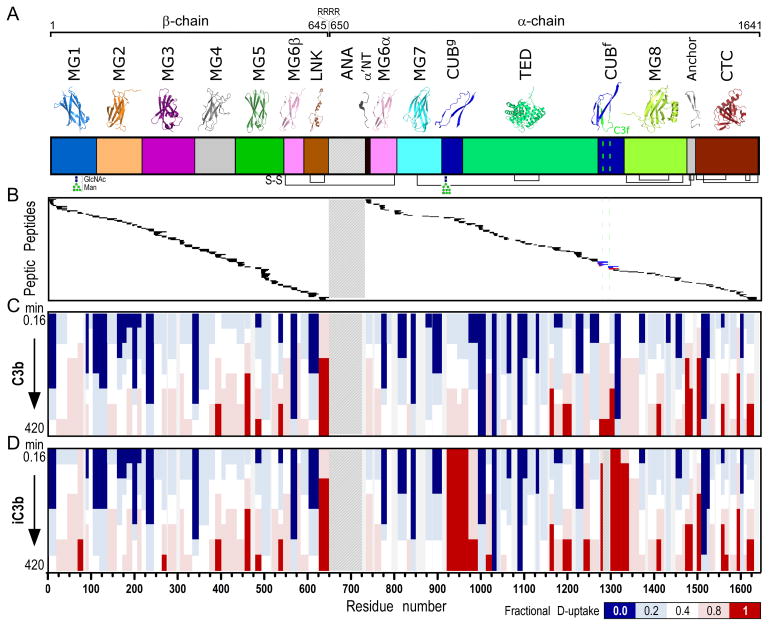
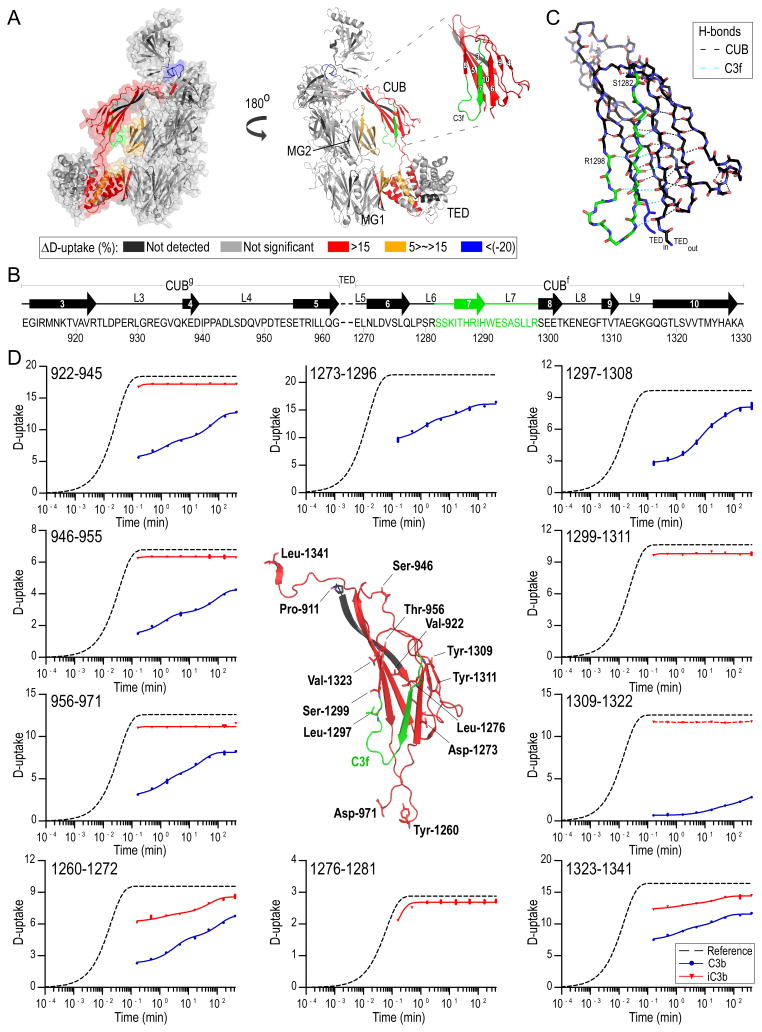
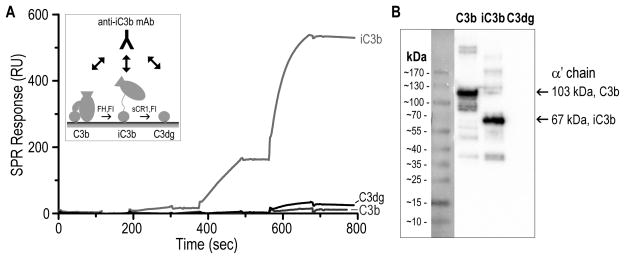
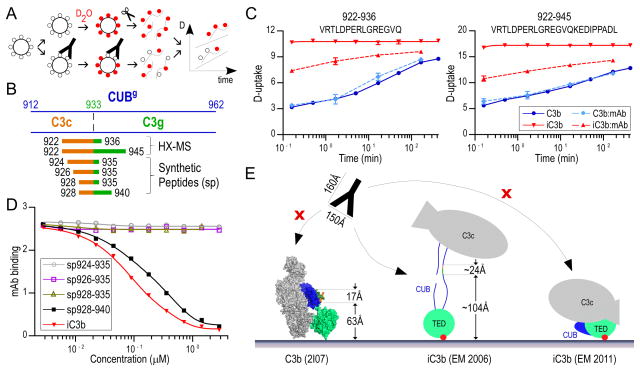
Complement-mediated opsonization, phagocytosis, and immune stimulation are critical processes in host defense and homeostasis, with the complement activation fragment iC3b playing a key effector role. To date, however, there is no high-resolution structure of iC3b, and some aspects of its structure-activity profile remain controversial. Here, we employed hydrogen-deuterium exchange mass spectrometry to describe the structure and dynamics of iC3b at a peptide resolution level in direct comparison with its parent protein C3b. In our hydrogen-deuterium exchange mass spectrometry study, 264 peptides were analyzed for their deuterium content, providing almost complete sequence coverage for this 173-kDa protein. Several peptides in iC3b showed significantly higher deuterium uptake when compared with C3b, revealing more dynamic, solvent-exposed regions. Most of them resided in the CUB domain, which contains the heptadecapeptide C3f that is liberated during the conversion of C3b to iC3b. Our data suggest a highly disordered CUB, which has acquired a state similar to that of intrinsically disordered proteins, resulting in a predominant form of iC3b that features high structural flexibility. The structure was further validated using an anti-iC3b mAb that was shown to target an epitope in the CUB region. The information obtained in this work allows us to elucidate determinants of iC3b specificity and activity and provide functional insights into the protein's recognition pattern with respect to regulators and receptors of the complement system.


Conflict of interest statement

Conflict of Interest Statement

The authors state no conflict of interest.

Figures

Figure 1
Figure 1. Structures of complement component C3 and activated products
A simplified schematic of C3-mediated opsonization is shown. Transformation of inert C3 [PDB: 2A73 (2)] through cleavage by C3 convertases leads to the release of C3a [anaphylatoxin domain, PDB: 4HW5 (44)] and hydrolysis of the thioester bond (indicated with red circles). The product of this transformation is termed C3b [PDB: 2I07 (4)] and possesses marked conformational differences from its precursor molecule. C3b molecules close to cell surfaces attach via the activated thioester bond and tag them for opsonization. Sequential cleavages of C3b by FI yield iC3b, for which two controversial EM structures have been reported to date (depicted with cartoons drawn based on (16, 17)). Further cleavage of iC3b by FI yields two end products, surface-bound C3dg (the C3g sequence not crystallized in C3d is encircled, PDB: 1C3D (8)) and fluid-phase C3c (PDB: 2A74 (2)). Domain color annotation follows that in Janssen et al (2); PDB entries are shown in brackets.
Figure 2
Figure 2. H-to-D exchange protection and heat map of C3b and iC3b
A. Domain organization of C3 and its activation products (color annotation follows (2)). Ribbon representations of individual domains are shown at the top. C3b is generated upon proteolytic removal of the ANA domain (shown with a crosshatch fill pattern). β- (residues 1–645) and α-chains (residues 650–1641) are covalently linked through a disulfide bond formed between MG6 domain residues Cys537-Cys794. Further release of the heptadecapeptide C3f in the CUBf domain leads to the formation of iC3b (cleavage sites are indicated with a green dashed line). Inter- and intra-domain disulfide bonds are shown at panel bottom with black connecting lines. B. Peptic peptides of C3b and iC3b identified and analyzed for D-content. These correspond to residue numbers as indicated in the x-axis of Fig. 2D. For a detailed view of individual peptides identified and respective peptide boundaries, please refer to Fig. S1. Common peptides identified for both C3b and iC3b are indicated with black. Unique peptides of C3b (indicated with blue) and iC3b (indicated with red) were identified in the C3f-surrounding region. C, D. Heat maps of the exchange observed on the peptide level for C3b and iC3b, respectively. Color-coding is based on the fractional deuterium uptake calculated by normalizing deuterium uptake values to respective values from fully deuterated samples; each value is the average of two replicate experiments. Values for different time points of exchange are depicted; these are 0.16, 0.5, 1.7, 5, 16.7, 50, 166.7 and 420 min (from top to bottom). For simplicity, only non-overlapping peptides are shown.
Figure 3
Figure 3. Differential D-uptake between C3b and iC3b
A. Mapping of HX differences between C3b and iC3b on C3b structure; peptides with ΔD-uptake>5% are mapped on C3b [PDB: 2I07 (4), Table S1]. More exposed regions in iC3b than C3b against D-exchange are colored red, and less exposed are blue. CUB with respective fibronectin type-3 strand numbering is shown in the inset. Prominent differences in the D-exchange are detected for peptides in CUB, whereas marginal but still significant differences are detected on the interface between CUB-TED and the MG core as well as on CUB-TED inter-domain peptides. iC3b is shown to acquire a more dynamic and solvent-exposed conformation. An exception is the 1471–1480 peptide positioned between MG8 and CTC, indicating re-positioning of CTC toward the MG7/MG8 domains. B. Structural organization of the CUB domain; strand numbering follows Fig. 3A. CUBg, TED and CUBf boundaries are depicted. Loops (L) and disordered segments are marked with a solid line. C. Detailed view of the CUB structure. C3f is featured in green, and amino acids denoting the beginning and the end of the peptide are labeled. H-bonds between backbone amide hydrogens and carbonyls are depicted with black dashed lines, and those involving C3f residues with cyan; C3f participates in 9 main-chain hydrogen bonds. D. D-uptake plots of selected CUB domain peptides for C3b (blue) and iC3b (red) (for a complete list of plots, see Fig. S1). For each sequence, a reference curve (for the case of no protection) is calculated and fit to a stretched exponential equation (33). Experimental data points are similarly fit using the same β-factor calculated for the respective reference curves. Amino acids denoting the beginning of measured peptides are labeled, and their main- and side-chains are depicted with sticks. Unique peptides for C3b entailing a part (1297–1308) or the full sequence (1273–1296) of C3f are shown. Unique iC3b peptides containing the newly formed C-terminus (1276–1281) and N-terminus (1299–1311) generated upon cleavage of C3f are depicted. A curve could not be fit for peptide 1309–1322 in iC3b (indicated with a connecting red dashed line).
Figure 4
Figure 4. Binding specificity of anti-iC3b mAb for C3-derived opsonins
A. For evaluating the specificity of the anti-iC3b mAb towards surface-bound opsonins, C3b was captured on a SPR sensor chip in physiological orientation via its thioester moiety. Individual C3b surfaces were converted to iC3b and C3dg with factor I (FI) and cofactors FH and sCR1, respectively (45) (insert). A titration experiment was performed on the C3b, iC3b and C3dg surfaces using consecutive injections of increasing anti-iC3b mAb concentrations (0.01–10 μg/ml). Anti-iC3b mAb showed a significant binding affinity for iC3b when compared to C3b and C3dg. The residual binding to C3dg that was observed was most likely due to iC3b residues present on the C3dg surface. B. Purified C3b, iC3b and C3dg were subjected to gel electrophoresis under reducing and denaturing conditions. Under reducing conditions, C3b produces two individual bands corresponding to the αβ- and β-chains, connected via a disulfide bond. Proteins were subsequently analyzed by western blotting using the anti-iC3b mAb. Intense bands detected for C3b and iC3b correspond to the α′-chains of the proteins (103 kDa for C3b and 67 kDa for iC3b, produced upon cleavage of C3f). C3dg did not show any detectable interaction with the anti-iC3b mAb.
Figure 5
Figure 5. Validation of neo-epitopes on iC3b using an anti-iC3b mAb
A. HX-MS workflow for the analysis of C3b and iC3b with and without anti-iC3b mAb. Protein molecules are shown as large circles, water and deuterated water molecules as small black and red circles, respectively, and mAb as a Y-shape cartoon. Incubation of the proteins with the anti-iC3b mAb is expected to protect the epitope-bearing region, resulting in less D-uptake. B. CUBg domain boundaries and peptides bearing the epitope region. The N-terminal of C3g is indicated with a dashed line. Peptides detected by HX-MS to have lower deuterium content in iC3b:anti-iC3b mAb, and synthesized peptides are indicated as linear stretches; these span the C3c/C3g fragments, and respective parts of their sequences are colored accordingly. C. D-uptake plots of two peptides (922–936 and 922–945) that were found to be more protected in iC3b in the presence of the mAb; their profile was unaffected in C3b:anti-iC3b mAb. D. Competition ELISA using anti-iC3b mAb and synthesized peptides. Anti-iC3b mAb was mixed with increasing concentrations of synthesized peptides or purified iC3b (reference), and the mixtures were transferred to wells of an ELISA plate coated with iC3b. A decrease in signal indicates ligand binding to the mAb, preventing an interaction of the mAb with coated iC3b. E. Schematic of anti-iC3b mAb interactions with opsonins C3b and iC3b. The epitope-bearing region (928–940) as defined by HX-MS and ELISA experiments is depicted on the C3b crystal structure [PDB: 2I07 (4)]. This partially structured region in C3b and steric hindrance provided by the structure itself and the surface prevent C3b:anti-iC3b mAb interactions and constitute the antibody specific for iC3b. The anti-iC3b mAb (“mAb” in the figure) has been drawn in ~1:2.5 scale; typical dimensions are depicted. The CUB and TED domains are featured in blue and lime green, respectively, C3c and C3g segments in orange and green, and the thioester bond in red.
Figure 6
Figure 6. Differential accessibility of Efb-C binding sites in C3b and iC3b
A. Crystal structure of C3d:Efb-C (N138A mutant; PDB 3D5R; (27)) with C3d in green and Efb-C in red on the left and a model in which the TED domain of C3b (blue; PDB 2I07; (4)) is aligned with C3d. The insert shows the steric clash of Efb-C with the MG1 domain of C3b (highlighted in cyan). B. In agreement with the hypothesis of a disordered and more flexible CUB domain in iC3b, Efb-C binds more strongly to surface-immobilized iC3b than to C3b, as determined by SPR. In the semi-quantitative experiment, thioester-biotinylated C3b was captured on a streptavidin-coated sensor chip and a titration was performed with Efb-C (3–100 nM) before and after conversion of one C3b surface to iC3b to demonstrate that the observed increase in activity was indeed due to the iC3b transformation with loss of steric restriction around the Efb-C binding site. C. In order to quantitate the differential interaction profile, a kinetic titration was performed on the C3b and iC3b surfaces using consecutive injections of Efb-C at increasing concentration (6–100 nM), and the resulting SPR curves (black) were fitted to a Langmuir 1:1 binding model (red lines) to determine kinetic rate constants and binding affinity (table on the right). iC3b showed a >20-fold higher affinity for Efb-C when compared to C3b, caused by a ~5-fold higher association rate and a ~4-fold slower dissociation rate. Of note, a single amino acid mutant of Efb-C (i.e., N138A) that shares the same binding mode as wildtype Efb-C but features lower complex stability (KD of 19.8 vs. 1.5 nM; (27)) was used to facilitate the experiment and avoid harsh regeneration conditions.

References

    1. Ricklin D, Hajishengallis G, Yang K, Lambris JD. Complement: a key system for immune surveillance and homeostasis. Nat Immunol. 2010;11:785–797. - PMC - PubMed
    1. Janssen BJC, Huizinga EG, Raaijmakers HCA, Roos A, Daha MR, Nilsson-Ekdahl K, Nilsson B, Gros P. Structures of complement component C3 provide insights into the function and evolution of immunity. Nature. 2005;437:505–511. - PubMed
    1. Ricklin D, Reis ES, Mastellos DC, Gros P, Lambris JD. Complement component C3 – The “Swiss Army Knife” of innate immunity and host defense. Immunol Rev. 2016;274:33–58. - PMC - PubMed
    1. Janssen BJC, Christodoulidou A, McCarthy A, Lambris JD, Gros P. Structure of C3b reveals conformational changes that underlie complement activity. Nature. 2006;444:213–216. - PubMed
    1. Roozendaal R, Carroll MC. Complement receptors CD21 and CD35 in humoral immunity. Immunol Rev. 2007;219:157–166. - PubMed

Publication types

LinkOut - more resources