. 2017 Apr 15;198(8):3149-3156.
doi: 10.4049/jimmunol.1602009. Epub 2017 Mar 3.

Downregulation of E Protein Activity Augments an ILC2 Differentiation Program in the Thymus

Affiliations

Downregulation of E Protein Activity Augments an ILC2 Differentiation Program in the Thymus

Hong-Cheng Wang et al. J Immunol. .

Abstract

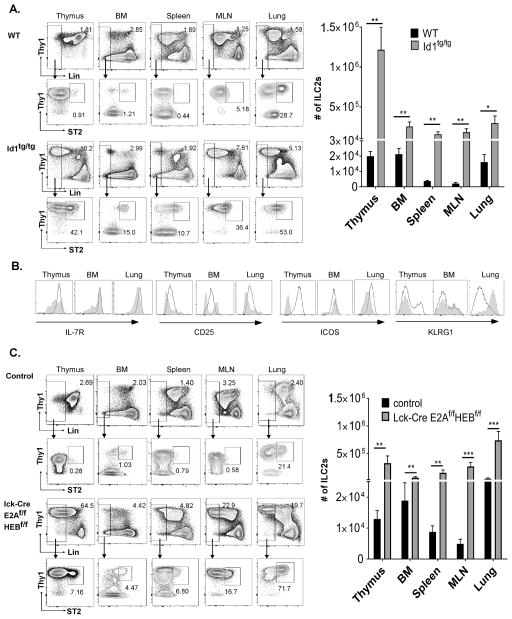
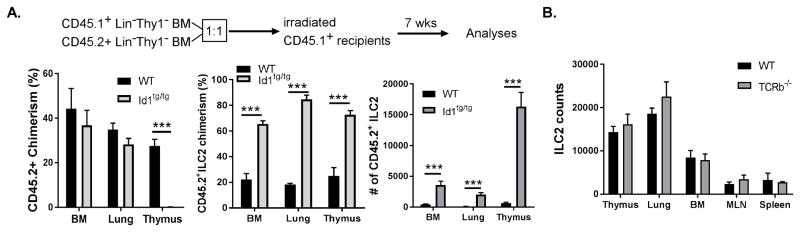
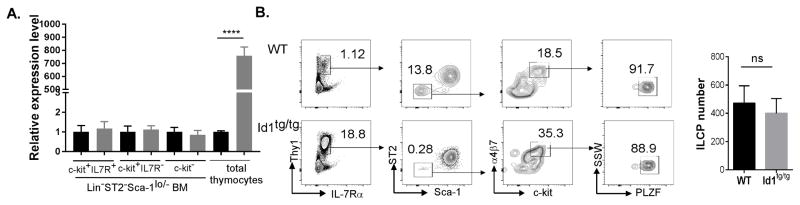
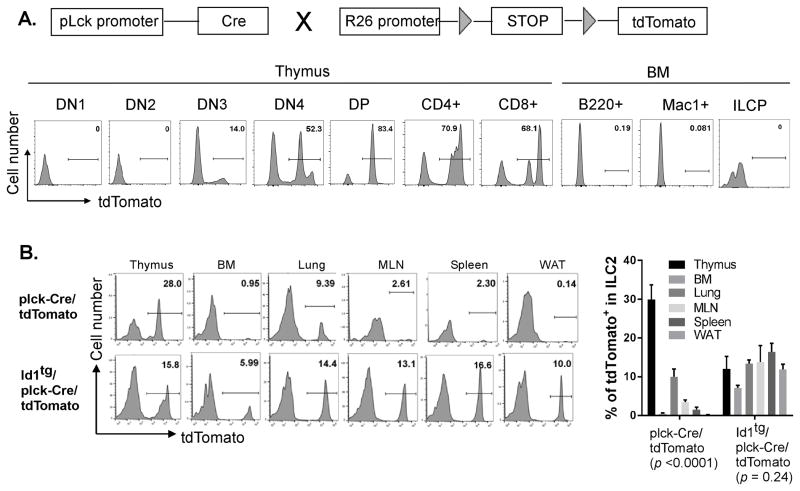
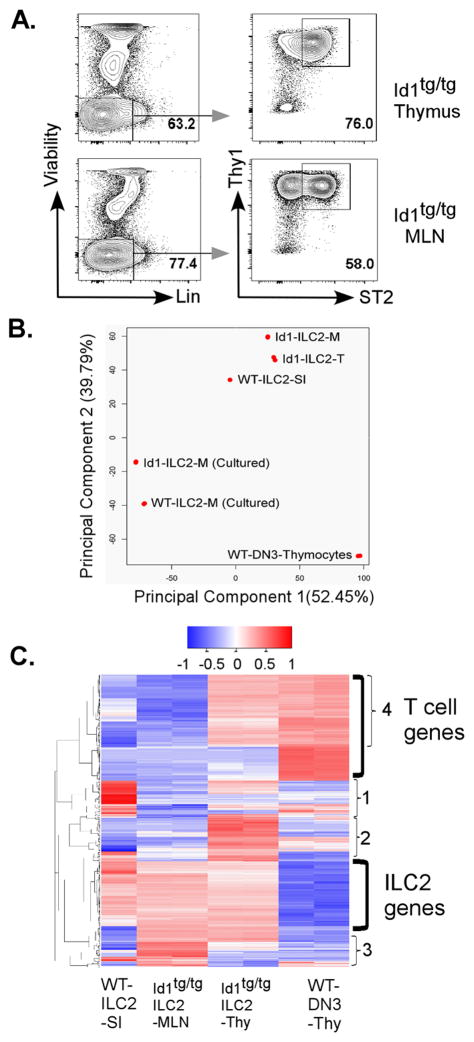
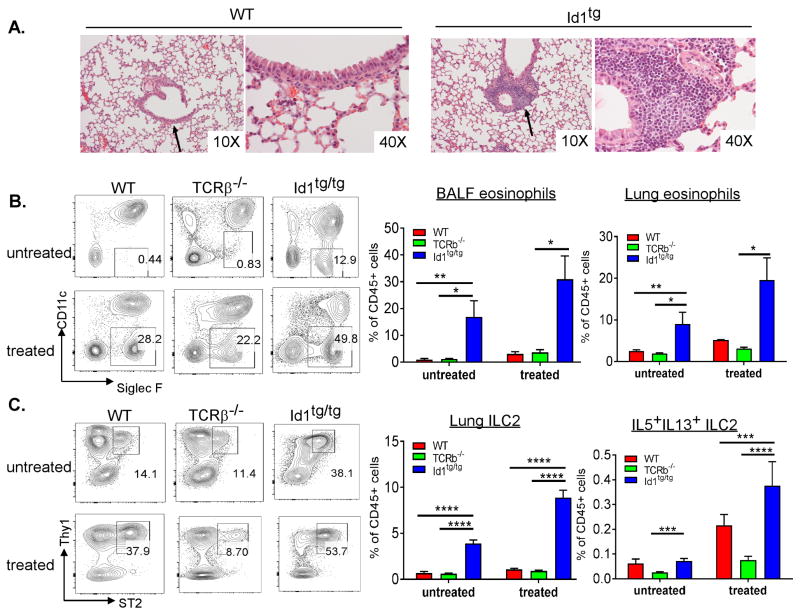
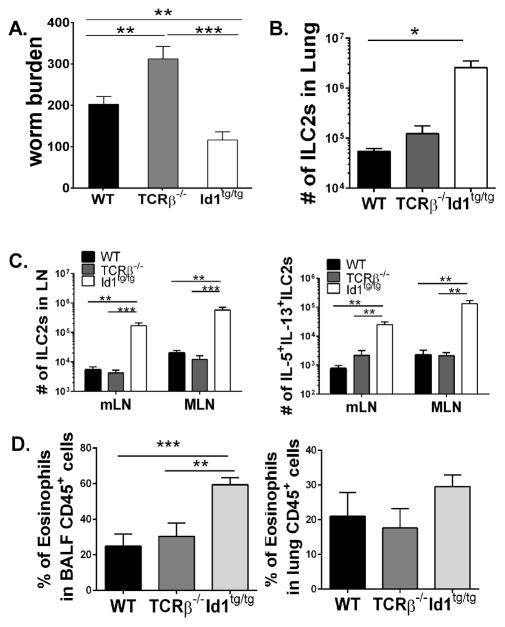
Innate lymphoid cells (ILCs) are important regulators in various immune responses. The current paradigm states that all newly made ILCs originate from common lymphoid progenitors in the bone marrow. Id2, an inhibitor of E protein transcription factors, is indispensable for ILC differentiation. Unexpectedly, we found that ectopically expressing Id1 or deleting two E protein genes in the thymus drastically increased ILC2 counts in the thymus and other organs where ILC2 normally reside. Further evidence suggests a thymic origin of these mutant ILC2s. The mutant mice exhibit augmented spontaneous infiltration of eosinophils and heightened responses to papain in the lung and increased ability to expulse the helminth parasite, Nippostrongylus brasiliensis These results prompt the questions of whether the thymus naturally has the capacity to produce ILC2s and whether E proteins restrain such a potential. The abundance of ILC2s in Id1 transgenic mice also offers a unique opportunity for testing the biological functions of ILC2s.


Figures

Figure 1
Figure 1. Down-regulation of E protein function augments ILC2 production
(A) Analyses of Lin cells from C57BL/6J (WT) and Id1tg/tg mice. Cells from indicated tissues of mice of indicated genotypes were stained for lineage markers (FcεR, B220, CD19, Mac-1, Gr-1, CD11c, NK1.1, Ter-119, CD3, CD8α, TCRβ and γδTCR) together with antibodies against Thy1 and ST2. The lineage negative gates and expression profiles of Thy1 and ST2 on Lin cells are presented. The percentage of ILC2s defined as LinThy1+ST2+ is shown. Bar graphs show average cell numbers in each tissue (n=4–9). (B) Additional analyses for the indicated markers on ILC2s defined as in (A). Shaded peaks represent the profiles of WT ILC2s in indicated tissues and the solid lines depict those of Id1tg/tg ILC2s. (C) Analyses of Lin cells from plck-Cre/E2Af/f;HEBf/f and littermate controls without plck-Cre as described for (A) (n=6–8). Bar graphs show data pooled from five (A) or three (C) independent experiments. Error bars are SEM. Student’s t test was used for statistical analyses. * p< 0.05; ** p< 0.01 and *** p < 0.001.
Figure 2
Figure 2. Augmented ILC2 production in Id1 transgenic mice is cell intrinsic
(A) Mixed bone marrow chimera. LinThy1 BM cells of C57BL/6 (CD45.2+) or Id1 transgenic (CD45.2+) mice were mixed with the same cells from CD45.1+ B6 mice at 1:1 ratio and transplanted into lethally irradiated CD45.1+ B6 mice (5 per cohort). Total CD45+ and ILC2 cells in indicated organs were analyzed 7 weeks after transplantation. Chimerism was defined as percent of CD45.2+ fractions of CD45.1+ plus CD45.2+ cells. The numbers of CD45.2+ILC2s are shown on the right. Error bars are SEM. Data shown is a representative of three independent experiments. (B) Comparison of ILC2 counts in WT and TCRβ−/− mice. ILC2s were defined as described in the legend for Fig. 1 except that anti-CD5 was also included in the lineage cocktail. Student’s t test was used for statistical analyses.
Figure 3
Figure 3. The frequency of ILC progenitors was not affected by thymus-specific expression of the Id1 transgene
(A) The Id1 transgene was specifically expressed in transgenic thymocytes. Total Id1 mRNA levels in thymocytes and bone marrow cells of WT and Id1tg mice were determined using qRT-PCR and normalized against the levels of β-actin. Bone marrow cells of WT and Id1tg/tg mice were fractionated by first enriching for LinSca-1lo/−ST2 cells and then dividing the resulting population into c-kit+IL-7Rα+, c-kit+IL-7Rα and c-kit subsets. The c-kit+ fractions include both c-kithi and c-kitint cells. The normalized Id1 levels relative to the WT fractions are shown. (B) Similar numbers of bone marrow ILC progenitors (LinThy1+IL7Rα+ ST2Sca-1α4β7+PLZF+) were found in WT and Id1tg/tg mice. Gating strategy was shown on the left and the average ILCP number was shown on the right (n=3). Data shown are representative of at least two independent experiments. Student’s t test was used for statistical analyses.
Figure 4
Figure 4. Lineage tracing data suggest the thymic origin of Id1 transgenic ILC2s
(A) The Cre transgene is driven by the proximal promoter of the lck gene in plck-Cre mice, which were crossed with ROSA26-STOP-tdTomato reporter mice. Percentages of tdTomato+ cells in subsets of thymocytes and B220+ or Mac-1+ bone marrow cells as well as ILCP are shown. CD4, CD8, CD19, B220, Mac-1, Gr1, FcγR, Ter119, NK1.1, and TCRγδ negative thymocytes were further defined by c-kit and CD25 expression in DN populations: DN1 (C-kit+CD25), DN2 (C-kit+CD25+), DN3 (C-kitCD25+) and DN4 (C-kitCD25). (B) Analyses of tdTomato expression in ILC2s in mice of indicated genotypes. To ensure the elimination of any potential contamination of T lineage cells, ILC2s were defined as in Fig. 2B except that the Lin population was further gated for TCRβTCRγδ based on staining with antibodies against these TCRs conjugated with different fluorophores from that used for lineage staining, and analyzed for Thy1 and ST2. It is noted that the fluorescence intensity in WT thymic ILC2s was reproducibly lower than their Id1tg counterparts. Bar graph shows the average percentage of tdTomato+ cells in the ILC2 population of pooled data from several experiments (n= 3–10). One–way ANOVA was used to determine the statistical significance of the variations of tdTomato levels in different tissues in each strain.
Figure 5
Figure 5. Id1 transgenic ILC2s have overlapping and distinct trancriptomes from WT ILC2s
(A) Representative sorting data for ILC2s from the thymus and MLN of Id1tg/tg mice. For each sort, single cell preparations from three mice were depleted with antibodies against CD3, B220, Mac1, Ter119 and NK1.1. The unbound cells were stained and gated as indicated. Approximately 300,000 ILC2s were obtained from each sort. (B) Principal component analyses. RNA-seq analyses of Id1tg/tg ILC2s from the thymus (T) and mesenteric lymph nodes (M) compared to WT ILC2 from small intestine (SI) and CD4CD8CD44CD25+ thymocytes (DN3). Data of MLN ILC2 cells cultured in vitro for 7 days were also included for both WT and Td1tg/tg mice. (C) Hierarchical clustering and heat map of top 500 PCA genes. The log2 of gene-level read counts were centered on the mean and normalized.
Figure 6
Figure 6. Id1 transgenic mice exhibit spontaneous inflammation and hyper response to allergen
(A) H&E staining of lung sections of 2-month old WT and Id1tg/tg lungs. Areas with higher magnification are pointed by arrows. Representative graphs from two mice of each genotype are shown. (B) Eosinophil infiltration in mice of indicated genotypes following intra-nasal exposure to papain or in untreated controls. Eosinophil gates in total BALF were shown on the left, percent of eosinophils in total CD45+ cells of BALF and lungs of untreated and treated mice were shown on the right (n=3–6). (C) Lung ILC2s in the same mice as (B). CD45+Lin cells were analyzed for Thy1 and ST2 expression and ILC2s are gated as shown. Percent of lung ILC2s and IL5+IL13+ILC2s of total CD45+ cells were shown on the right. Error bars are SEM. Student’s t test was used for statistical analyses. * p< 0.05; and *** p < 0.001. Data shown are representative of 2–3 experiments.
Figure 7
Figure 7. Augmented helminth expulsion by Id1 transgenic mice
Mice of indicated genotypes were inoculated subcutaneously with 500 third-stage N. brasiliensis larvae. Six days later mice were analyzed. (A) Worm counts in the small intestine (n=5–9). (B). ILC2 cells in the lung. (C) ILC2 cells in mediastinal (mLN) and mesenteric lymph nodes (MLN). (D) Percent of Eosinophils in the CD45+ fraction in the BALF and lung. * < 0.05; **, p < 0.01 and *** p < 0.001. Error bars are SEM. Data shown are representative of at least 3 experiments.

References

    1. Artis D, Spits H. The biology of innate lymphoid cells. Nature. 2015;517:293–301. - PubMed
    1. Eberl G, Colonna M, Di Santo JP, McKenzie AN. Innate lymphoid cells. Innate lymphoid cells: a new paradigm in immunology. Science. 2015;348:aaa6566. - PMC - PubMed
    1. Kondo M, I, Weissman L, Akashi K. Identification of clonogenic common lymphoid progenitors in mouse bone marrow. Cell. 1997;91:661–672. - PubMed
    1. Yu X, Wang Y, Deng M, Li Y, Ruhn KA, Zhang CC, Hooper LV. The basic leucine zipper transcription factor NFIL3 directs the development of a common innate lymphoid cell precursor. Elife. 2014:3. - PMC - PubMed
    1. Yang Q, Li F, Harly C, Xing S, Ye L, Xia X, Wang H, Wang X, Yu S, Zhou X, Cam M, Xue HH, Bhandoola A. TCF-1 upregulation identifies early innate lymphoid progenitors in the bone marrow. Nat Immunol. 2015;16:1044–1050. - PMC - PubMed

Publication types

Substances