. 2017 Apr 1;198(7):2772-2784.
doi: 10.4049/jimmunol.1600310. Epub 2017 Mar 3.

Novel Adjuvant Based on the Pore-Forming Protein Sticholysin II Encapsulated into Liposomes Effectively Enhances the Antigen-Specific CTL-Mediated Immune Response

Affiliations

Novel Adjuvant Based on the Pore-Forming Protein Sticholysin II Encapsulated into Liposomes Effectively Enhances the Antigen-Specific CTL-Mediated Immune Response

Rady J Laborde et al. J Immunol. .

Abstract

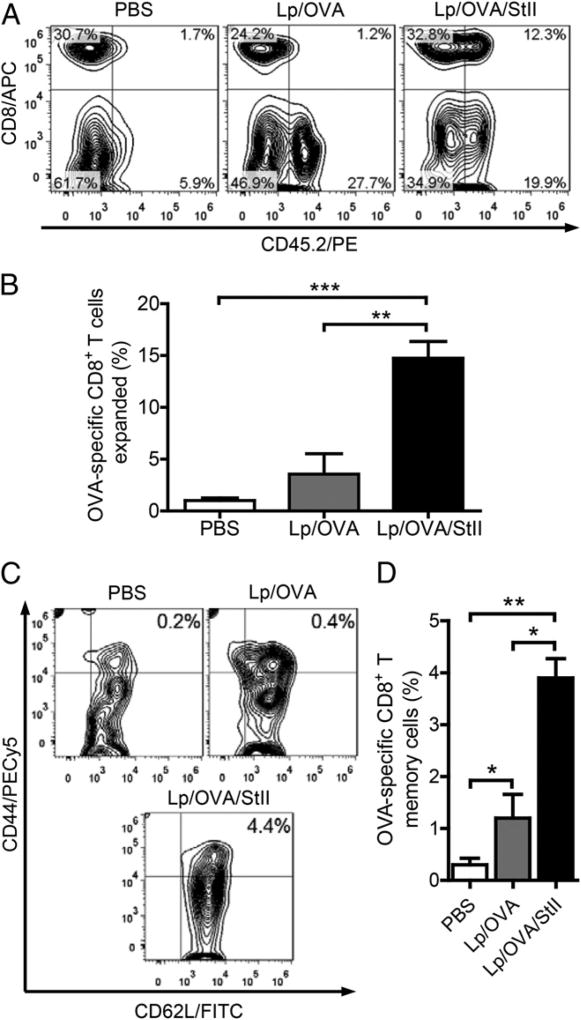
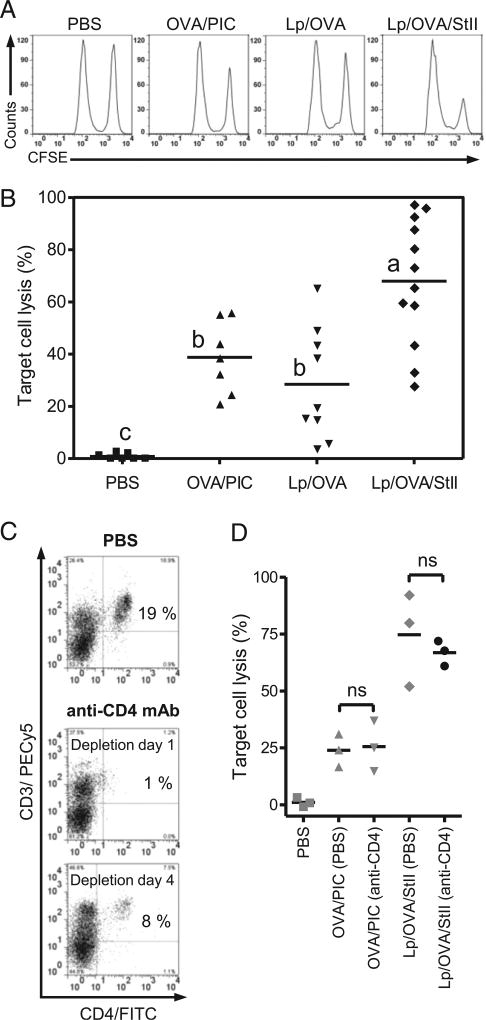
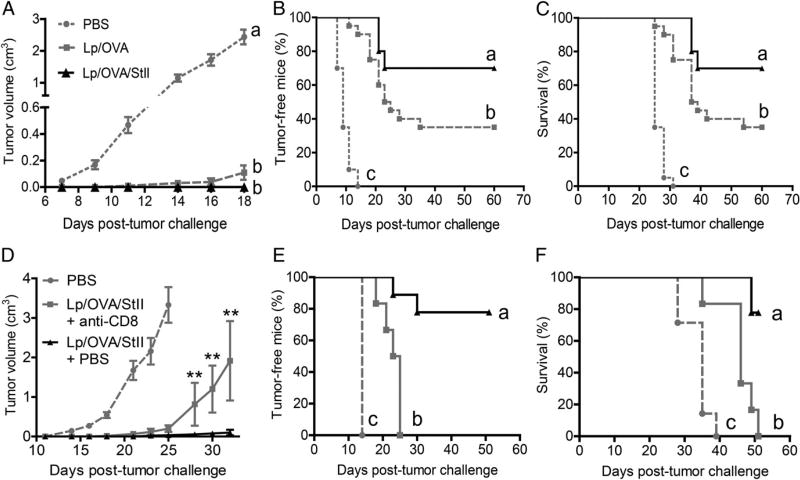
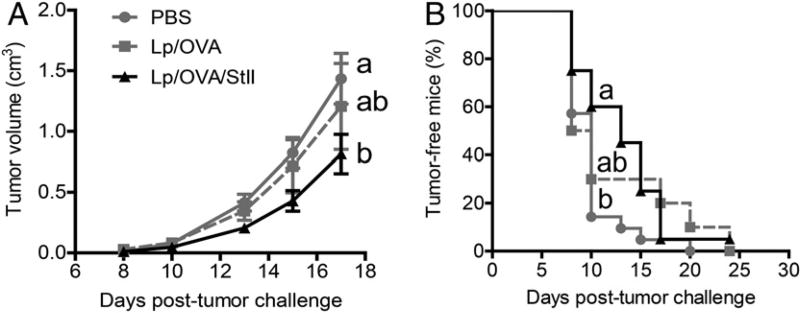
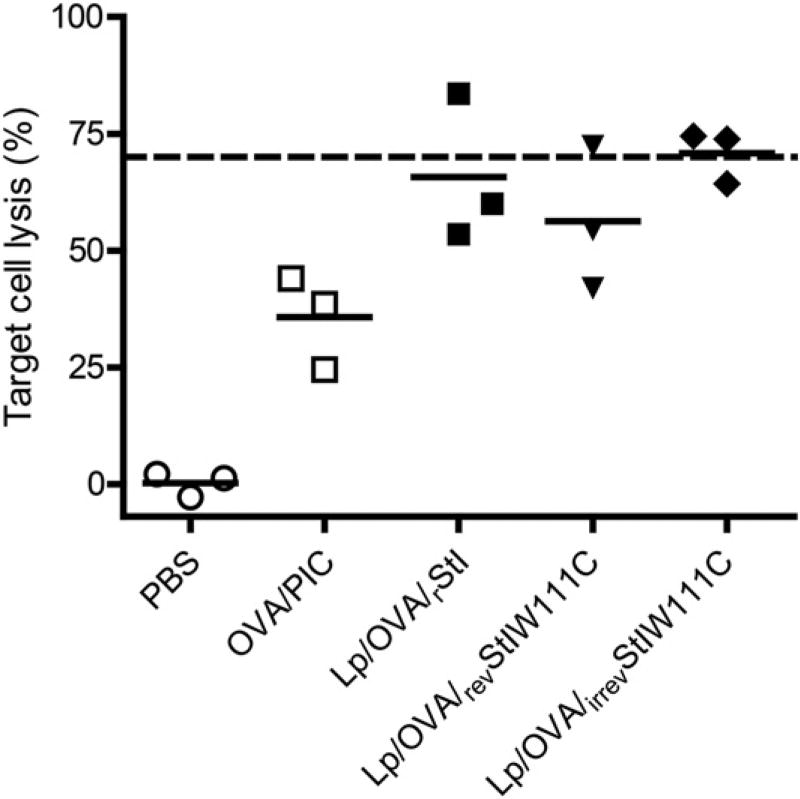
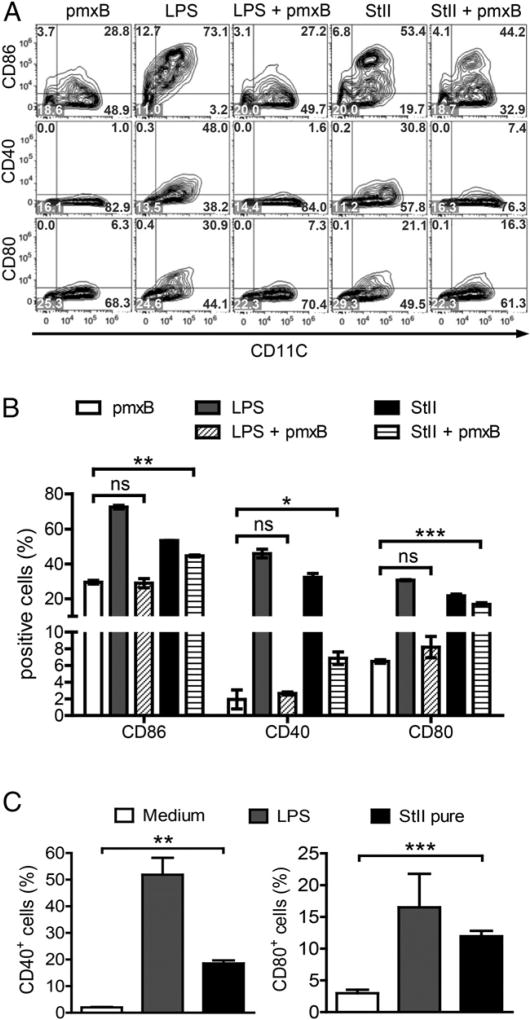
Vaccine strategies to enhance CD8+ CTL responses remain a current challenge because they should overcome the plasmatic and endosomal membranes for favoring exogenous Ag access to the cytosol of APCs. As a way to avoid this hurdle, sticholysin (St) II, a pore-forming protein from the Caribbean Sea anemone Stichodactyla helianthus, was encapsulated with OVA into liposomes (Lp/OVA/StII) to assess their efficacy to induce a CTL response. OVA-specific CD8+ T cells transferred to mice immunized with Lp/OVA/StII experienced a greater expansion than when the recipients were injected with the vesicles without St, mostly exhibiting a memory phenotype. Consequently, Lp/OVA/StII induced a more potent effector function, as shown by CTLs, in vivo assays. Furthermore, treatment of E.G7-OVA tumor-bearing mice with Lp/OVA/StII significantly reduced tumor growth being more noticeable in the preventive assay. The contribution of CD4+ and CD8+ T cells to CTL and antitumor activity, respectively, was elucidated. Interestingly, the irreversibly inactive variant of the StI mutant StI W111C, encapsulated with OVA into Lp, elicited a similar OVA-specific CTL response to that observed with Lp/OVA/StII or vesicles encapsulating recombinant StI or the reversibly inactive StI W111C dimer. These findings suggest the relative independence between StII pore-forming activity and its immunomodulatory properties. In addition, StII-induced in vitro maturation of dendritic cells might be supporting these properties. These results are the first evidence, to our knowledge, that StII, a pore-forming protein from a marine eukaryotic organism, encapsulated into Lp functions as an adjuvant to induce a robust specific CTL response.


Conflict of interest statement

Disclosures

The authors have no financial conflicts of interest.

Figures

FIGURE 1
FIGURE 1
StII does not show permeabilizing activity on liposomal vesicles composed of DPPC:Cho (1:1). LUVs comprising DPPC:Cho or PC:SM (1:1 molar ratio) encapsulating CF were exposed at different StII concentrations (2.5–1400 nM). LUVs were diluted in 10 mM Tris-HCl, 140 mM NaCl (pH 7.4) to reach a final lipid concentration of 0.2 µM. Vesicles of PC:SM were used as positive control. Excitation wavelength: 490 nm. Emission wavelength: 520 nm. The experiments were carried out at room temperature. The fraction of permeabilized vesicles (f) at a fixed time was estimated as: f = (Ff – F0)/(Fmax – F0), considering that release of fluorescent probe is simultaneous to pore formation, where F0 and Ff are fluorescence values before and after adding StII, respectively, and Fmax is the fluorescence measured in the presence of 0.1% Triton X-100. Data are from a single experiment representative of two independent experiments.
FIGURE 2
FIGURE 2
Presence of OVA and StII on the surface of DPPC:Cho Lp. Freshly prepared DRVs of DPPC:Cho (1:1) empty (Lp), encapsulating OVA (Lp/OVA), and encapsulating StII with or without OVA (Lp/OVA/StII, Lp/StII) were incubated with polyclonal Abs from mice and rabbit specific to OVA or StII, respectively. Subsequently, vesicles were treated with an FITC-conjugated Ab anti-mouse IgG or an FITC-conjugated anti-rabbit IgG and examined by flow cytometry. (A) A representative side scatter-area (SSC-H) versus FITC–anti-IgG dot plot graph of each formulation is shown. Asterisks indicate the protein assessed in each case. Mean (± SD) vesicle percentage from different liposomal preparations (n = 6) exposing OVA (B) or StII (C) at the surface. No significant differences (ns) were detected according to the two-tailed unpaired t test (p > 0.05). Data shown are from a single experiment representative of two experiments yielding comparable results.
FIGURE 3
FIGURE 3
Immunization with StII coencapsulated into the DPPC:Cho Lp with OVA induces significant expansion of OVA-specific CD8+ T lymphocytes. Splenocytes (25 × 106 equivalent to 5.5 × 10⁶ OVA-specific CD8+ T cells) from OT-1 mice (CD45.2+) were transferred i.v. into Ly5 mice (CD45.1+). Two days later, Ly5 mice (n = 3) were immunized s.c. twice (12-d interval) with Lp/OVA/StII (50 µg OVA and 6.25 µg StII), Lp/OVA (50 µg OVA), or PBS (as negative control). Seven days after the second immunization, the inguinal LN closest to the inoculation site of each mouse was removed and homogenized, and CD8+ CD45.2+ cells were analyzed by flow cytometry. (A) Each contour graph, with the respective cell percentages in each quadrant referred to the lymphocyte gate, corresponds to an individual animal representative of each group. (B) Percentage (mean ± SEM) of CD8+ CD45.2+ cells for each treatment. (C) Contour graphs showing the percentage of CD44high CD62L+ cells (CD8+ memory cells) in relation to the lymphocyte gate of an individual mouse representative of each immunized group. Graphs are from the CD8+ CD45.2+ gate. (D) Percentage (mean ± SEM) of CD44high CD62L+ cells for each group. Data in (B) and (D) are from a meta-analysis of two independent assays. *p < 0.05, **p < 0.01, ***p < 0.001, two-tailed unpaired t test.
FIGURE 4
FIGURE 4
Inclusion of StII into DPPC:Cho Lp containing OVA enhances OVA-specific cytotoxic response in mice. C57BL/6 mice (n = 3) were immunized s.c. twice at days 0 and 12 with Lp/OVA (50 µg OVA) or Lp/OVA/StII (50 µg OVA and 6.25 µg StII). PBS and 1 mg of OVA mixed with 100 µg PIC (OVA/PIC) were injected into mice as negative and positive controls, respectively. Eight days after the second immunization, mice received 60 × 106 cells containing a 1:1 proportion of target cells (SIINFEKL-charged and CFSEbright-labeled splenocytes) and control cells (without peptide and CFSEdull-labeled splenocytes) i.v., and mice were sacrificed 16–18 h later. Inguinal draining LNs were harvested, and the total events corresponding to both fluorescent intensities (CFSEdull and CFSEbright) were determined by FACS. The percentage of specific lysis was calculated as 100 (CFSEbright/CFSEdull)vaccinated × 100 × (CFSEdull/CFSEbright)PBS. (A) Line graphs of CFSEdull and CFSEbright cells from an individual mouse representative of each experimental group. (B) Percentages of target cell lysis in individual animals from multiple in vivo CTL assays; the average value is represented by a horizontal line. Different letters indicate significant differences among groups based on the Dunnett T3 test (p values are specified in the Results). In other similar CTL assays, mice immunized with Lp/OVA/StII and OVA/PIC were injected i.p. with an anti-CD4 mAb or PBS as control, at 4-d intervals, starting at day −1. (C) Dot plot graphs of CD4 versus CD3 of splenocytes from individual mice receiving anti-CD4 mAb or PBS at days 1 and 4 after treatment. Quadrants were individually set at positions where unstained cells signals were <1%. Values correspond to the percentage of cells in relation to the total lymphocytes in spleens. (D) Each data point represents cytotoxic activity in individual experimental mice. (anti-CD4) and (PBS) indicate animal groups receiving anti-CD4 mAb or PBS, respectively. Statistical significance was calculated using a two-tailed unpaired t test. The figure shows one representative experiment from three repetitions with similar results. ns, not significant, p > 0.05.
FIGURE 5
FIGURE 5
StII coencapsulated into DPPC:Cho Lp with the Ag induces remarkable antitumor prophylactic immunity that decreases upon depletion of CD8+ T lymphocytes. C57BL/6 mice were immunized i.m. twice with Lp/OVA (50 µg OVA) or Lp/OVA/StII (50 µg OVA and 6.25 µg StII) on days 0 and 12. Mice were challenged 7 d later with 3 × 10⁵ cells E.G7-OVA tumor cells. A group of mice received PBS as control. Time courses of tV increase (mean ± SEM) (A), tumor grafting (B), and survival curves (C) in experimental groups after tumor challenge. Data are representatives of three independent experiments, each including 7–10 mice per group. Different letters indicate statistical differences among groups based on the Dunnett T3 test (A) and the log-rank test (B and C). The p values are specified in the Results. In another similar antitumoral assay, but immunizing s.c. only with Lp/OVA/StII (OVA 50 µg), mice were depleted of CD8+ T cells by i.p. injection of anti-CD8 mAb (1 mg/mice) 1 d before tumor challenge or they received PBS instead of anti-CD8 (nondepleted group). Time courses of tV increase (mean ± SEM) (D), tumor grafting (E), and survival curves (F) of experimental groups. Statistically significant differences were estimated by the Mann–Whitney U test between the mice groups depleted or not of CD8+ T lymphocytes (D) and the log-rank test (E and F). Different letters indicate statistical differences among groups (p values are specified in the Results). Two experiments were performed with similar results. **p < 0.01.
FIGURE 6
FIGURE 6
StII coencapsulated into DPPC:Cho Lp with the Ag elicits a therapeutic antitumoral response. The antitumor therapeutic assay was carried out by challenging the mice (n = 10) with an E.G7-OVA tumor 3 d before immunization. Animals were injected s.c. once per week with Lp/OVA/StII or Lp/OVA (OVA 50 µg) three times. The control group was treated with PBS. Time courses of the tV increase (mean ± SEM) (A) and tumor grafting (B). Different letters indicate statistical differences among groups based on the Dunn test (A) or the log-rank test (B). The p values are specified in the Results. Data represent the result from a meta-analysis of three independent experiments.
FIGURE 7
FIGURE 7
An irreversibly inactive dimer of rStI coencapsulated into DPPC:Cho Lp with OVA induces a similar Ag-specific cytotoxicity as StII-containing Lp. C57BL/6 mice (three mice per group) were immunized s.c. twice with OVA/PIC (1 mg of OVA, 100 µg of PIC) or with Lp/OVA/Sts (rStI, revStI W111C, or irrevStI W111C) (50 µg of OVA and 6.25 µg of St) on days 0 and 12. A group of mice received PBS as control. The CTL assay was performed in vivo as described in Fig. 4. Each data point and the horizontal solid lines represent the cytotoxic activity of individual mice and the average values, respectively. The dashed line indicates the average lysis (%) from animals immunized with Lp/OVA/StII (Fig. 4). Data are from one representative experiment of two independent sets with similar results.
FIGURE 8
FIGURE 8
StII promotes DC maturation in vitro, independent of the presence of contaminating LPS. Immature BMDCs were obtained from femurs and tibias of C57BL/.6 mice. After 7 d of culture, cells were harvested, counted, and seeded again at 1 × 10⁶ cells per milliliter. StII (1 µg/ml) was added to immature BMDCs in 2 ml of serum-free medium for 3 h, and the PFP was subsequently inactivated by the addition of 10% FCS. LPS (1 µg/ml), LPS plus pmxB (10 µg/ml), StII plus pmxB, and StII free of endotoxin by column purification (pure StII) were also assayed under similar conditions. Eighteen hours later, the upregulation of costimulatory molecules on the BMDC surface was detected by flow cytometry. Doublets were excluded from total acquired cells according to FSC profiles (FSC-area versus FSC-high), and the percentages of DCs (CD11c+ cells) expressing costimulatory molecules were analyzed on gated live cells. (A) Contour graphs representative of the expression of CD86, CD40, and CD80 costimulatory molecules by CD11c+ cells. Values in the quadrants represent cell percentages. (B and C) Percentages of CD11c+ cells expressing each costimulatory molecule (mean ± SD). Data are from one representative experiment of three independent assays with similar results; each one was performed at least in duplicate. *p < 0.05, **p < 0.01, ***p < 0.001. ns, not significant.

Similar articles

Cited by

References

    1. Kaliński P, Schuitemaker JH, Hilkens CM, Kapsenberg ML. Prostaglandin E2 induces the final maturation of IL-12-deficient CD1a+CD83+ dendritic cells: the levels of IL-12 are determined during the final dendritic cell maturation and are resistant to further modulation. J. Immunol. 1998;161:2804–2809. - PubMed
    1. Schiavoni G, Mattei F, Gabriele L. Type I interferons as stimulators of DC-mediated cross-priming: impact on anti-tumor response. Front. Immunol. 2013;4:483. - PMC - PubMed
    1. Banchereau J, Briere F, Caux C, Davoust J, Lebecque S, Liu YJ, Pulendran B, Palucka K. Immunobiology of dendritic cells. Annu. Rev. Immunol. 2000;18:767–811. - PubMed
    1. Kurts C, Robinson BWS, Knolle PA. Cross-priming in health and disease. Nat. Rev. Immunol. 2010;10:403–414. - PubMed
    1. Platzer B, Stout M, Fiebiger E. Antigen cross-presentation of immune complexes. Front. Immunol. 2014;5:140. - PMC - PubMed

Publication types