

Id2 Collaborates with Id3 To Suppress Invariant NKT and Innate-like Tumors
- PMID: 28258199
- PMCID: PMC5380563
- DOI: 10.4049/jimmunol.1601935
Id2 Collaborates with Id3 To Suppress Invariant NKT and Innate-like Tumors
Abstract
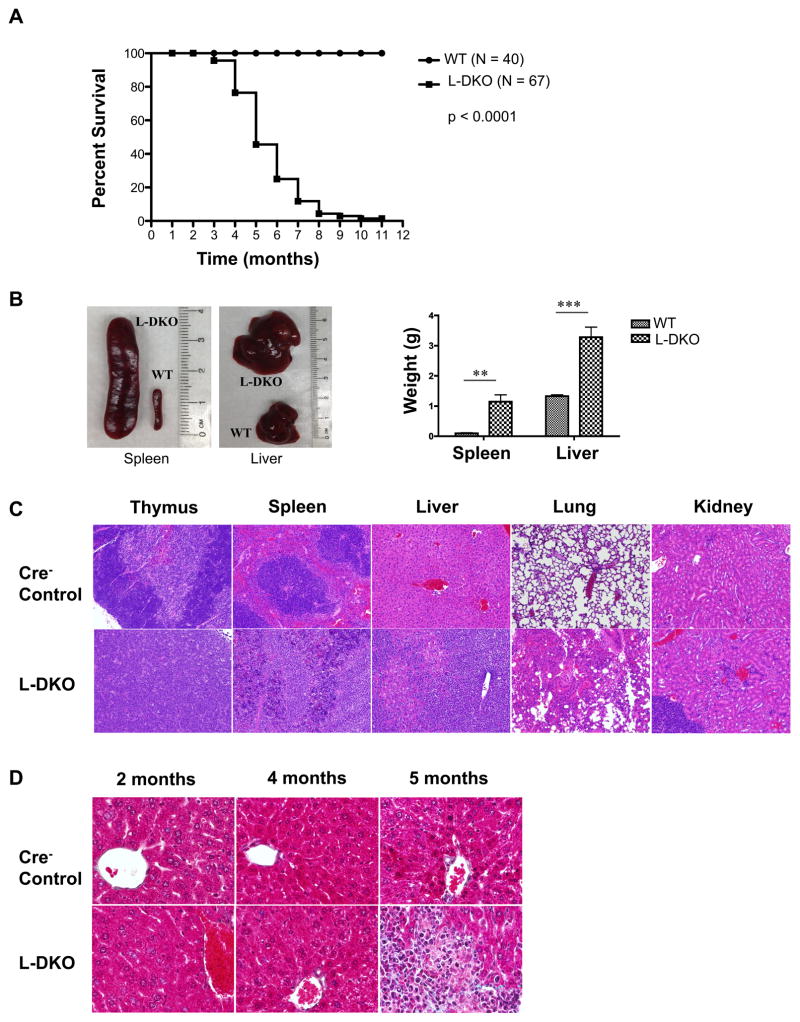
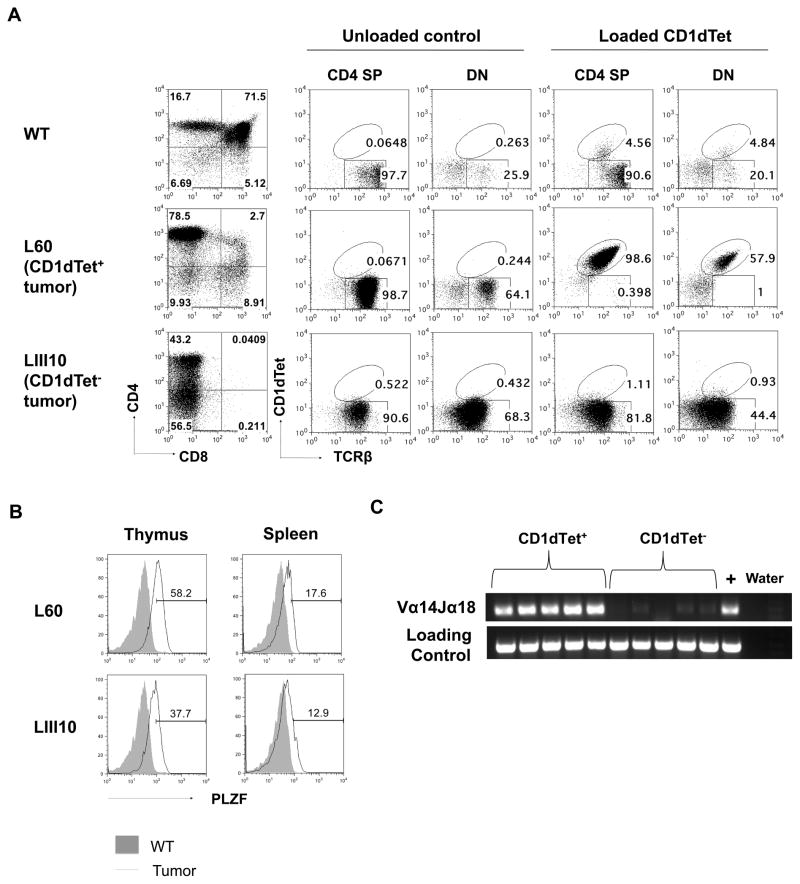
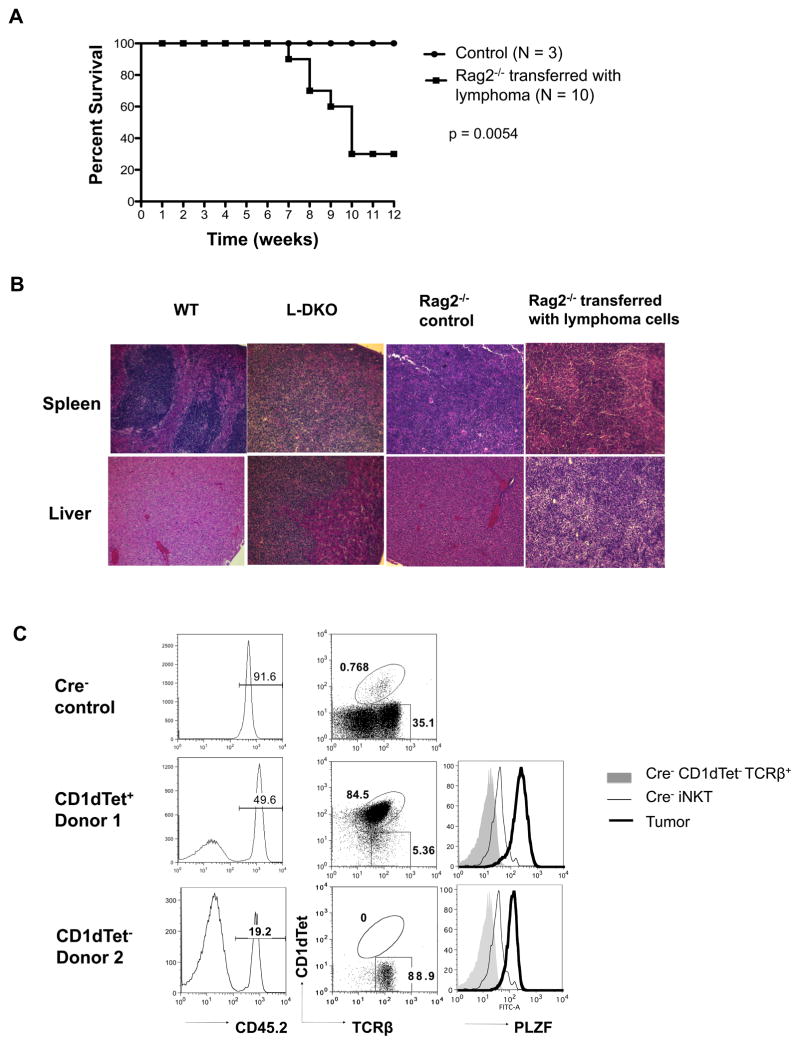
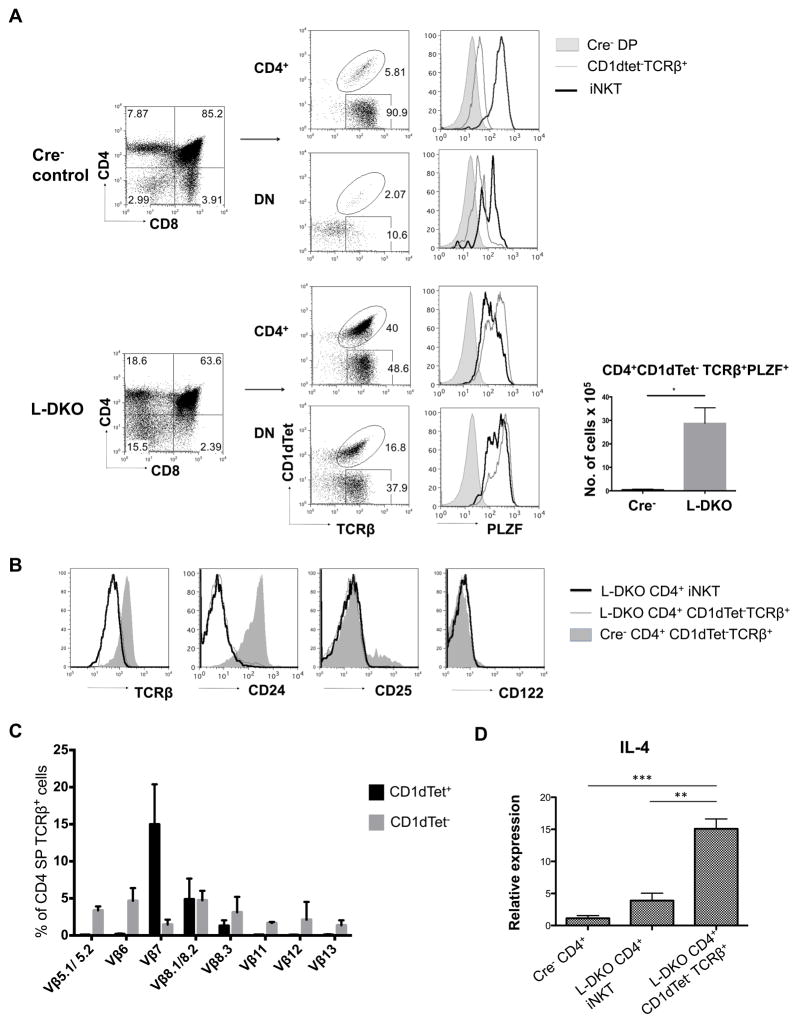
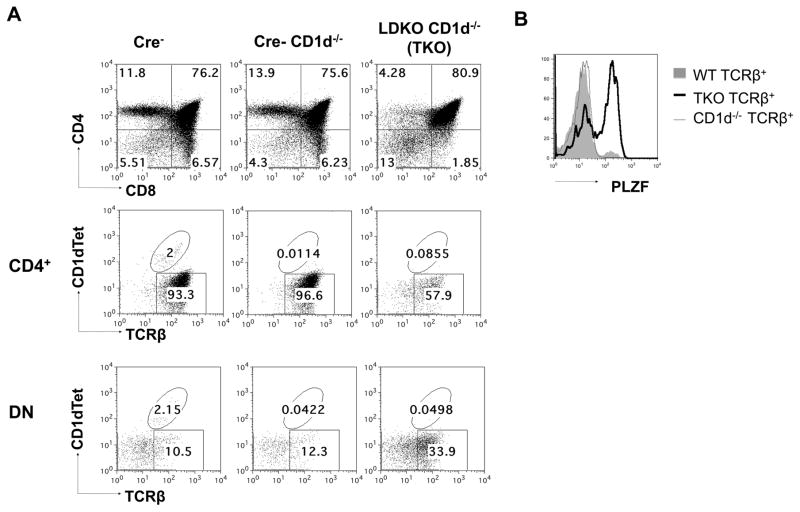
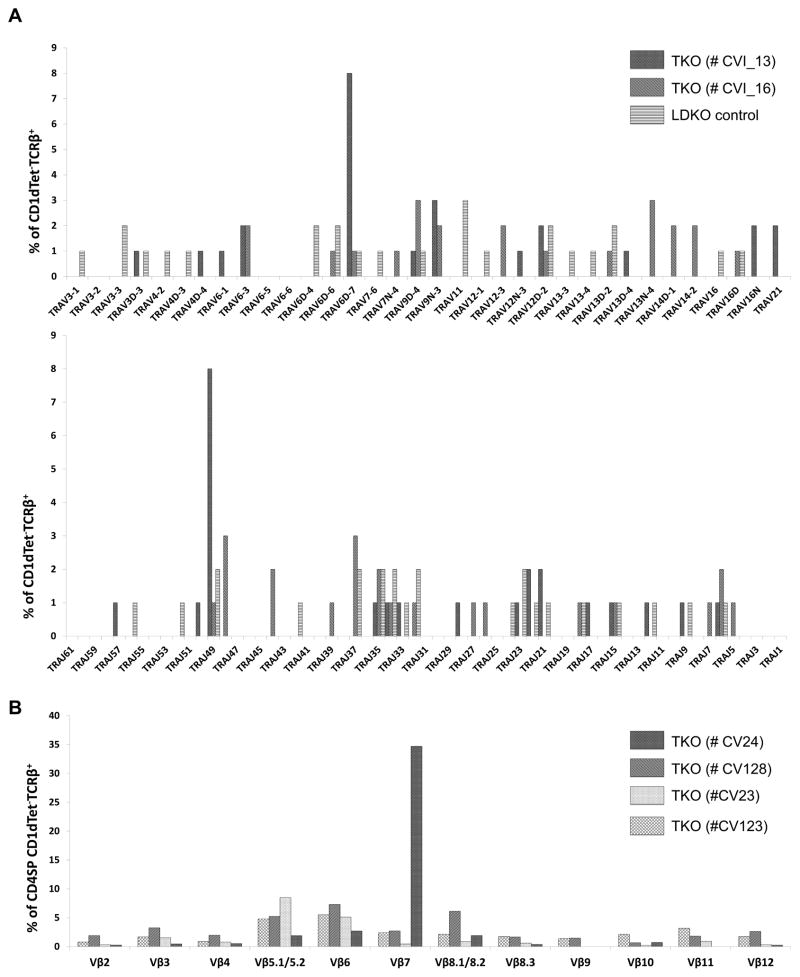
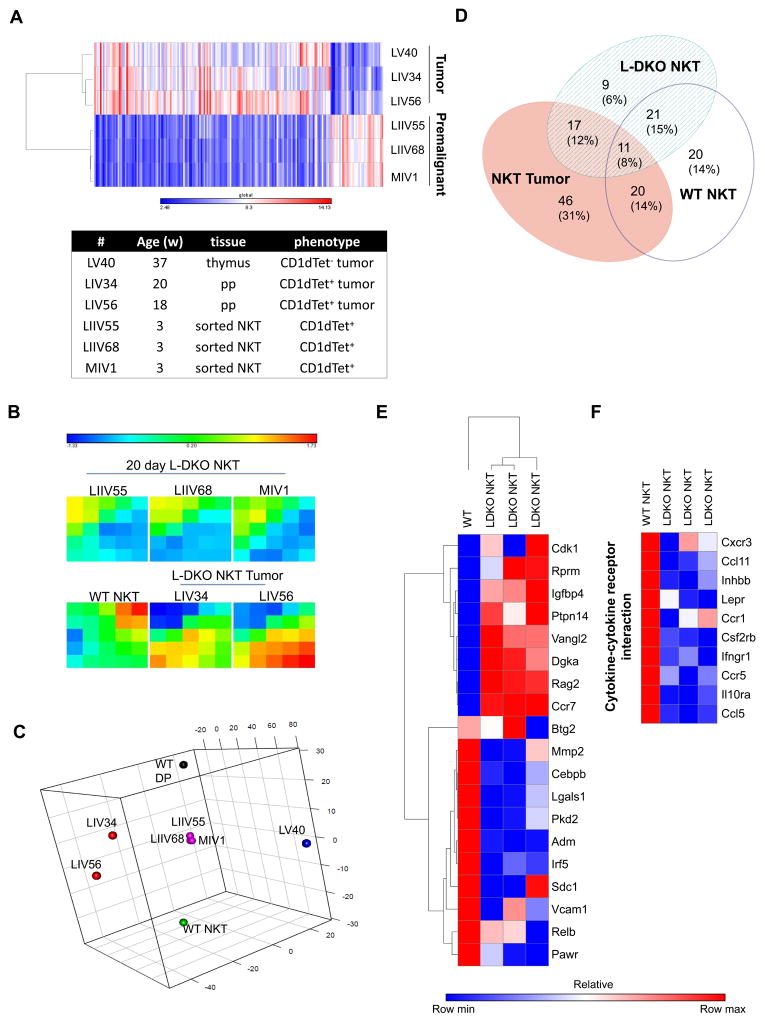
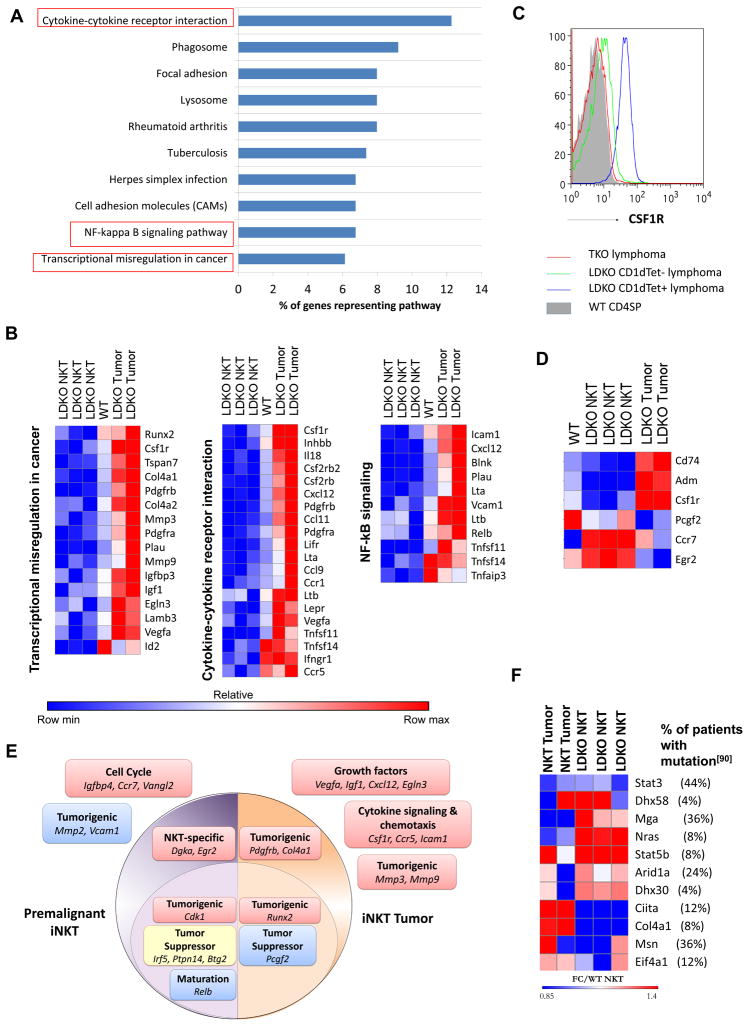
Inhibitor of DNA binding (Id) proteins, including Id1-4, are transcriptional regulators involved in promoting cell proliferation and survival in various cell types. Although upregulation of Id proteins is associated with a broad spectrum of tumors, recent studies have identified that Id3 plays a tumor-suppressor role in the development of Burkitt's lymphoma in humans and hepatosplenic T cell lymphomas in mice. In this article, we report rapid lymphoma development in Id2/Id3 double-knockout mice that is caused by unchecked expansion of invariant NKT (iNKT) cells or a unique subset of innate-like CD1d-independent T cells. These populations began to expand in neonatal mice and, upon malignant transformation, resulted in mortality between 3 and 11 mo of age. The malignant cells also gave rise to lymphomas upon transfer to Rag-deficient and wild-type hosts, reaffirming their inherent tumorigenic potential. Microarray analysis revealed a significantly modified program in these neonatal iNKT cells that ultimately led to their malignant transformation. The lymphoma cells demonstrated chromosome instability along with upregulation of several signaling pathways, including the cytokine-cytokine receptor interaction pathway, which can promote their expansion and migration. Dysregulation of genes with reported driver mutations and the NF-κB pathway were found to be shared between Id2/Id3 double-knockout lymphomas and human NKT tumors. Our work identifies a distinct premalignant state and multiple tumorigenic pathways caused by loss of function of Id2 and Id3. Thus, conditional deletion of Id2 and Id3 in developing T cells establishes a unique animal model for iNKT and relevant innate-like lymphomas.
Copyright © 2017 by The American Association of Immunologists, Inc.
Figures
Similar articles
-
Id3 and Id2 act as a dual safety mechanism in regulating the development and population size of innate-like γδ T cells.J Immunol. 2014 Feb 1;192(3):1055-1063. doi: 10.4049/jimmunol.1302694. Epub 2013 Dec 30. J Immunol. 2014. PMID: 24379125 Free PMC article.
-
Combined deletion of Id2 and Id3 genes reveals multiple roles for E proteins in invariant NKT cell development and expansion.J Immunol. 2013 Nov 15;191(10):5052-64. doi: 10.4049/jimmunol.1301252. Epub 2013 Oct 11. J Immunol. 2013. PMID: 24123680 Free PMC article.
-
E and Id proteins influence invariant NKT cell sublineage differentiation and proliferation.J Immunol. 2014 Mar 1;192(5):2227-36. doi: 10.4049/jimmunol.1302904. Epub 2014 Jan 27. J Immunol. 2014. PMID: 24470501 Free PMC article.
-
Inhibitor of differentiation 4 (ID4): From development to cancer.Biochim Biophys Acta. 2015 Jan;1855(1):92-103. doi: 10.1016/j.bbcan.2014.12.002. Epub 2014 Dec 12. Biochim Biophys Acta. 2015. PMID: 25512197 Free PMC article. Review.
-
Invariant natural killer T cells: innate-like T cells with potent immunomodulatory activities.Tissue Antigens. 2009 Jun;73(6):535-45. doi: 10.1111/j.1399-0039.2009.01256.x. Epub 2009 Apr 8. Tissue Antigens. 2009. PMID: 19392798 Review.
Cited by
-
Deciphering the multifaceted roles of TET proteins in T-cell lineage specification and malignant transformation.Immunol Rev. 2021 Mar;300(1):22-36. doi: 10.1111/imr.12940. Epub 2021 Jan 7. Immunol Rev. 2021. PMID: 33410200 Free PMC article. Review.
-
DNA methylation changes involved in the tumor increase in F2 males born to gestationally arsenite-exposed F1 male mice.Cancer Sci. 2019 Aug;110(8):2629-2642. doi: 10.1111/cas.14104. Epub 2019 Jul 25. Cancer Sci. 2019. PMID: 31215104 Free PMC article.
-
Id Proteins Suppress E2A-Driven Invariant Natural Killer T Cell Development prior to TCR Selection.Front Immunol. 2018 Jan 24;9:42. doi: 10.3389/fimmu.2018.00042. eCollection 2018. Front Immunol. 2018. PMID: 29416542 Free PMC article.
-
Paradoxical role of Id proteins in regulating tumorigenic potential of lymphoid cells.Front Med. 2018 Aug;12(4):374-386. doi: 10.1007/s11684-018-0652-x. Epub 2018 Jul 24. Front Med. 2018. PMID: 30043222 Review.
-
Investigating the ID3/SLC22A4 as immune-related signatures in ischemic stroke.Aging (Albany NY). 2023 Dec 14;15(24):14803-14829. doi: 10.18632/aging.205308. Epub 2023 Dec 14. Aging (Albany NY). 2023. PMID: 38112574 Free PMC article.
References
-
- Hanahan D, Weinberg RA. Hallmarks of cancer: the next generation. Cell. 2011;144:646–674. - PubMed
-
- Hainaut P, Plymoth A. Targeting the hallmarks of cancer: towards a rational approach to next-generation cancer therapy. Curr Opin Oncol. 2013;25:50–51. - PubMed
-
- Ellenbroek SI, van Rheenen J. Imaging hallmarks of cancer in living mice. Nat Rev Cancer. 2014;14:406–418. - PubMed
-
- Evan GI, Vousden KH. Proliferation, cell cycle and apoptosis in cancer. Nature. 2001;411:342–348. - PubMed
-
- DeBerardinis RJ, Lum JJ, Hatzivassiliou G, Thompson CB. The biology of cancer: metabolic reprogramming fuels cell growth and proliferation. Cell Metab. 2008;7:11–20. - PubMed
Publication types
MeSH terms
Substances
Grants and funding
LinkOut - more resources
Full Text Sources
Other Literature Sources
Medical
Molecular Biology Databases
