. 2017 Apr 14;292(15):6240-6254.
doi: 10.1074/jbc.M116.753848. Epub 2017 Mar 3.

Molecular mechanism and structural basis of gain-of-function of STAT1 caused by pathogenic R274Q mutation

Affiliations

Molecular mechanism and structural basis of gain-of-function of STAT1 caused by pathogenic R274Q mutation

Ryoji Fujiki et al. J Biol Chem. .

Abstract

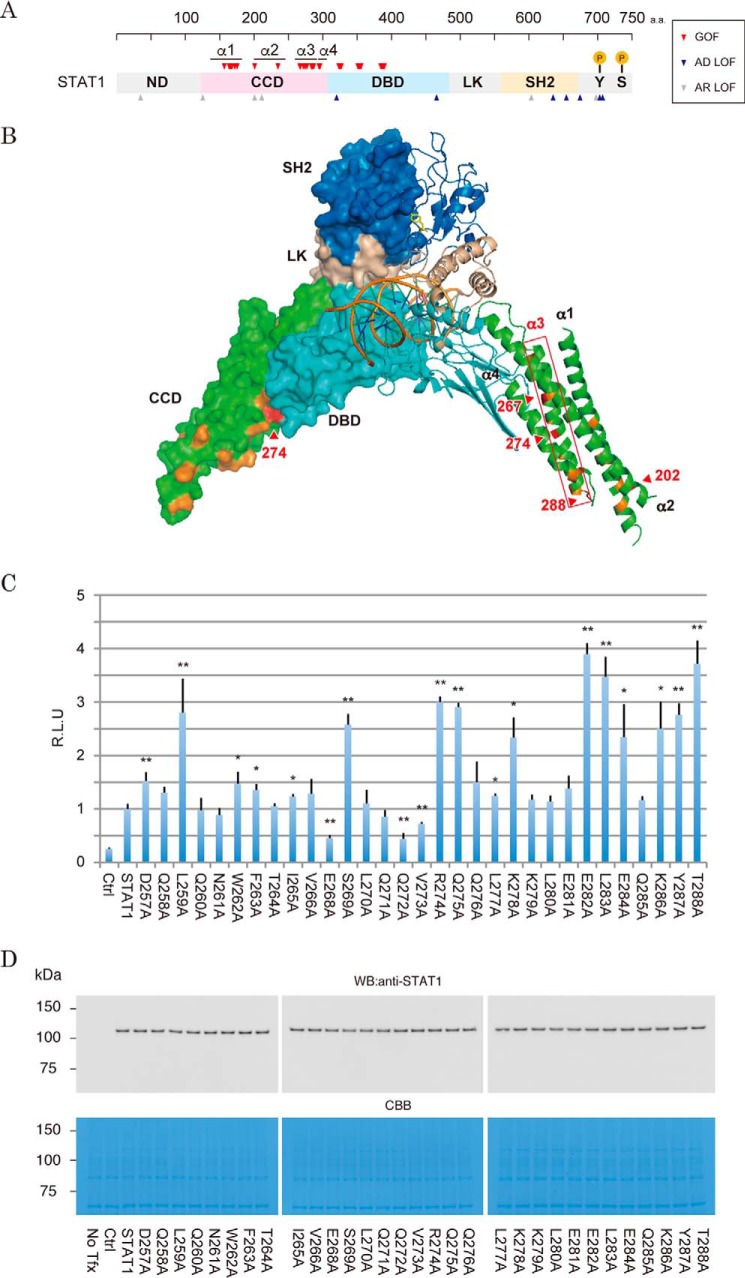
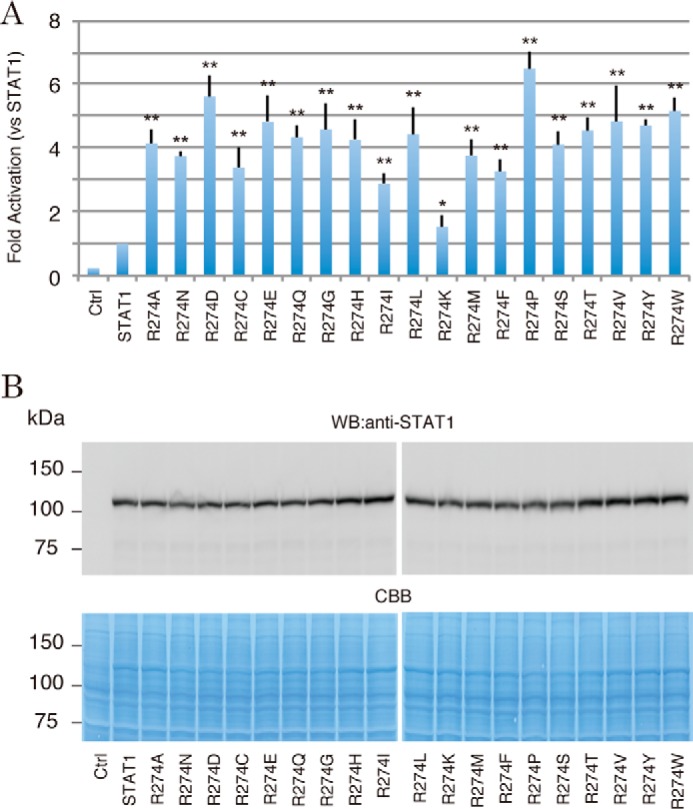
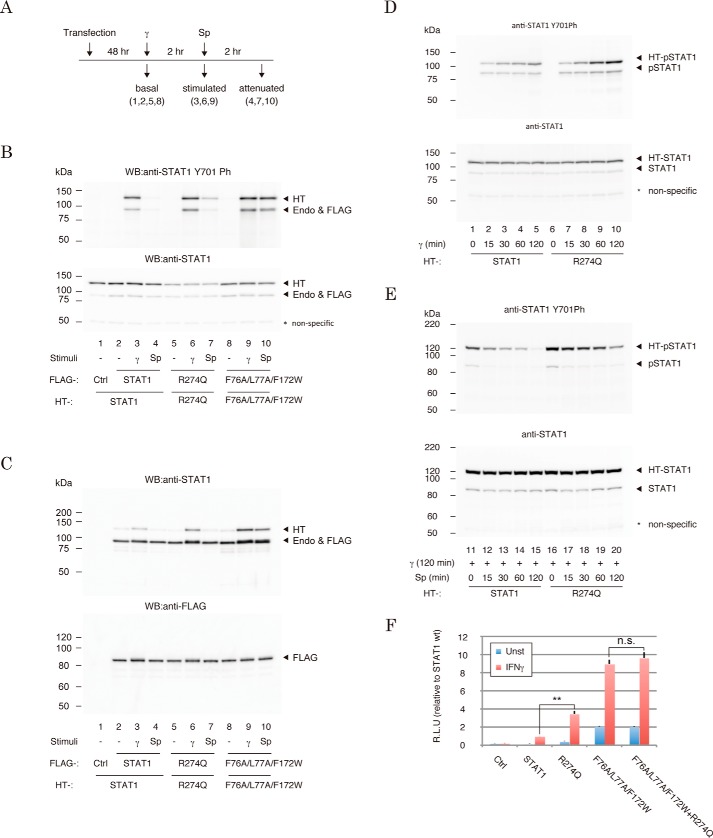
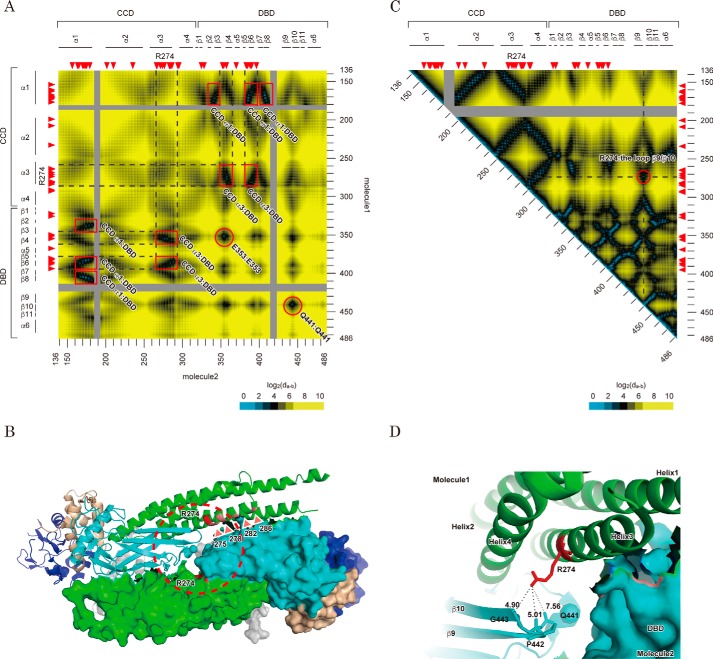
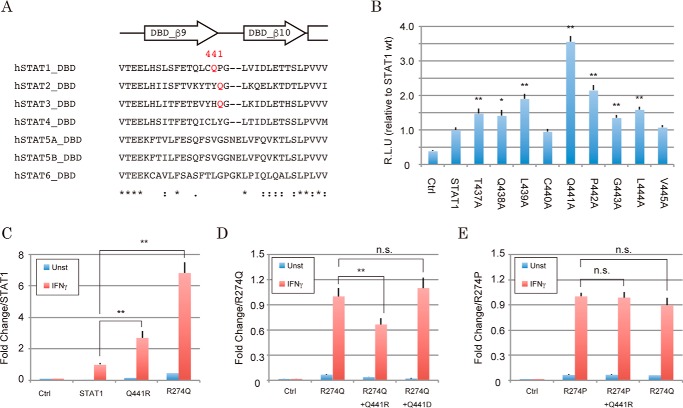
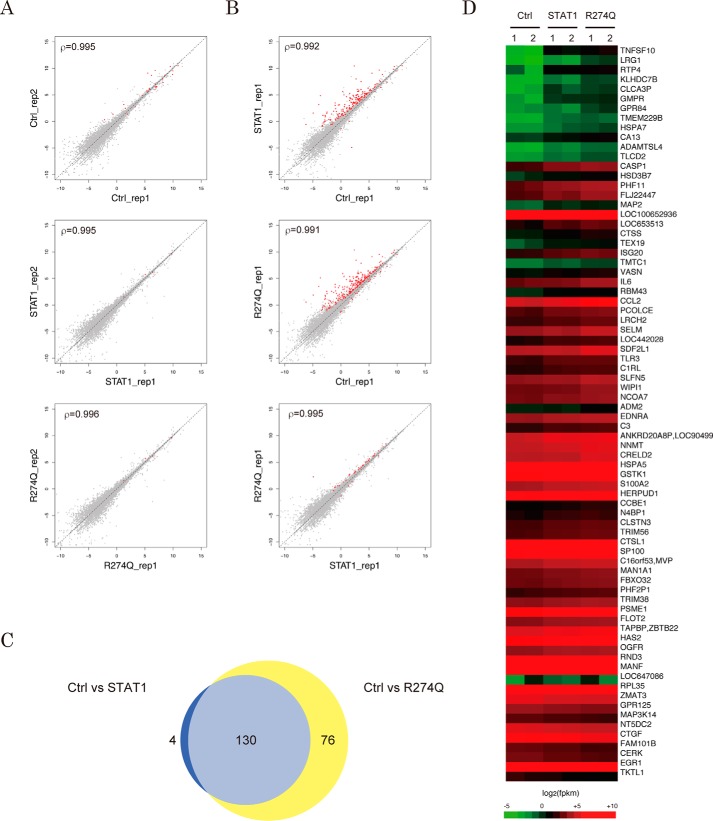
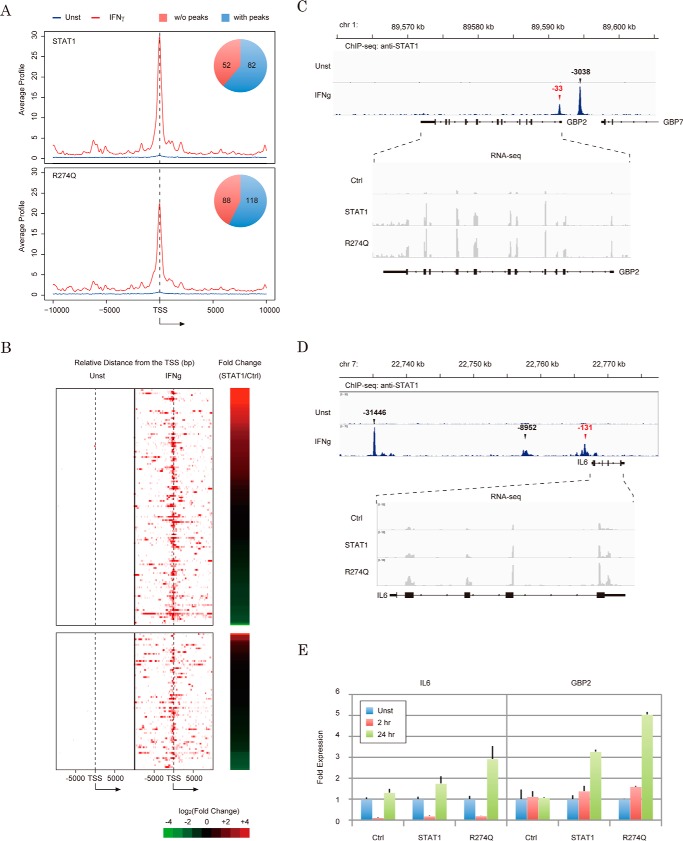
Gain-of-function (GOF) mutations in the STAT1 gene are critical for the onset of chronic mucocutaneous candidiasis (CMC) disease. However, the molecular basis for the gain of STAT1 function remains largely unclear. Here, we investigated the structural features of STAT1 GOF residues to better understand the impact of these pathogenic mutations. We constructed STAT1 alanine mutants of the α3 helix residues of the coiled-coil domain, which are frequently found in CMC pathogenic mutations, and measured their transcriptional activities. Most of the identified GOF residues were located inside the coiled-coil domain stem structure or at the protein surface of the anti-parallel dimer interface. Unlike those, Arg-274 was adjacent to the DNA-binding domain. In addition, Arg-274 was found to functionally interact with Gln-441 in the DNA-binding domain. Because Gln-441 is located at the anti-parallel dimer contact site, Gln-441 reorientation by Arg-274 mutation probably impedes formation of the dimer. Further, the statistical analysis of RNA-seq data with STAT1-deficient epithelial cells and primary T cells from a CMC patient revealed that the R274Q mutation affected gene expression levels of 66 and 76 non-overlapping RefSeq genes, respectively. Because their transcription levels were only slightly modulated by wild-type STAT1, we concluded that the R274Q mutation increased transcriptional activity but did not change dramatically the repertoire of STAT1 targets. Hence, we provide a novel mechanism of STAT1 GOF triggered by a CMC pathogenic mutation.

Keywords: Janus kinase (JAK); genetics; pathogenesis; signal transducers and activators of transcription 1 (STAT1); transcription regulation.


Conflict of interest statement

The authors declare that they have no conflicts of interest with the contents of this article

Figures

Figure 1.
Figure 1.
Effects of amino acid substitutions on the transcriptional activity in the α3 helix region of the STAT1 CCD. A, arrowheads indicate positions of the STAT1 residues targeted by pathogenic missense mutations. The GOF mutations are red. Mutations coupled with STAT1 LOF and STAT1 deficiency are blue and gray, respectively. Amino acid number is indicated above. Lollipops indicate positions of the known phosphorylation sites. B, location of pathogenic GOF mutation in the crystal structure of the DNA-bound STAT1 dimer. One subunit of the dimer is illustrated as a ribbon diagram, and another is shown in a surface model. The four CCD helices are indicated as α1–α4. The locations of the CMC-hot-spot GOF mutations are colored red, and those of other known GOF mutations are colored orange. The domains are shown in gray (ND), green (CCD), cyan (DBD and LK), and dark blue (SH2). C, IFN-γ-stimulated transcriptional activities of the α3 mutants were measured by a Dual-Luciferase reporter system with the reporter driven by 5× IFN-γ-response elements of the IRF1 promoter. RLU of the mutants were normalized to wild-type STAT1 activity. The experiments shown in the lanes were performed in triplicate. Error bars, S.D. of each condition. Asterisks, significant differences of the mean values of the mutant RLU compared with the mean values of the STAT1 RLU. p values were determined with Student's test: *, p < 0.05; **, p < 0.01. D, protein levels of the α3 mutants were analyzed by Western blotting with anti-STAT1 antibody (top). The amount of the loaded protein (10 mg) was visualized by Coomassie Brilliant Blue (CBB) staining of the immunoblotted membrane (bottom).
Figure 2.
Figure 2.
The transcriptional activities of the Arg-274 mutants with other amino acid residues. A, IFN-γ-stimulated transcriptional activities of a series of Arg-274 mutants were measured by the Dual-Luciferase reporter system. The RLU of the mutants were normalized to the value of wild-type STAT1 activity. The experiments shown in the lanes were performed in triplicate. Error bars, S.D. of each condition. Asterisks, significant differences of the mean values of the mutant RLU compared with the mean values of the STAT1 RLU. p values were determined with Student's test: *, p < 0.05; **, p < 0.01. B, protein levels of Arg-274 mutants were analyzed by Western blotting with anti-STAT1 antibody (top). The amount of the loaded protein (10 μg) was visualized by Coomassie Brilliant Blue (CBB) staining of the immunoblotted membrane (bottom).
Figure 3.
Figure 3.
Impacts of R274Q mutations on the IFN-γ-induced regulatory mechanisms of STAT1 phosphorylation and dimerization. A, time line and workflow of cell preparations for the experiments in B and C. γ, IFN-γ; Sp, staurosporine. B and C, Tyr-701 phosphorylation levels (B) and dimerization efficiencies (C) of STAT1 mutants. Phospho-Tyr-701 level (top) and the amount of loaded protein (bottom) in the cell lysates expressed with the indicated STAT1 constructs were visualized by Western blotting. The immunoprecipitated FLAG-tagged proteins and the bound Halo-tagged dimeric counterpart were visualized by STAT1 antibody (top). Expression levels of the FLAG-tagged proteins were visualized with anti-FLAG antibody (bottom). *, nonspecific band. HT, Halo-tagged STAT1; FLAG, FLAG-tagged STAT1; Endo, endogenous STAT1. D and E, time course of IFN-γ-induced phosphorylation (D) and staurosporine-induced dephosphorylation (E) of the R274Q mutant. The cells were recovered at the indicated time points and subjected to Western blotting with the indicated antibodies. F, transcriptional activities of the indicated mutants were measured by Dual-Luciferase reporter assays with the reporter driven by the IFN-γ-response element of IRF1. The RLU of the mutants were normalized against wild-type STAT1 activity. The experiments shown in the lanes were performed in triplicate. Error bars, S.D. of each condition. Asterisks, significant differences of the mean values of the mutant RLU compared with the mean values of the STAT1 RLU. p values were determined with Student's test: n.s., not significant; **, p < 0.01. HT, Halo-tagged STAT1; Endo and FLAG, endogenous and FLAG-tagged STAT1. *, nonspecific band.
Figure 4.
Figure 4.
Structural features of Arg-274 in an anti-parallel STAT1 dimer structure. A, interfaces of the anti-parallel conformation of the STAT1 dimer. The heat map depicts the distances from a residue of one component of the anti-parallel STAT1 dimer to that of the other. Possible contact sites of the dimer are marked with a red square or circle. All distances were calculated based on barycentric coordinates of the residues in an anti-parallel dimer structure (Protein Data Bank entry 1YVL). Scale is shown at the bottom. Amino acid number of the residues (right and bottom) and domain and secondary structure of the protein (left and top) are illustrated beside the heat map. Red arrowheads, position of CMC-related GOF mutations. B, locations of the GOF residues characterized in Fig. 1C are illustrated in an anti-parallel STAT1 structure. C, heat map illustrates the distance between two residues of the same STAT1 molecule. All distances were calculated as described in A by using the coordinates of a parallel dimer structure (Protein Data Bank entry 1BF5). A possible attachment site of CCD with DBD is circled in red. D, intramolecular interaction between Arg-274 and Gln-441. The structure surrounded by Arg-274 indicated by a dashed circle in B is enlarged. Each subunit of the dimer is shown as a ribbon diagram and protein surface, respectively. The domains are colored in gray (ND), green (CCD), cyan (DBD and LK), and dark blue (SH2). Distances between the indicated atoms were calculated by the measurement tool packaged in PyMOL.
Figure 5.
Figure 5.
Interaction of Arg-274 with Gln-441 is indispensable for regulated STAT1 activity. A, sequence homology of the loop between β9 and β10 of STAT family proteins. Secondary structure elements surrounding the loop are illustrated above the alignment. The sequences were aligned with ClustalW. B–E, transcriptional activities of the indicated mutants were assessed by the Dual-Luciferase reporter system. The RLU of the mutants were normalized against the value of wild-type STAT1 activity (B and C), R274Q (D), or R274P (E). The experiments shown in the lanes were performed in triplicate. The error bars represent S.D. of each condition. Asterisks, significant differences of the mean values of the mutant RLU compared with the mean values of the STAT1 RLU. p values were determined with Student's test: n.s., not significant; **, p < 0.01.
Figure 6.
Figure 6.
Effect of the R274Q mutation on the IFN-γ-induced genome-wide gene expression profile. A and B, scatter plots depict different genome-wide expression profiles of experimental duplicates (A) or of the IFN-γ-stimulated U3C cells expressing the indicated STAT1 constructs (B). Each dot represents log-transformed FPKM values of RefSeq gene transcripts. The red dots indicate those transcripts with statistically significant differences between the x axis and the y axis libraries. The statistical relationship between the duplicates is indicated by Spearman's rank correlation coefficient ρ. The experiments were performed in duplicate. C, a Venn diagram demonstrates the number of RefSeq genes with statistically significant differences in comparison with the transcripts of the indicated libraries. The gene symbols are listed in supplemental Table S2. D, heat map presents expression profile of 76 of the R274Q-sensitive genes. Gene symbols are indicated (right).
Figure 7.
Figure 7.
Effect of the R274Q mutation on IFN-γ-dependent regulation of the STAT1 target gene. A, averaged ChIP signal of STAT1 was plotted for the promoters of the STAT1- or R274Q-regulated RefSeq genes detected in Fig. 6. A pie chart shows the number of RefSeq genes harboring STAT1 peaks within 1 kb of the transcription start site. TSS, transcription start site. B, heat map demonstrates the intensity of the STAT1 occupancy of the STAT1-regulated (top) or R274Q-specific (bottom) genes shown in Fig. 6C in the presence (middle) or the absence (left) of IFN-γ. -Fold changes of FPKM values of STAT1 relative to Ctrl are displayed on the right of the panel. C and D, enrichment of the reads of ChIP-seq for STAT1 (top) and RNA-seq of R274Q-dependent transcription (bottom) on the GBP2 gene (C) and IL6 gene (D). Genome position and exon-intron structure are indicated at the top and bottom, respectively. E, validations of IFN-γ-induced activation of IL6 (left) and GBP2 (right) by RT-qPCR. The Ct value in each condition is normalized against the expression levels of GAPDH. Error bars, S.D. of each condition.
Figure 8.
Figure 8.
The IFN-γ-dependent gene expression profile in T cells. A, schematic diagram of RNA and NGS library preparation from T cells. B, visualization of expression from R274Q allele. The BAM file of the WT sample (top) and the R274Q sample (bottom) were loaded onto the Integrated Genome Viewer. C, scatter plots depict different genome-wide expression profiles of the WT sample (top) and the R274Q sample (bottom). Each dot represents log-transformed FPKM values of RefSeq gene transcripts. The red dots indicate those transcripts with statistically significant differences between the x axis and y axis libraries. D, a Venn diagram demonstrates the number of IFN-γ-dependent genes with statistically significant differences. The gene symbols are listed. E, expression profiles of the R274Q-regulated genes in the WT sample. In the scatter plot (top), each dot represents log-transformed FPKM values of RefSeq gene transcripts. The statistical significances of the colored dots are indicated in the panel. The histogram shows the distribution of the RefSeq genes with the indicated log-transformed FPKM values of the wild-type T cells stimulated with IFN-γ (bottom). Blue, density within 25,069 of the total registered RefSeq genes; red, density within 147 of the R274Q significant genes.

References

    1. Shuai K., and Liu B. (2003) Regulation of JAK-STAT signalling in the immune system. Nat. Rev. Immunol. 3, 900–911 - PubMed
    1. Stark G. R., and Darnell J. E. Jr. (2012) The JAK-STAT pathway at twenty. Immunity 36, 503–514 - PMC - PubMed
    1. Boisson-Dupuis S., Kong X. F., Okada S., Cypowyj S., Puel A., Abel L., and Casanova J. L. (2012) Inborn errors of human STAT1: allelic heterogeneity governs the diversity of immunological and infectious phenotypes. Curr. Opin. Immunol. 24, 364–378 - PMC - PubMed
    1. Casanova J. L., Holland S. M., and Notarangelo L. D. (2012) Inborn errors of human JAKs and STATs. Immunity 36, 515–528 - PMC - PubMed
    1. Chapgier A., Boisson-Dupuis S., Jouanguy E., Vogt G., Feinberg J., Prochnicka-Chalufour A., Casrouge A., Yang K., Soudais C., Fieschi C., Santos O. F., Bustamante J., Picard C., de Beaucoudrey L., Emile J. F., et al. (2006) Novel STAT1 alleles in otherwise healthy patients with mycobacterial disease. PLoS Genet. 2, e131. - PMC - PubMed

Publication types

MeSH terms

Substances