Acoustic Behavior of Halobacterium salinarum Gas Vesicles in the High-Frequency Range: Experiments and Modeling
- PMID: 28258771
- PMCID: PMC5385285
- DOI: 10.1016/j.ultrasmedbio.2016.12.020
Acoustic Behavior of Halobacterium salinarum Gas Vesicles in the High-Frequency Range: Experiments and Modeling
Abstract
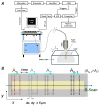
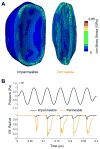
Gas vesicles (GVs) are a new and unique class of biologically derived ultrasound contrast agents with sub-micron size whose acoustic properties have not been fully elucidated. In this study, we investigated the acoustic collapse pressure and behavior of Halobacterium salinarum gas vesicles at transmit center frequencies ranging from 12.5 to 27.5 MHz. The acoustic collapse pressure was found to be above 550 kPa at all frequencies, nine-fold higher than the critical pressure observed under hydrostatic conditions. We illustrate that gas vesicles behave non-linearly when exposed to ultrasound at incident pressure ranging from 160 kPa to the collapse pressure and generate second harmonic amplitudes of -2 to -6 dB below the fundamental in media with viscosities ranging from 0.89 to 8 mPa·s. Simulations performed using a Rayleigh-Plesset-type model accounting for buckling and a dynamic finite-element analysis suggest that buckling is the mechanism behind the generation of harmonics. We found good agreement between the level of second harmonic relative to the fundamental measured at 20 MHz and the Rayleigh-Plesset model predictions. Finite-element simulations extended these findings to a non-spherical geometry, confirmed that the acoustic buckling pressure corresponds to the critical pressure under hydrostatic conditions and support the hypothesis of limited gas flow across the GV shell during the compression phase in the frequency range investigated. From simulations, estimates of GV bandwidth-limited scattering indicate that a single GV has a scattering cross section comparable to that of a red blood cell. These findings will inform the development of GV-based contrast agents and pulse sequences to optimize their detection with ultrasound.
Keywords: Buckling; Contrast agent; High-frequency ultrasound; Modeling; Submicron gas vesicles.
Copyright © 2017 World Federation for Ultrasound in Medicine & Biology. Published by Elsevier Inc. All rights reserved.
Figures


Similar articles
-
Geometric effects in gas vesicle buckling under ultrasound.Biophys J. 2022 Nov 1;121(21):4221-4228. doi: 10.1016/j.bpj.2022.09.004. Epub 2022 Sep 7. Biophys J. 2022. PMID: 36081347 Free PMC article.
-
Experimental acoustic characterization of an endoskeletal antibubble contrast agent: First results.Med Phys. 2021 Nov;48(11):6765-6780. doi: 10.1002/mp.15242. Epub 2021 Oct 14. Med Phys. 2021. PMID: 34580883 Free PMC article.
-
Numerical modeling of microbubble backscatter to optimize ultrasound particle image velocimetry imaging: initial studies.Ultrasonics. 2004 Aug;42(10):1111-21. doi: 10.1016/j.ultras.2004.02.021. Ultrasonics. 2004. PMID: 15234173
-
Italian Society of Cardiovascular Echography (SIEC) Consensus Conference on the state of the art of contrast echocardiography.Ital Heart J. 2004 Apr;5(4):309-34. Ital Heart J. 2004. PMID: 15185894 Review.
-
Ultrasound contrast agents: basic principles.Eur J Radiol. 1998 May;27 Suppl 2:S157-60. doi: 10.1016/s0720-048x(98)00057-6. Eur J Radiol. 1998. PMID: 9652516 Review.
Cited by
-
Achieving single cell acoustic localisation with deactivation super resolution.NPJ Acoust. 2025;1(1):5. doi: 10.1038/s44384-025-00008-7. Epub 2025 Apr 24. NPJ Acoust. 2025. PMID: 40291471 Free PMC article.
-
Ultrasound-Responsive Systems as Components for Smart Materials.Chem Rev. 2022 Mar 9;122(5):5165-5208. doi: 10.1021/acs.chemrev.1c00622. Epub 2021 Nov 12. Chem Rev. 2022. PMID: 34767350 Free PMC article. Review.
-
Microbial gas vesicles as nanotechnology tools: exploiting intracellular organelles for translational utility in biotechnology, medicine and the environment.Microbiology (Reading). 2020 Jun;166(6):501-509. doi: 10.1099/mic.0.000912. Microbiology (Reading). 2020. PMID: 32324529 Free PMC article. Review.
-
Proteins, air and water: reporter genes for ultrasound and magnetic resonance imaging.Curr Opin Chem Biol. 2018 Aug;45:57-63. doi: 10.1016/j.cbpa.2018.02.011. Epub 2018 Mar 14. Curr Opin Chem Biol. 2018. PMID: 29549770 Free PMC article. Review.
-
Dissipative Particle Dynamics Models of Encapsulated Microbubbles and Nanoscale Gas Vesicles for Biomedical Ultrasound Simulations.ACS Appl Nano Mater. 2025 Aug 4;8(32):16053-16070. doi: 10.1021/acsanm.5c02783. eCollection 2025 Aug 15. ACS Appl Nano Mater. 2025. PMID: 40837281 Free PMC article.
References
-
- Bevan P, Karshaffian R, Burns PN. The influence of fragmentation on the acoustic reponse of shrinking bubbles. Ultrasound Med Biol. 2008;34(7):1152–1162. - PubMed
-
- Campbell RB. Tumor physiology and delivery of nanopharmaceuticals. Anticancer Agents in Medicinal Chemistry. 2006;6:503–512. - PubMed
-
- Cobbold RSC. Foundations of Biomedical Ultrasound. Oxford University Press; 2007.
-
- Chin CT, Burns PN. Investigation of the effects of microbubble shell disruption on population scattering and implications for modeling contrast agent. IEEE Trans Ultrason Ferroelectr Freq Control. 2004;51(3):286–292. - PubMed
-
- Landau L, Lifshitz E. Course of theoretical physics, Vol. 7: Theory of elasticity. Butterworth-Heinemann; Oxford: 1997.
Publication types
MeSH terms
Substances
Grants and funding
LinkOut - more resources
Full Text Sources
Other Literature Sources
Miscellaneous

