

Characterizing the roles of alpha and theta oscillations in multisensory attention
- PMID: 28259771
- PMCID: PMC5410970
- DOI: 10.1016/j.neuropsychologia.2017.02.021
Characterizing the roles of alpha and theta oscillations in multisensory attention
Abstract
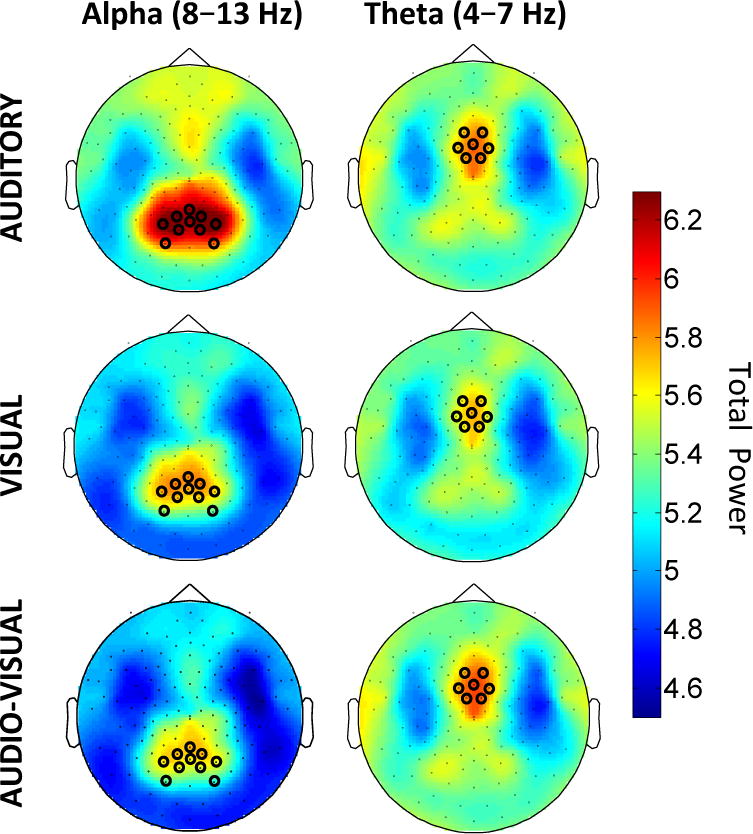
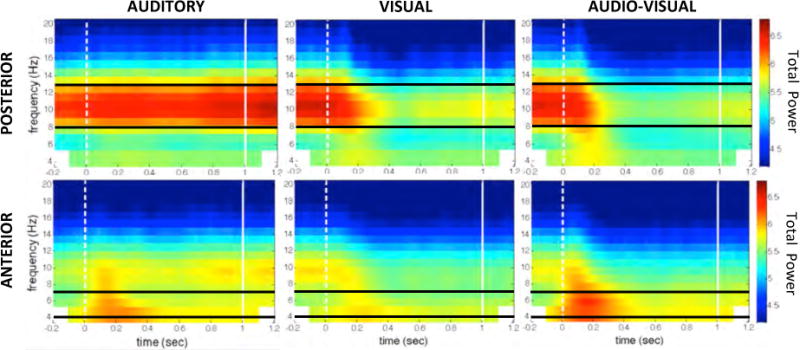
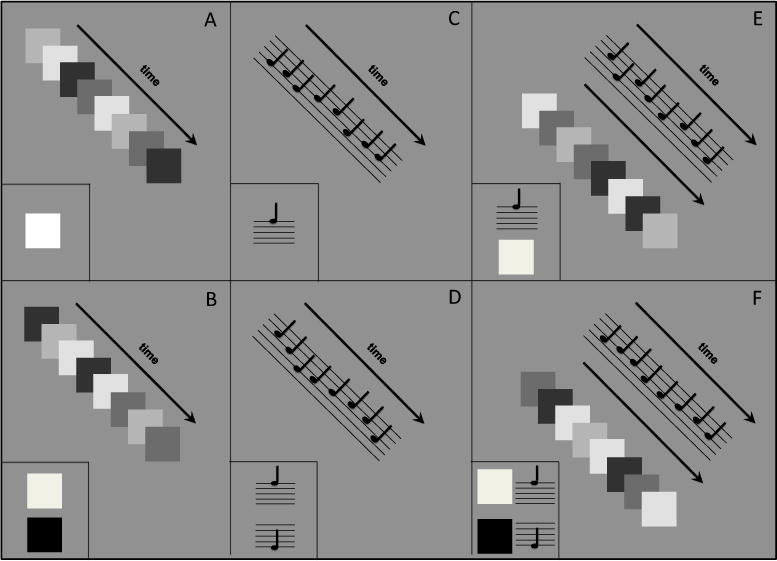
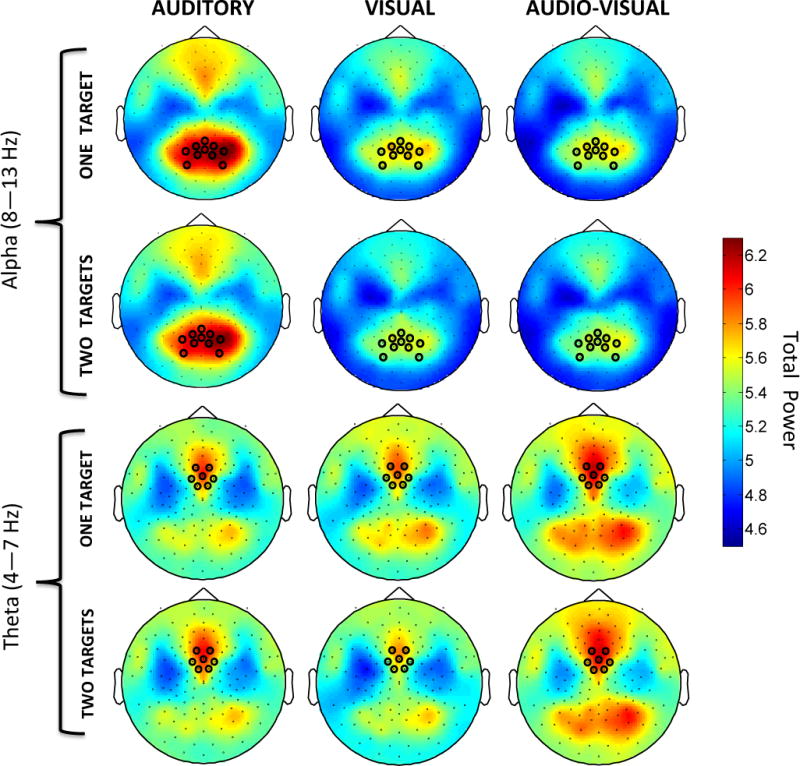
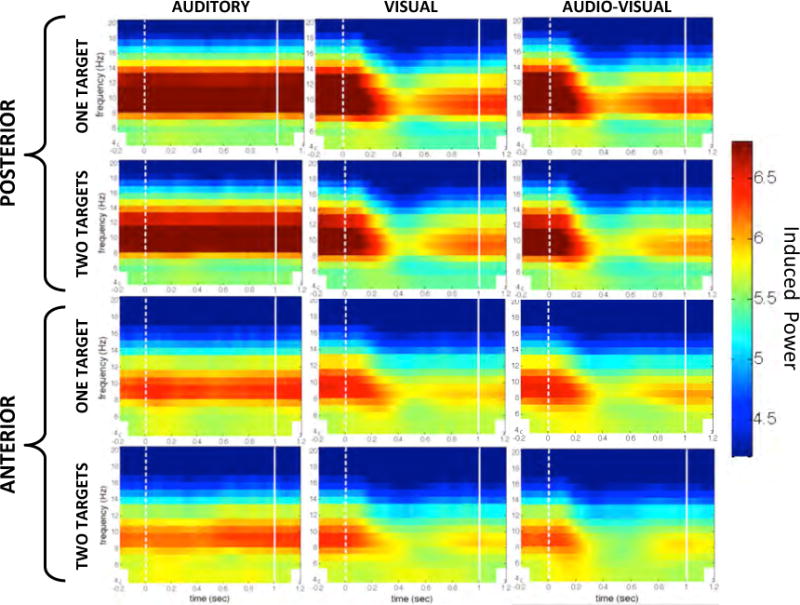
Cortical alpha oscillations (8-13Hz) appear to play a role in suppressing distractions when just one sensory modality is being attended, but do they also contribute when attention is distributed over multiple sensory modalities? For an answer, we examined cortical oscillations in human subjects who were dividing attention between auditory and visual sequences. In Experiment 1, subjects performed an oddball task with auditory, visual, or simultaneous audiovisual sequences in separate blocks, while the electroencephalogram was recorded using high-density scalp electrodes. Alpha oscillations were present continuously over posterior regions while subjects were attending to auditory sequences. This supports the idea that the brain suppresses processing of visual input in order to advantage auditory processing. During a divided-attention audiovisual condition, an oddball (a rare, unusual stimulus) occurred in either the auditory or the visual domain, requiring that attention be divided between the two modalities. Fronto-central theta band (4-7Hz) activity was strongest in this audiovisual condition, when subjects monitored auditory and visual sequences simultaneously. Theta oscillations have been associated with both attention and with short-term memory. Experiment 2 sought to distinguish these possible roles of fronto-central theta activity during multisensory divided attention. Using a modified version of the oddball task from Experiment 1, Experiment 2 showed that differences in theta power among conditions were independent of short-term memory load. Ruling out theta's association with short-term memory, we conclude that fronto-central theta activity is likely a marker of multisensory divided attention.
Keywords: Alpha; Attention; EEG; Multisensory; Oscillations; Theta.
Copyright © 2017 Elsevier Ltd. All rights reserved.
Figures


Similar articles
-
Single-Trial Phase Entrainment of Theta Oscillations in Sensory Regions Predicts Human Associative Memory Performance.J Neurosci. 2018 Jul 11;38(28):6299-6309. doi: 10.1523/JNEUROSCI.0349-18.2018. Epub 2018 Jun 13. J Neurosci. 2018. PMID: 29899027 Free PMC article.
-
Coupling between Theta Oscillations and Cognitive Control Network during Cross-Modal Visual and Auditory Attention: Supramodal vs Modality-Specific Mechanisms.PLoS One. 2016 Jul 8;11(7):e0158465. doi: 10.1371/journal.pone.0158465. eCollection 2016. PLoS One. 2016. PMID: 27391013 Free PMC article. Clinical Trial.
-
Gender difference in the theta/alpha ratio during the induction of peaceful audiovisual modalities.J Integr Neurosci. 2015 Sep;14(3):343-54. doi: 10.1142/S0219635215500181. Epub 2015 Sep 8. J Integr Neurosci. 2015. PMID: 26347507
-
The role of alpha oscillations for illusory perception.Behav Brain Res. 2014 Sep 1;271(100):294-301. doi: 10.1016/j.bbr.2014.06.015. Epub 2014 Jun 13. Behav Brain Res. 2014. PMID: 24931795 Free PMC article. Review.
-
A Rhythmic Theory of Attention.Trends Cogn Sci. 2019 Feb;23(2):87-101. doi: 10.1016/j.tics.2018.11.009. Epub 2018 Dec 24. Trends Cogn Sci. 2019. PMID: 30591373 Free PMC article. Review.
Cited by
-
Music and Visual Art Training Increase Auditory-Evoked Theta Oscillations in Older Adults.Brain Sci. 2022 Sep 27;12(10):1300. doi: 10.3390/brainsci12101300. Brain Sci. 2022. PMID: 36291234 Free PMC article.
-
The Role of Fronto-Central Theta Oscillations in Inter-Sensory Selective Attention.Psychophysiology. 2025 Apr;62(4):e70055. doi: 10.1111/psyp.70055. Psychophysiology. 2025. PMID: 40202268 Free PMC article.
-
Midfrontal theta oscillation encodes haptic delay.Sci Rep. 2021 Aug 23;11(1):17074. doi: 10.1038/s41598-021-95631-1. Sci Rep. 2021. PMID: 34426593 Free PMC article.
-
Deep Neural Network for Visual Stimulus-Based Reaction Time Estimation Using the Periodogram of Single-Trial EEG.Sensors (Basel). 2020 Oct 27;20(21):6090. doi: 10.3390/s20216090. Sensors (Basel). 2020. PMID: 33120869 Free PMC article.
-
Sustained attention in attention-deficit subjects and the impact of binaural beat stimulation evaluated by behavior and EEG.Exp Brain Res. 2025 Sep 12;243(10):211. doi: 10.1007/s00221-025-07154-0. Exp Brain Res. 2025. PMID: 40938421
References
-
- Almeida PR, Ferreira-Santos F, Chaves PL, Paiva TO, Barbosa F, Marques-Teixeira J. Perceived arousal of facial expressions of emotion modulates the N170, regardless of emotional category: Time domain and time-frequency dynamics. International Journal of Psychophysiology. 2016;99:48–56. - PubMed
-
- Arnolds DEAT, Da Silva FHL, Aitink JW, Kamp A, Boeijinga P. The spectral properties of hippocampal EEG related to behaviour in man. Electroencephalography and Clinical Neurophysiology. 1980;50(3–4):324–328. - PubMed
-
- Behroozi M, Daliri MR, Shekarchi B. Eeg phase patterns reflect the representation of semantic categories of objects. Medical and Biological Engineering and Computing. 2016;54:205–221. - PubMed
-
- Bonnefond M, Jensen O. Alpha oscillations serve to protect working memory maintenance against anticipated distracters. Current Biology. 2012;22(20):1969–1974. - PubMed
Publication types
MeSH terms
Grants and funding
LinkOut - more resources
Full Text Sources
Other Literature Sources
