

An improved method for the establishment of a model of Graves' disease in BALB/c mice
- PMID: 28259898
- PMCID: PMC5365023
- DOI: 10.3892/mmr.2017.6181
An improved method for the establishment of a model of Graves' disease in BALB/c mice
Abstract
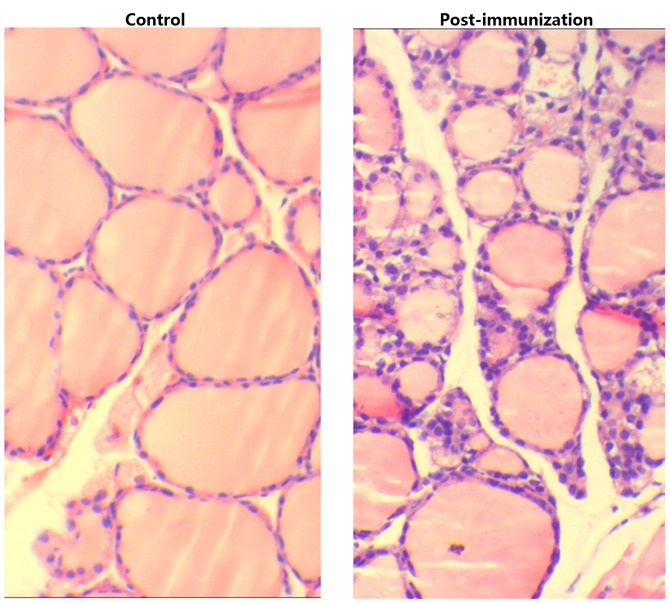
The present study aimed to develop a stable Graves' disease (GD) model in BALB/c mice by immunization and electroporation (EP). A total of 90 mice were divided into experimental (n=50), control (n=20) and blank (n=20) groups. The recombinant plasmid pcDNA3.1/thyroid‑stimulating hormone (TSH) receptor 268 was constructed and injected into the bilateral gastrocnemius of experimental group mice at weeks 1, 4, 7 and 10. Equal volumes of saline were injected into the control and blank groups at the same time. The experimental and control groups were subjected to EP at the same time and location to enhance immunization. The levels of total serum thyroxine (T4) and serum TSH were examined by radioimmunoassay and immunoradiometric assay, respectively. The levels of serum thyrotropin receptor N‑terminal (TRAb N) and C‑terminal (TRAb C) antibodies were assessed by ELISA. Whole body pertechnetate (99mTcO4‑) imaging was performed. Mouse weight and thyroid morphology and pathology were analyzed. The GD BALB/c mouse model was successfully established, with a positive rate of 79.17% (38/48). T4 levels increased from baseline levels of 12.05±4.23 to 52.51±23.58 ng/ml by week 12 (P<0.0001). TSH levels decreased from baseline levels of 5.53±2.78 to 1.43±0.89 µIU/ml by week 12 (P<0.0001). TRAb N antibody levels increased from baseline levels of 0.006±0.002 to 0.278±0.106 mIU/ml by week 12 (P<0.0001). TRAb C antibody levels increased from baseline levels of 11.111±2.808 to 46.701±26.436 arbitrary units/ml by week 12 (P<0.0001). At week 21, TSH levels remained reduced compared with pre‑immunization levels (P<0.0001). Although T4, and TRAb N and C levels decreased, they remained increased compared with preimmunization levels (P<0.0001, P<0.0001, P=0.001). There were no significant alterations in antibody levels between the control and blank groups. Following four immunizations, the uptake of 99mTcO4‑ by the thyroid was significantly increased in the experimental group. The mean weight of the experimental mice was significantly reduced compared with the control and blank groups (all P<0.0001). Furthermore, the thyroid glands of the immunized mice were enlarged and exhibited lymphocyte infiltration, fewer colloid nodules and an increased height of epithelial cells. In conclusion, by injecting recombinant plasmid pcDNA3.1/TSHR268 and EP, a GD mouse model was successfully established.
Figures


Similar articles
-
Mouse model of Graves' orbitopathy induced by the immunization with TSHR A and IGF-1R α subunit gene.J Endocrinol Invest. 2024 Oct;47(10):2507-2519. doi: 10.1007/s40618-024-02344-z. Epub 2024 Apr 25. J Endocrinol Invest. 2024. PMID: 38662129
-
Simultaneous induction of Graves' hyperthyroidism and Graves' ophthalmopathy by TSHR genetic immunization in BALB/c mice.PLoS One. 2017 Mar 20;12(3):e0174260. doi: 10.1371/journal.pone.0174260. eCollection 2017. PLoS One. 2017. PMID: 28319174 Free PMC article.
-
[Effect of Jiakangning Capsule on Thyroid Function and Akt/mTOR Signal Pathway of Graves' Disease Mice: an Experimental Study].Zhongguo Zhong Xi Yi Jie He Za Zhi. 2015 Sep;35(9):1119-24. Zhongguo Zhong Xi Yi Jie He Za Zhi. 2015. PMID: 26591370 Chinese.
-
[Establishment of an animal model for thyroid associated ophthalmopathy by treatment of mice with human thyrotropin receptors-activated splenocytes].Zhonghua Yan Ke Za Zhi. 2006 Dec;42(12):1073-7. Zhonghua Yan Ke Za Zhi. 2006. PMID: 17415963 Chinese.
-
An improved Graves' disease model established by using in vivo electroporation exhibited long-term immunity to hyperthyroidism in BALB/c mice.Endocrinology. 2007 May;148(5):2335-44. doi: 10.1210/en.2006-1077. Epub 2007 Jan 25. Endocrinology. 2007. PMID: 17255207
Cited by
-
Mouse model of Graves' orbitopathy induced by the immunization with TSHR A and IGF-1R α subunit gene.J Endocrinol Invest. 2024 Oct;47(10):2507-2519. doi: 10.1007/s40618-024-02344-z. Epub 2024 Apr 25. J Endocrinol Invest. 2024. PMID: 38662129
-
Specific molecular imaging of BALB/c model mice with Graves' ophthalmopathy based on high expression of insulin-like growth factor 1 receptor.Ann Nucl Med. 2025 Apr;39(4):388-397. doi: 10.1007/s12149-024-02013-4. Epub 2025 Feb 7. Ann Nucl Med. 2025. PMID: 39920417 Free PMC article.
References
MeSH terms
Substances
LinkOut - more resources
Full Text Sources
Other Literature Sources
