

Organic-to-Aqueous Phase Transfer of Cadmium Chalcogenide Quantum Dots using a Sulfur-Free Ligand for Enhanced Photoluminescence and Oxidative Stability
- PMID: 28260836
- PMCID: PMC5333977
- DOI: 10.1021/acs.chemmater.6b03106
Organic-to-Aqueous Phase Transfer of Cadmium Chalcogenide Quantum Dots using a Sulfur-Free Ligand for Enhanced Photoluminescence and Oxidative Stability
Abstract
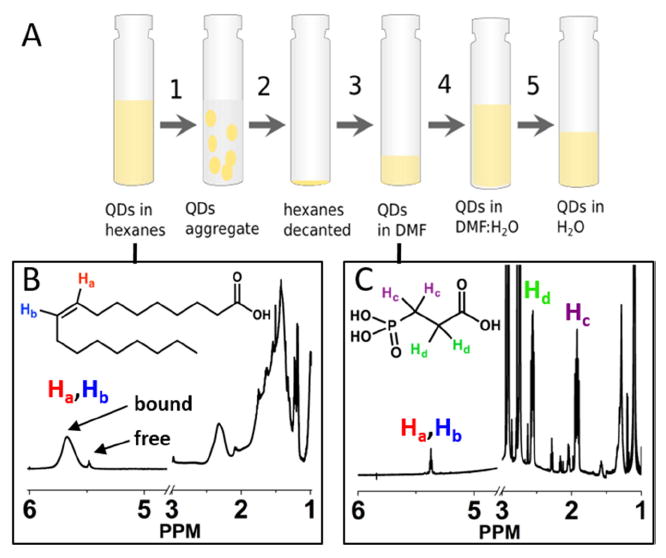
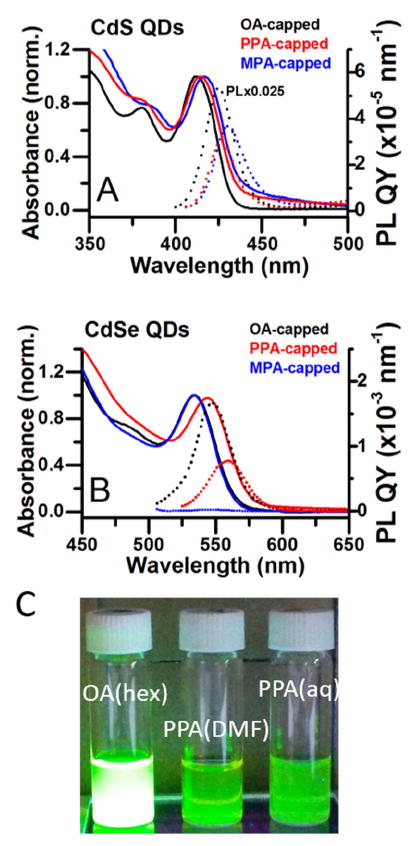
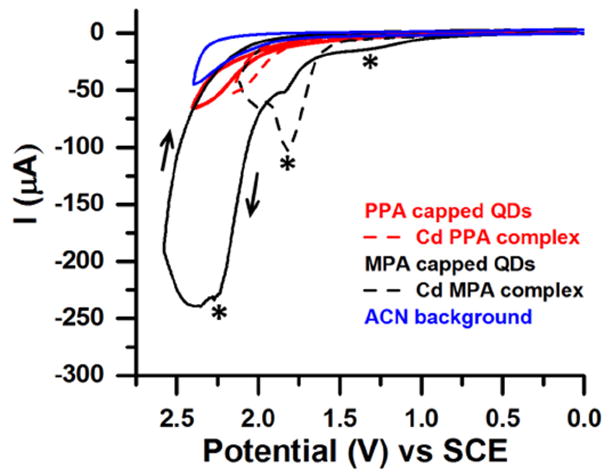
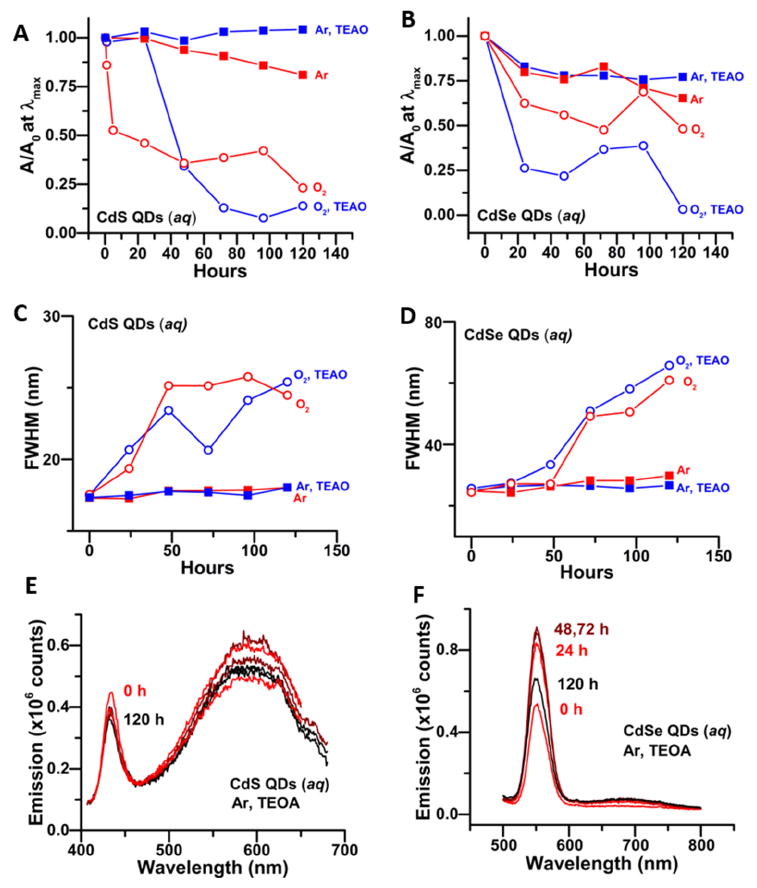
This paper describes a procedure for transferring colloidal CdS and CdSe quantum dots (QDs) from organic solvents to water by exchanging their native hydrophobic ligands for phosphonopropionic acid (PPA) ligands, which bind to the QD surface through the phosphonate group. This method, which uses dimethylformamide as an intermediate transfer solvent, was developed in order to produce high-quality water soluble QDs with neither a sulfur-containing ligand nor a polymer encapsulation layer, both of which have disadvantages in applications of QDs to photocatalysis and biological imaging. CdS (CdSe) QDs were transferred to water with a 43% (48%) yield using PPA. The photoluminescence (PL) quantum yield for PPA-capped CdSe QDs is larger than that for QDs capped with the analogous sulfur-containing ligand, mercaptopropionic acid (MPA), by a factor of four at pH 7, and by up to a factor of 100 under basic conditions. The MPA ligands within MPA-capped QDs oxidize at Eox ~ +1.7 V vs. SCE, whereas cyclic voltammograms of PPA-capped QDs show no discerible oxidation peaks at applied potentials up to +2.5 V vs. SCE. The PPA-capped QDs are chemically and colloidally stable for at least five days in the dark, even in the presence of O2, and are stable when continuously illuminated for five days, when oxygen is excluded and a sacrificial reductant is present to capture photogenerated holes.
Conflict of interest statement
The authors declare no competing financial interests.
Figures
Similar articles
-
Aqueous phase transfer of InP/ZnS nanocrystals conserving fluorescence and high colloidal stability.ACS Nano. 2011 Dec 27;5(12):9392-402. doi: 10.1021/nn203598c. Epub 2011 Nov 8. ACS Nano. 2011. PMID: 22035355
-
The stability and removal of water-dispersed CdSe/CdS core-shell quantum dots from water.Chemosphere. 2017 Oct;185:926-933. doi: 10.1016/j.chemosphere.2017.07.083. Epub 2017 Jul 17. Chemosphere. 2017. PMID: 28747004
-
Room temperature synthesis of PbSe quantum dots in aqueous solution: stabilization by interactions with ligands.Nanoscale. 2012 Feb 21;4(4):1312-20. doi: 10.1039/c2nr11439a. Epub 2012 Jan 25. Nanoscale. 2012. PMID: 22273747 Free PMC article.
-
Review: three synthesis methods of CdX (X = Se, S or Te) quantum dots.IET Nanobiotechnol. 2014 Jun;8(2):59-76. doi: 10.1049/iet-nbt.2012.0028. IET Nanobiotechnol. 2014. PMID: 25014077 Review.
-
Near-Infrared Active Lead Chalcogenide Quantum Dots: Preparation, Post-Synthesis Ligand Exchange, and Applications in Solar Cells.Angew Chem Int Ed Engl. 2019 Apr 8;58(16):5202-5224. doi: 10.1002/anie.201804053. Epub 2019 Feb 21. Angew Chem Int Ed Engl. 2019. PMID: 29878530 Review.
Cited by
-
From Red to Green Luminescence via Surface Functionalization. Effect of 2-(5-Mercaptothien-2-yl)-8-(thien-2-yl)-5-hexylthieno[3,4-c]pyrrole-4,6-dione Ligands on the Photoluminescence of Alloyed Ag-In-Zn-S Nanocrystals.Inorg Chem. 2020 Oct 5;59(19):14594-14604. doi: 10.1021/acs.inorgchem.0c02468. Epub 2020 Sep 17. Inorg Chem. 2020. PMID: 32941018 Free PMC article.
-
Colloidally Stable CdS Quantum Dots in Water with Electrostatically Stabilized Weak-Binding, Sulfur-Free Ligands.Chemistry. 2019 Nov 13;25(63):14469-14474. doi: 10.1002/chem.201903908. Epub 2019 Oct 15. Chemistry. 2019. PMID: 31486120 Free PMC article.
-
Design of an activatable NIR-II nanoprobe for the in vivo elucidation of Alzheimer's disease-related variations in methylglyoxal concentrations.Chem Sci. 2022 Oct 19;13(42):12511-12518. doi: 10.1039/d2sc05242c. eCollection 2022 Nov 2. Chem Sci. 2022. PMID: 36349272 Free PMC article.
-
Turning over on sticky balls: preparation and catalytic studies of surface-functionalized TiO2 nanoparticles.RSC Adv. 2021 Jan 29;11(10):5537-5547. doi: 10.1039/d0ra09319j. eCollection 2021 Jan 28. RSC Adv. 2021. PMID: 35423103 Free PMC article.
-
The SALSAC approach: comparing the reactivity of solvent-dispersed nanoparticles with nanoparticulate surfaces.Nanoscale Adv. 2019 Dec 12;2(2):679-690. doi: 10.1039/c9na00488b. eCollection 2020 Feb 18. Nanoscale Adv. 2019. PMID: 36133249 Free PMC article.
References
-
- Sukhanova A, Devy J, Venteo L, Kaplan H, Artemyev M, Oleinikov V, Klinov D, Pluot M, Cohen JHM, Nabiev I. Biocompatible Fluorescent Nanocrystals for Immunolabeling of Membrane Proteins and Cells. Anal Biochem. 2004;324(1):60–67. - PubMed
-
- Rosenthal SJ, Tomlinson I, Adkins EM, Schroeter S, Adams S, Swafford L, McBride J, Wang Y, DeFelice LJ, Blakely RD. Targeting Cell Surface Receptors with Ligand-conjugated Nanocrystals. J Am Chem Soc. 2002;124(17):4586–4594. - PubMed
-
- Dubertret B, Skourides P, Norris DJ, Noireaux V, Brivanlou AH, Libchaber A. In vivo Imaging of Quantum Dots Encapsulated in Phospholipid Micelles. Science (New York, NY) 2002;298(5599):1759–1762. - PubMed
-
- Chan WCW, Nie S. Quantum Dot Bioconjugates for Ultrasensitive Nonisotopic Detection. Science. 1998;281(5385):2016–2018. - PubMed
-
- Bruchez M, Moronne M, Gin P, Weiss S, Alivisatos AP. Semiconductor Nanocrystals as Fluorescent Biological Labels. Science (New York, NY) 1998;281(5385):2013–2016. - PubMed
Publication types
Grants and funding
LinkOut - more resources
Full Text Sources
Other Literature Sources