Genetic and Pharmacological Inhibition of p38α Improves Locomotor Recovery after Spinal Cord Injury
- PMID: 28261102
- PMCID: PMC5313485
- DOI: 10.3389/fphar.2017.00072
Genetic and Pharmacological Inhibition of p38α Improves Locomotor Recovery after Spinal Cord Injury
Abstract
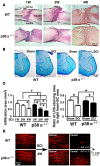
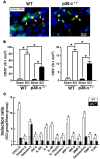
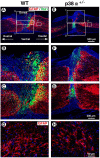
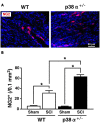
One of the mitogen-activated protein kinases, p38α plays a crucial role in various inflammatory diseases and apoptosis of various types of cells. In this study, we investigated the pathophysiological roles of p38α in spinal cord injury (SCI), using a mouse model. Lateral hemisection at T9 of the SC was performed in wild type (WT) and p38α+/- mice (p38α-/- showed embryonic lethality). p38α+/- mice showed a better functional recovery from SCI-associated paralyzed hindlimbs compared to WT mice at 7 days post-injury (dpi), which remained until 28 dpi (an end time point of monitoring the behavior). In histopathological analysis at 28 dpi, there was more axonal regeneration with remyelination on the caudal side of the lesion epicenter in p38α+/- mice than in WT mice. At 7 dpi, infiltration of inflammatory cells into the lesion and expression of cytokines in the lesion were reduced in p38α+/- mice compared with WT mice. At the same time point, the number of apoptotic oligodendrocytes in the white matter at the caudal boarder of the lesion of p38α+/- mice was lower than that of WT mice. At 14 dpi, more neural and oligodendrocyte precursor cells in the gray matter and white matter, respectively, were observed around the lesion epicenter of p38α+/- mice compared with the case of WT mice. At the same time point, astrocytic scar formation was less apparent in p38α+/- than in WT mice, while compaction of inflammatory immune cells associated with the wound contraction was more apparent in p38α+/- than in WT mice. Furthermore, we verified the effectiveness of oral administration of SB239063, a p38α inhibitor on the hindlimb locomotor recovery after SCI. These results suggest that p38α deeply contributes to the pathogenesis of SCI and that inhibition of p38α is a beneficial strategy to recovery from SCI.
Keywords: p38 mitogen-activated protein kinases; recovery of locomotor activity; spinal cord injury (SCI); tissue degeneration; tissue regeneration.
Figures


Similar articles
-
Stress-Activated Protein Kinases in Spinal Cord Injury: Focus on Roles of p38.Int J Mol Sci. 2018 Mar 15;19(3):867. doi: 10.3390/ijms19030867. Int J Mol Sci. 2018. PMID: 29543752 Free PMC article. Review.
-
An Agonist of the Protective Factor SIRT1 Improves Functional Recovery and Promotes Neuronal Survival by Attenuating Inflammation after Spinal Cord Injury.J Neurosci. 2017 Mar 15;37(11):2916-2930. doi: 10.1523/JNEUROSCI.3046-16.2017. Epub 2017 Feb 13. J Neurosci. 2017. PMID: 28193684 Free PMC article.
-
Neuropsin promotes oligodendrocyte death, demyelination and axonal degeneration after spinal cord injury.Neuroscience. 2007 Aug 10;148(1):175-87. doi: 10.1016/j.neuroscience.2007.05.037. Epub 2007 Jul 12. Neuroscience. 2007. PMID: 17629414
-
Lack of galectin-3 improves the functional outcome and tissue sparing by modulating inflammatory response after a compressive spinal cord injury.Exp Neurol. 2015 Sep;271:390-400. doi: 10.1016/j.expneurol.2015.07.006. Epub 2015 Jul 14. Exp Neurol. 2015. PMID: 26183316
-
Sprouting of axonal collaterals after spinal cord injury is prevented by delayed axonal degeneration.Exp Neurol. 2014 Nov;261:451-61. doi: 10.1016/j.expneurol.2014.07.014. Epub 2014 Jul 28. Exp Neurol. 2014. PMID: 25079366
Cited by
-
Continuous administration of a p38α inhibitor during the subacute phase after transient ischemia-induced stroke in the rat promotes dose-dependent functional recovery accompanied by increase in brain BDNF protein level.PLoS One. 2020 Dec 4;15(12):e0233073. doi: 10.1371/journal.pone.0233073. eCollection 2020. PLoS One. 2020. PMID: 33275615 Free PMC article.
-
Nischarin-siRNA delivered by polyethylenimine-alginate nanoparticles accelerates motor function recovery after spinal cord injury.Neural Regen Res. 2017 Oct;12(10):1687-1694. doi: 10.4103/1673-5374.217348. Neural Regen Res. 2017. PMID: 29171434 Free PMC article.
-
When Good Kinases Go Rogue: GSK3, p38 MAPK and CDKs as Therapeutic Targets for Alzheimer's and Huntington's Disease.Int J Mol Sci. 2021 May 31;22(11):5911. doi: 10.3390/ijms22115911. Int J Mol Sci. 2021. PMID: 34072862 Free PMC article. Review.
-
Stress-Activated Protein Kinases in Spinal Cord Injury: Focus on Roles of p38.Int J Mol Sci. 2018 Mar 15;19(3):867. doi: 10.3390/ijms19030867. Int J Mol Sci. 2018. PMID: 29543752 Free PMC article. Review.
-
Functions of p38 MAP Kinases in the Central Nervous System.Front Mol Neurosci. 2020 Sep 8;13:570586. doi: 10.3389/fnmol.2020.570586. eCollection 2020. Front Mol Neurosci. 2020. PMID: 33013322 Free PMC article. Review.
References
-
- Beck K. D., Nguyen H. X., Galvan M. D., Salazar D. L., Woodruff T. M., Anderson A. J. (2010). Quantitative analysis of cellular inflammation after traumatic spinal cord injury: evidence for a multiphasic inflammatory response in the acute to chronic environment. Brain 133 433–447. 10.1093/brain/awp322 - DOI - PMC - PubMed
LinkOut - more resources
Full Text Sources
Other Literature Sources
Molecular Biology Databases

