Review
. 2017 Feb 14:8:78.
doi: 10.3389/fphys.2017.00078. eCollection 2017.

Low-Frequency Oscillations and Control of the Motor Output

Affiliations
Review

Low-Frequency Oscillations and Control of the Motor Output

Neha Lodha et al. Front Physiol. .

Abstract

A less precise force output impairs our ability to perform movements, learn new motor tasks, and use tools. Here we show that low-frequency oscillations in force are detrimental to force precision. We summarize the recent evidence that low-frequency oscillations in force output represent oscillations of the spinal motor neuron pool from the voluntary drive, and can be modulated by shifting power to higher frequencies. Further, force oscillations below 0.5 Hz impair force precision with increased voluntary drive, aging, and neurological disease. We argue that the low-frequency oscillations are (1) embedded in the descending drive as shown by the activation of multiple spinal motor neurons, (2) are altered with force intensity and brain pathology, and (3) can be modulated by visual feedback and motor training to enhance force precision. Thus, low-frequency oscillations in force provide insight into how the human brain regulates force precision.

Keywords: corticomuscular coherence; force precision; force variability; motor control; voluntary drive.


Figures

Figure 1
Figure 1
Low-frequency oscillations in the force output. (A) The power spectrum of force during various constant contractions (Top). Regardless of the effector performing the task, the majority of the power occurs below 1 Hz. Specifically, over 80% of the power for finger abduction, pinch grip, power grip, and ankle dorsiflexion occurs below 1 Hz. In addition, the peak oscillation is observed below 0.5 Hz. These findings suggest that low-frequency oscillations in force are independent of the type (upper or lower limb) or number (single or multi-digit) of effectors that are necessary to perform the task. (B) Top row shows that the voluntary drive from the higher centers to the spinal motor neurons increases when young adults exert a higher amount of force from 5% (light blue) to 30% (dark blue) MVC (top row) (Neto et al., 2010). The middle row shows that force variability increased with stronger voluntary drive (from 5 to 30% MVC). In the bottom row, we show that oscillations in force below 0.5 Hz also increased with higher voluntary drive (30% MVC). The increase in force variability with voluntary drive was strongly related (R2 = 0.94, p < 0.05; Moon et al., 2014) to increased oscillations in force below 0.5 Hz (bottom row–right). Thus, this figure shows that oscillations in force below 0.5 Hz increase with the strength of the voluntary drive and are detrimental to force precision.
Figure 2
Figure 2
Low-frequency oscillations in aging and neurological disorders. Healthy aging and neurological disorders induce significant structural and functional changes in the brain. This figure shows how low-frequency oscillations increase with aging and brain pathology. (A) Force variability is greater in healthy older adults than young adults. The top row shows the variability in the force output from a young (light blue) and an older adult (gray) during a fine constant force contraction (2% maximum). In the middle row, we show that older adults exhibit greater variability of force (left) and greater oscillations in force below 0.5 Hz (right) (Fox et al., 2013). The bottom row shows that the oscillations in force contribute significantly to the force variability in both young (R2 = 0.9) and older adults (R2 = 0.64). (B) The argument that force oscillations below 0.5 Hz likely originate at the brain is supported from similar findings in patients with brain pathology. In the top row, we provide an example from stroke (Lodha et al., 2013). The coronal slice of the structural MRI scan shows a significant loss of cortical neurons (blue circle) in an individual post-stroke. The power spectrum of grip force (5% MVC) shows that the oscillations in force below 0.5 Hz are dominant in both the individual with stroke (blue) and healthy adult (black). Most importantly, the power from 0 to 0.5 Hz appear to quadruple following stroke. In the middle row, we provide an example from essential tremor (Neely et al., 2015). The axial slice of functional MRI scan shows significant cortical hyperactivity in individuals with essential tremor compared with healthy individuals. The power spectrum of pinch grip force shows that the oscillations in force below 0.5 Hz are dominant in both the individual with essential tremor (red) and the healthy adult (black). The power from 0 to 0.5 Hz appears to be double in the patient with essential tremor. In the bottom row, we provide an example from spinocerebellar ataxia type 6 (SCA6) (Casamento Moran et al., 2015). The sagittal slice of the structural MRI scan shows significant isolated cerebellar degeneration in SCA6. The power spectrum of ankle dorsiflexion force shows that the oscillations in force below 0.5 Hz are dominant in both the individual with SCA6 (green) and the healthy adult (black). The power from 0 to 0.5 Hz appears to be five times greater in the individual with SCA6. Together, the data from healthy older adults and from the individuals with brain pathology, suggest that the origin and regulation of oscillations in force below 0.5 Hz occurs at the brain level.
Figure 3
Figure 3
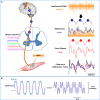
Model pathway and modulation of low-frequency oscillations. (A) On the left, the oscillations in the voluntary drive from 10 to 60 Hz are represented with gold lines from the motor cortex to the spinal motor neuron pool, whereas the low-frequency oscillations are represented as 3 blue arrows. The oscillations in the voluntary drive will activate multiple motor units (motor unit pool) and consequently the whole muscle. On the right, we show how the voluntary drive to the spinal motor neuron pool induces low-frequency oscillations in force. The modulation of whole muscle activity from 10 to 60 Hz is evident in the interference EMG signal (top row). However, to observe the modulation of whole muscle activity at frequencies below 1 Hz requires EMG processing (2nd row). Specifically, to identify the bursts in the activity of the motor units, the interference EMG must be rectified and low-pass filtered (<5 Hz). Recent experiments in our lab (Moon et al., 2014) suggest that EMG bursts occur at frequencies below 0.5 Hz, with the strongest oscillation at ~0.25 Hz. Most importantly, the low-frequency oscillations in EMG bursting are coherent with force oscillations (3rd row) and precede force oscillations with a constant time (~29 ms) (4th row). (B) Based on recent experimental findings in our lab (Fox et al., ; Lodha et al., ; Moon et al., 2014), we simulated the force output with oscillations below (0.25 Hz) and above 0.5 Hz (0.75 Hz). The total fluctuations in the force output (dark blue line) represent the sum of two force oscillations, 0.25 Hz (light blue line) and 0.75 Hz (light purple line). On the left, the total fluctuations in force are represented with the following equation: f1(x)=4sinπ2+sin3π2 On the right, we decrease the total force fluctuations by modulating the amplitude of the force oscillations with the following equation: f2(x)=2sinπ2+2sin3π2 This Figure shows that halving the power in the 0.25 Hz and doubling the power in the 0.75 Hz force oscillations, decreases force fluctuations by 31%.
Figure 4
Figure 4
Modulation of low-frequency oscillations in the force output. (A) In the top row, we show an isometric force contraction performed with and without visual feedback (black screen on the right; Fox et al., 2013). In the middle row, we show that power from 0 to 0.5 Hz decreased with visual feedback (blue bar) compared with no visual feedback (black bar). In contrast, power from 0.5 to1 Hz increased with visual feedback. The bottom row shows the power spectrum of the force output. It shows that the power shifts from low to high frequencies with visual feedback (blue line) relative to no visual feedback (black line). (B) In the top row, we show the bilateral motor training (Kang and Cauraugh, 2014). Individuals with chronic stroke practiced voluntary movements with both arms while the paretic arm received EMG-triggered neuromuscular stimulation for 6 weeks. In the middle row, we show that power from 0 to 0.5 Hz decreased post motor training (red) compared with pre training (pink). In contrast, power from 0.5 to 1 Hz increased post training compared with pre training. The bottom row shows the power spectrum of the force output. It shows that the power shifts from low to high frequencies post training (red line) compared with pre training (pink line). Thus, this figure shows that visual feedback and motor training can reduce oscillations in force below 0.5 Hz by shifting the power to higher frequencies.

Similar articles

Cited by

References

    1. Baker S., Kilner J., Pinches E., Lemon R. (1999). The role of synchrony and oscillations in the motor output. Exp. Brain Res. 128, 109–117. 10.1007/s002210050825 - DOI - PubMed
    1. Baweja H. S., Kennedy D. M., Vu J., Vaillancourt D. E., Christou E. A. (2010). Greater amount of visual feedback decreases force variability by reducing force oscillations from 0–1 and 3–7 Hz. Eur. J. Appl. Physiol. 108, 935–943. 10.1007/s00421-009-1301-5 - DOI - PMC - PubMed
    1. Baweja H. S., Patel B. K., Neto O. P., Christou E. A. (2011). The interaction of respiration and visual feedback on the control of force and neural activation of the agonist muscle. Hum. Mov. Sci. 30, 1022–1038. 10.1016/j.humov.2010.09.007 - DOI - PMC - PubMed
    1. Bernstein N. (1967). The Coordination and Regulation of Movements. Oxford: Pergamon Press.
    1. Callister R., Suwarno N. O., Seals D. R. (1992). Sympathetic activity is influenced by task difficulty and stress perception during mental challenge in humans. J. Physiol. 454, 373–387. 10.1113/jphysiol.1992.sp019269 - DOI - PMC - PubMed

LinkOut - more resources