Howler monkey foraging ecology suggests convergent evolution of routine trichromacy as an adaptation for folivory
- PMID: 28261454
- PMCID: PMC5330884
- DOI: 10.1002/ece3.2716
Howler monkey foraging ecology suggests convergent evolution of routine trichromacy as an adaptation for folivory
Abstract
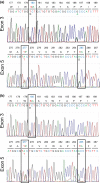
Primates possess remarkably variable color vision, and the ecological and social factors shaping this variation remain heavily debated. Here, we test whether central tenants of the folivory hypothesis of routine trichromacy hold for the foraging ecology of howler monkeys. Howler monkeys (genus Alouatta) and paleotropical primates (Parvorder: Catarrhini) have independently acquired routine trichromacy through fixation of distinct mid- to long-wavelength-sensitive (M/LWS) opsin genes on the X-chromosome. The presence of routine trichromacy in howlers, while other diurnal neotropical monkeys (Platyrrhini) possess polymorphic trichromacy, is poorly understood. A selective force proposed to explain the evolution of routine trichromacy in catarrhines-reliance on young, red leaves-has received scant attention in howlers, a gap we fill in this study. We recorded diet, sequenced M/LWS opsin genes in four social groups of Alouatta palliata, and conducted colorimetric analysis of leaves consumed in Sector Santa Rosa, Costa Rica. For a majority of food species, including Ficus trees, an important resource year-round, young leaves were more chromatically conspicuous from mature leaves to trichromatic than to hypothetical dichromatic phenotypes. We found that 18% of opsin genes were MWS/LWS hybrids; when combined with previous research, the incidence of hybrid M/LWS opsins in this species is 13%. In visual models of food discrimination ability, the hybrid trichromatic phenotype performed slightly poorer than normal trichromacy, but substantially better than dichromacy. Our results provide support for the folivory hypothesis of routine trichromacy. Similar ecological pressures, that is, the search for young, reddish leaves, may have driven the independent evolution of routine trichromacy in primates on separate continents. We discuss our results in the context of balancing selection acting on New World monkey opsin genes and hypothesize that howlers experience stronger selection against dichromatic phenotypes than other sympatric species, which rely more heavily on cryptic foods.
Keywords: Alouatta; Ficus; color vision; molecular evolution; opsin; polymorphism; primate evolution; sensory ecology.
Figures


Similar articles
-
Color Vision Variation as Evidenced by Hybrid L/M Opsin Genes in Wild Populations of Trichromatic Alouatta New World Monkeys.Int J Primatol. 2014;35(1):71-87. doi: 10.1007/s10764-013-9705-9. Epub 2013 Aug 23. Int J Primatol. 2014. PMID: 24523565 Free PMC article.
-
Uniform trichromacy in Alouatta caraya and Alouatta seniculus: behavioural and genetic colour vision evaluation.Front Zool. 2021 Jul 8;18(1):36. doi: 10.1186/s12983-021-00421-0. Front Zool. 2021. PMID: 34238318 Free PMC article.
-
Visual detection and fruit selection by the mantled howler monkey (Alouatta palliata).Am J Primatol. 2020 Oct;82(10):e23186. doi: 10.1002/ajp.23186. Epub 2020 Aug 19. Am J Primatol. 2020. PMID: 32812274
-
Color vision diversity and significance in primates inferred from genetic and field studies.Genes Genomics. 2016;38:779-791. doi: 10.1007/s13258-016-0448-9. Epub 2016 Jul 6. Genes Genomics. 2016. PMID: 27594978 Free PMC article. Review.
-
Fruits, foliage and the evolution of primate colour vision.Philos Trans R Soc Lond B Biol Sci. 2001 Mar 29;356(1407):229-83. doi: 10.1098/rstb.2000.0773. Philos Trans R Soc Lond B Biol Sci. 2001. PMID: 11316480 Free PMC article. Review.
Cited by
-
Anatomy and dietary specialization influence sensory behaviour among sympatric primates.Proc Biol Sci. 2022 Aug 31;289(1981):20220847. doi: 10.1098/rspb.2022.0847. Epub 2022 Aug 17. Proc Biol Sci. 2022. PMID: 35975434 Free PMC article.
-
Coloration in Mammals.Trends Ecol Evol. 2020 Apr;35(4):357-366. doi: 10.1016/j.tree.2019.12.008. Epub 2020 Jan 22. Trends Ecol Evol. 2020. PMID: 31980234 Free PMC article. Review.
-
Can African elephants use leaf colour as a visual cue when making foraging decisions?Anim Cogn. 2025 Jun 13;28(1):46. doi: 10.1007/s10071-025-01972-z. Anim Cogn. 2025. PMID: 40514633 Free PMC article.
-
Through cross-disciplinary collaboration.Primates. 2024 Jan;65(1):7-13. doi: 10.1007/s10329-023-01115-3. Epub 2024 Jan 10. Primates. 2024. PMID: 38198096 No abstract available.
-
Platyrrhine color signals: New horizons to pursue.Evol Anthropol. 2019 Sep;28(5):236-248. doi: 10.1002/evan.21798. Epub 2019 Oct 14. Evol Anthropol. 2019. PMID: 31609040 Free PMC article.
References
-
- Altmann, J. (1974). Observational study of behavior: Sampling methods. Behaviour, 49, 227–267. - PubMed
-
- Amato, K. R. , & Garber, P. A. (2014). Nutrition and foraging strategies of the black howler monkey (Alouatta pigra) in Palenque National Park, Mexico. American Journal of Primatology, 76, 774–787. - PubMed
-
- Behie, A. M. , & Pavelka, M. S. M. (2015). Fruit as a key factor in howler monkey population density: Conservation implications In Kowalewski M. M., Garber P. A., Cortés‐Ortiz L., Urbani B., & Youlatos D. (Eds.), Howler monkeys (pp. 357–382). New York: Springer.
-
- Bennett, A. T. D. , & Thery, M. (2007). Avian color vision and coloration: Multidisciplinary evolutionary biology. The American Naturalist, 169, S1–S6. - PubMed
LinkOut - more resources
Full Text Sources
Other Literature Sources
Miscellaneous

