. 2016 Dec;1(1):17-28.
doi: 10.1007/s41127-016-0001-2. Epub 2016 Aug 3.

Safety and Efficacy of A High Performance Graphene-Based Magnetic Resonance Imaging Contrast Agent for Renal Abnormalities

Affiliations

Safety and Efficacy of A High Performance Graphene-Based Magnetic Resonance Imaging Contrast Agent for Renal Abnormalities

Shruti Kanakia et al. Graphene Technol. 2016 Dec.

Abstract

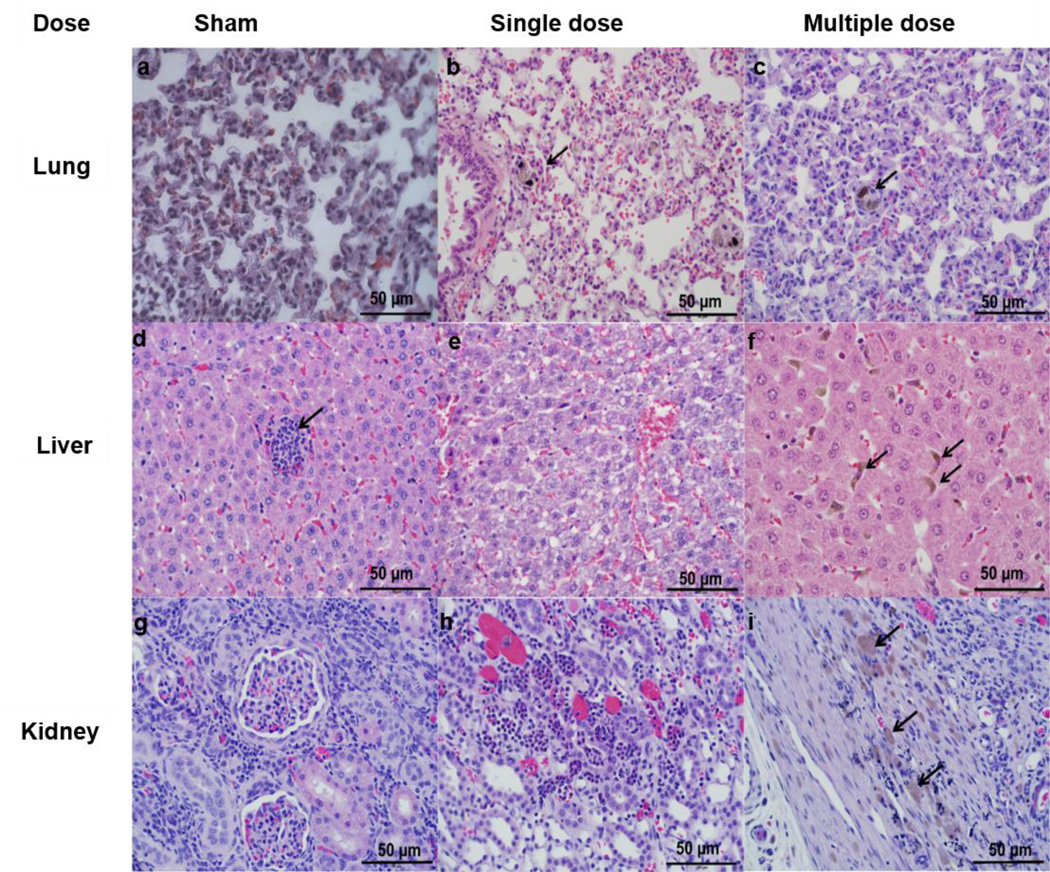
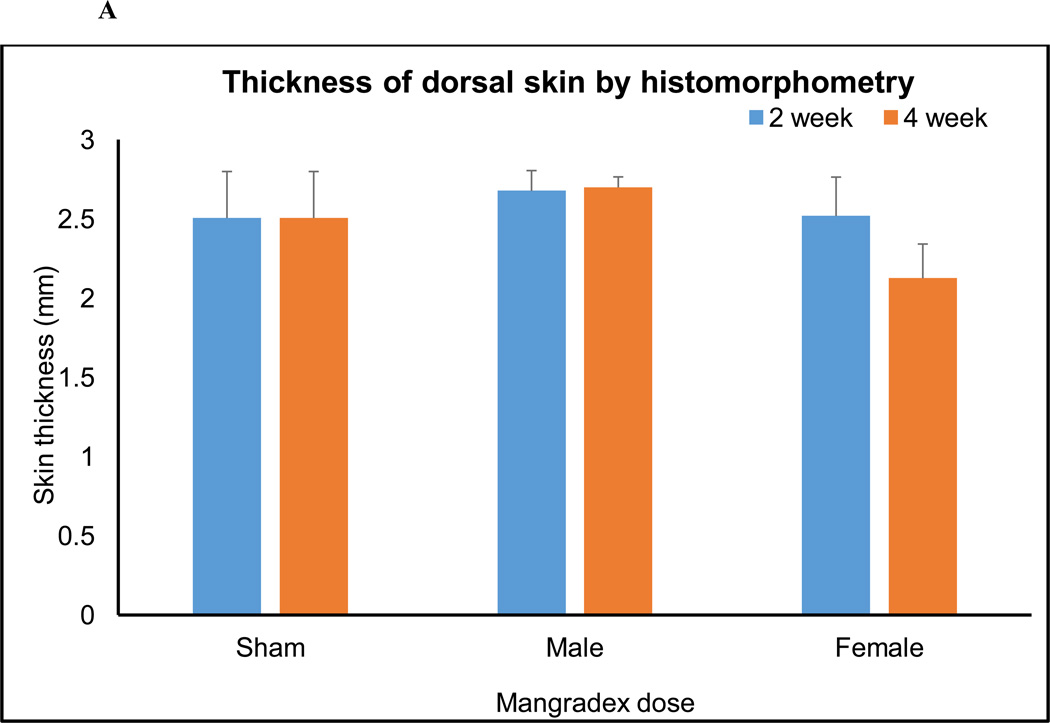
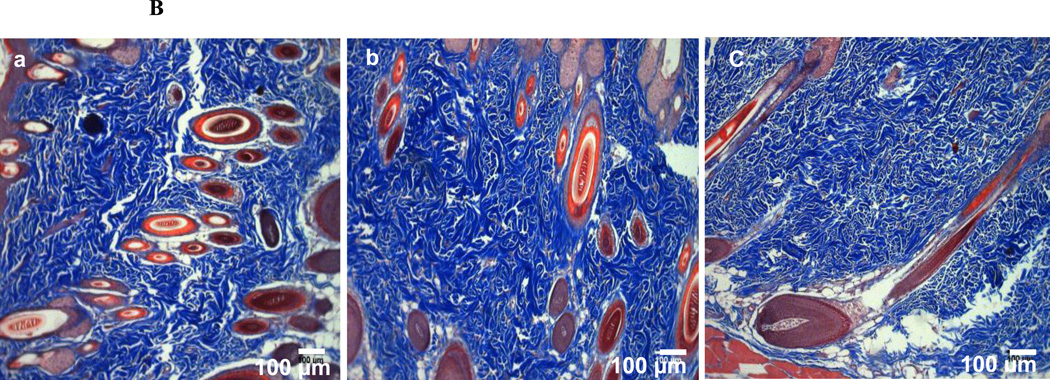
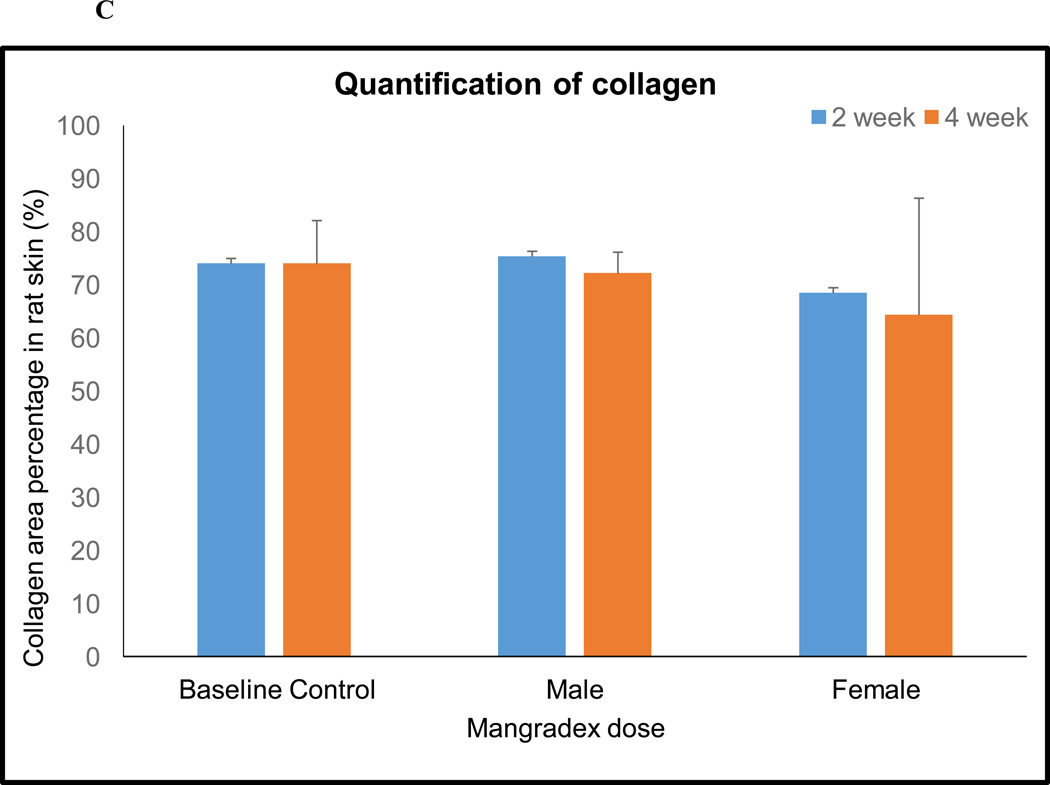
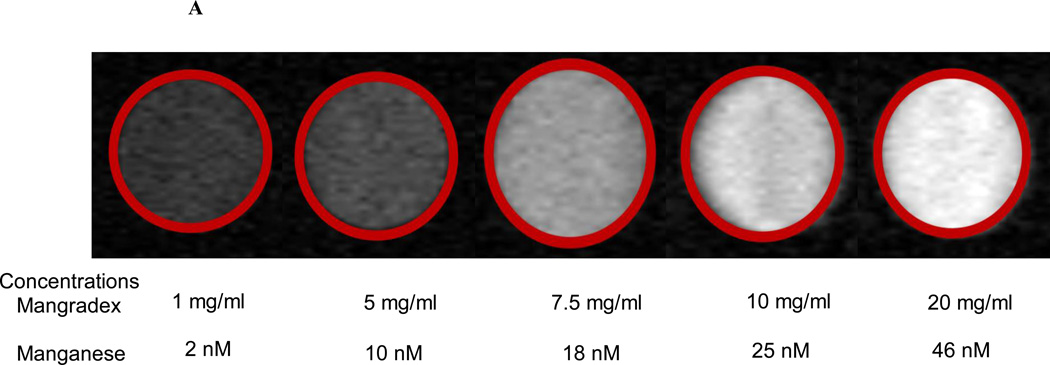
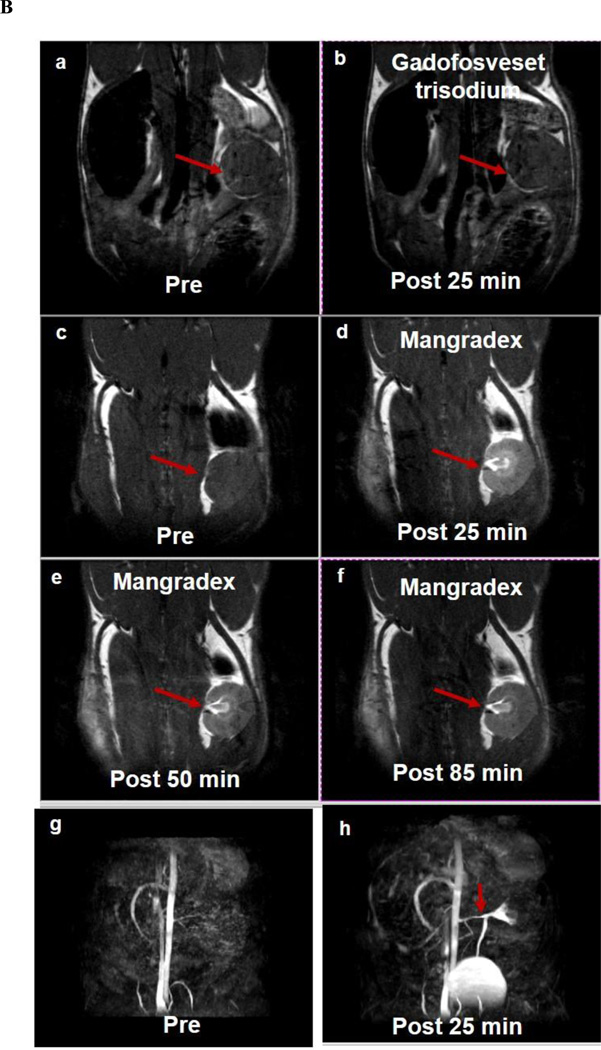
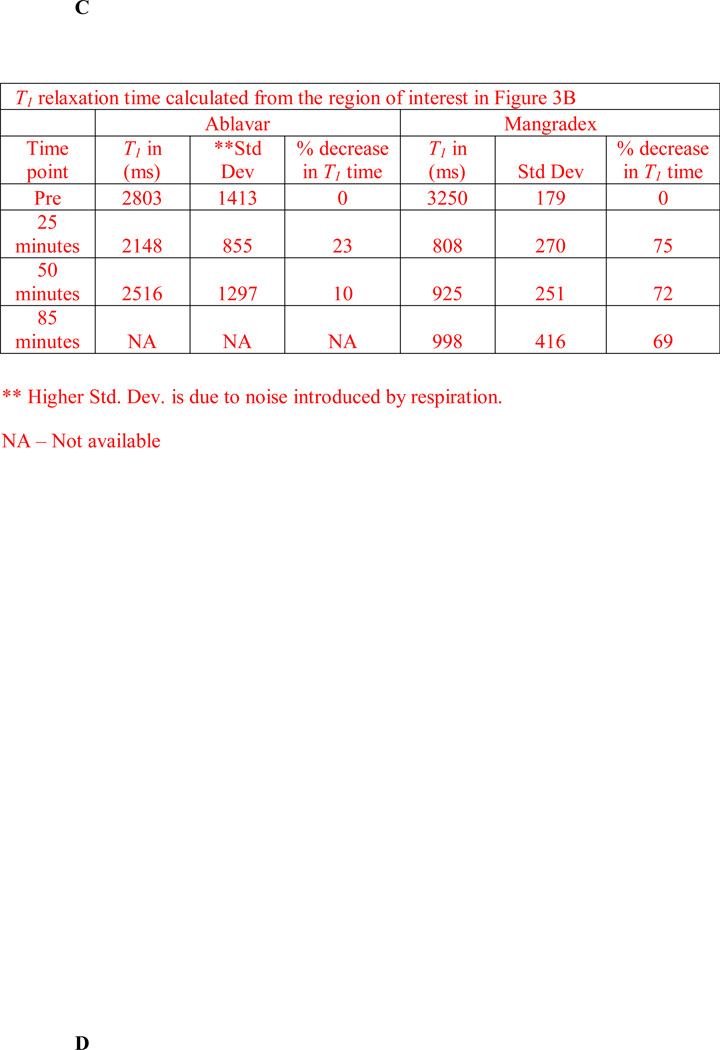
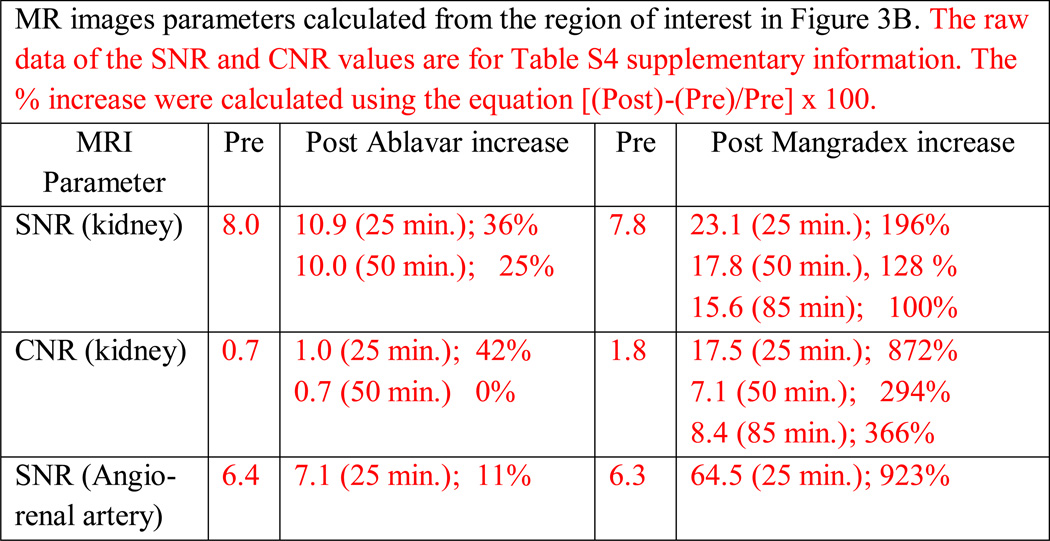
The etiology of renal insufficiency includes primary (e.g polycystic kidney disease) or secondary (e.g. contrast media, diabetes) causes. The regulatory restrictions placed on the use of contrast agents (CAs) for non-invasive imaging modalities such as X-ray computed tomography (CT) and magnetic resonance imaging (MRI) affects the clinical management of these patients. With the goal to develop a next-generation CA for unfettered use for renal MRI, here we report, in a rodent model of chronic kidney disease, the preclinical safety and efficacy of a novel nanoparticle CA comprising of manganese (Mn2+) ions intercalated graphene coated with dextran (hereafter called Mangradex). Nephrectomized rats received single or 5 times/week repeat (2 or 4 weeks) intravenous (IV) injections of Mangradex at two potential (low = 5 mg/kg, and high = 50 mg/kg) therapeutic doses. Histopathology results indicate that Mangradex does not elicit nephrogenic systemic fibrosis (NSF)-like indicators or questionable effects on vital organs of rodents. MRI at 7 Tesla magnetic field was performed on these rats immediately after IV injections of Mangradex at one potential therapeutic dose (25 mg/kg, [Mn2+] = 60 nmoles/kg) for 90 minutes. The results indicated significant (>100%) and sustained contrast enhancement in the kidney and renal artery at these low paramagnetic ion (Mn2+) concentration; 2 orders of magnitude lower than the paramagnetic ion concentration in a typical clinical dose of long circulating Gd3+-based MRI CA gadofosveset trisodium. The results open avenues for further development of Mangradex as a MRI CA to diagnose and monitor abnormalities in renal anatomy and vasculature.

Keywords: Chronic Kidney Disease; Contrast Agent; Gadolinium; Magnetic Resonance Imaging; Mangradex; Nephrogenic Systemic Fibrosis.


Conflict of interest statement

Conflict of Interest Disclosure: Stony Brook University, along with its researchers, has filed patents related to the technology reported in this article. If licensing or commercialization occurs, the researchers are entitled to standard royalties. Balaji Sitharaman has financial interest in Theragnostic Technologies Inc., which, however, did not support this work.

Figures

Figure 1
Figure 1
Representative high (400X) magnification photomicrographs illustrating histopathology of major organs from 5/6 Nephrex animals for sham, and treated with single and multiple dose of 50 mg/kg of GNP-Dex. Lungs a) sham - without diagnostic abnormality, b) single dose - pulmonary parenchyma with aggregates of granular brown pigment (arrow) within alveolar macrophages and microvascular spaces, c) multiple doses - focal aggregates (arrow) within alveolar vascular space. Liver d) sham - presence of micro abscess (arrow) in liver, potentially related to reactive/inflammatory changes resulting from the 5/6 Nephrex surgery (micro abscesses were not detected in other sham or treated animals), e) single dose - without diagnostic abnormality, f) multiple doses - pigments (arrows) in Kupffer cells suggestive of the presence of graphene nanoparticles. Kidney - g) sham, h) single dose – showing acute inflammation (by presence of neutrophils) related to 5/6 Nephrex surgery, and i) multiple dose -showing acute inflammation related to 5/6 Nephrex surgery along with the presence of brown pigments (arrows).
Figure 2
Figure 2
A) Thickness of dorsal skin in 5/6 Nephrex rats given multiple doses of 50 mg/kg for 2 weeks or 4 weeks by histomorphometric image analysis using Image J. Analysis shows no statistically significant differences in collagen concentration in skin among test and control animals (mean ± standard deviation for n= 20; (p < 0.05)). B) Histology of 5/6 Nephrex rat skin stained with Masson’s Trichrome (MT) staining. This stains collagen fibers brilliant blue and is commonly used to determine collagen fiber concentration, tissue fibrosis or abnormal deposition of collagen fibers. a) female rat given multiple doses of 50 mg/kg of Mangradex; b) male rat given multiple doses of 50 mg/kg of Mangradex, c) control rat given multiple doses of mannitol. C) Quantification of collagen in 5/6 Nephrex rats given multiple doses of 50 mg/kg for 2 weeks or 4 weeks using Masson’s trichrome staining. Analysis shows no statistically significant differences in collagen concentration in skin among test and control animals (mean ± standard deviation for n= 20; (p < 0.05)).
Figure 2
Figure 2
A) Thickness of dorsal skin in 5/6 Nephrex rats given multiple doses of 50 mg/kg for 2 weeks or 4 weeks by histomorphometric image analysis using Image J. Analysis shows no statistically significant differences in collagen concentration in skin among test and control animals (mean ± standard deviation for n= 20; (p < 0.05)). B) Histology of 5/6 Nephrex rat skin stained with Masson’s Trichrome (MT) staining. This stains collagen fibers brilliant blue and is commonly used to determine collagen fiber concentration, tissue fibrosis or abnormal deposition of collagen fibers. a) female rat given multiple doses of 50 mg/kg of Mangradex; b) male rat given multiple doses of 50 mg/kg of Mangradex, c) control rat given multiple doses of mannitol. C) Quantification of collagen in 5/6 Nephrex rats given multiple doses of 50 mg/kg for 2 weeks or 4 weeks using Masson’s trichrome staining. Analysis shows no statistically significant differences in collagen concentration in skin among test and control animals (mean ± standard deviation for n= 20; (p < 0.05)).
Figure 3
Figure 3
A) At 7T magnetic field T1 weighted MRI phantom images of Mangradex at concentrations 1, 5, 7.5, 10 and 20 mg/ml. Also shown for comparison are corresponding manganese concentrations. B) In vivo MRI (a–f) Representative T1 weighted MR images of pelvic region (coronal view) that show the subtotally nephrectomized (SNx) rat kidney (red arrow) before (a) and 25 minutes after (b) injection of Ablavar (control); before (c) and 25 (d), 50 (e) and 85 (f) minutes after injection of Mangradex. (g,h) Representative MR angiograms (head of the rat is on the right side) of pelvic region that show the renal artery (red arrows) before (g) and 25 (h) minutes after injection of Mangradex. C) Table showing in vivo T1 relaxation time and % decrease in the region of interest before and 25, 50 and 85 minutes after injection of Mangradex at 25 mg/kg (60 nmoles/kg of manganese) and Ablavar (60 nmoles/kg of gadolinium). D) A table showing % increase in T1 relaxation time post injection of Ablavar and Mangradex.
Figure 3
Figure 3
A) At 7T magnetic field T1 weighted MRI phantom images of Mangradex at concentrations 1, 5, 7.5, 10 and 20 mg/ml. Also shown for comparison are corresponding manganese concentrations. B) In vivo MRI (a–f) Representative T1 weighted MR images of pelvic region (coronal view) that show the subtotally nephrectomized (SNx) rat kidney (red arrow) before (a) and 25 minutes after (b) injection of Ablavar (control); before (c) and 25 (d), 50 (e) and 85 (f) minutes after injection of Mangradex. (g,h) Representative MR angiograms (head of the rat is on the right side) of pelvic region that show the renal artery (red arrows) before (g) and 25 (h) minutes after injection of Mangradex. C) Table showing in vivo T1 relaxation time and % decrease in the region of interest before and 25, 50 and 85 minutes after injection of Mangradex at 25 mg/kg (60 nmoles/kg of manganese) and Ablavar (60 nmoles/kg of gadolinium). D) A table showing % increase in T1 relaxation time post injection of Ablavar and Mangradex.

Similar articles

References

    1. Hoste EAJ, Schurgers M. Epidemiology of acute kidney injury: How big is the problem? Critical Care Medicine. 2008;36:S146–S151. - PubMed
    1. Coresh JSESLA, et al. Prevalence of chronic kidney disease in the United States. JAMA: The Journal of the American Medical Association. 2007;298:2038–2047. - PubMed
    1. Robinson BE. Epidemiology of chronic kidney disease and anemia. Journal of the American Medical Directors Association. 2006;7:S3–S6. - PubMed
    1. Roggeri DP, Roggeri A, Salomone M. Chronic Kidney Disease: Evolution of Healthcare Costs and Resource Consumption from Predialysis to Dialysis in Piedmont Region, Italy. Advances in Nephrology. 2014;2014:6.
    1. Murphree DD, Thelen SM. Chronic kidney disease in primary care. Journal of the American Board of Family Medicine. 2010;23:542–550. - PubMed

LinkOut - more resources