. 2017 Mar 6:6:e25114.
doi: 10.7554/eLife.25114.

Plant immune and growth receptors share common signalling components but localise to distinct plasma membrane nanodomains

Affiliations

Plant immune and growth receptors share common signalling components but localise to distinct plasma membrane nanodomains

Christoph A Bücherl et al. Elife. .

Abstract

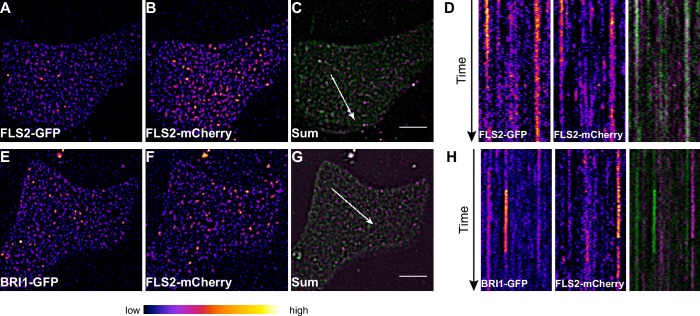
Cell surface receptors govern a multitude of signalling pathways in multicellular organisms. In plants, prominent examples are the receptor kinases FLS2 and BRI1, which activate immunity and steroid-mediated growth, respectively. Intriguingly, despite inducing distinct signalling outputs, both receptors employ common downstream signalling components, which exist in plasma membrane (PM)-localised protein complexes. An important question is thus how these receptor complexes maintain signalling specificity. Live-cell imaging revealed that FLS2 and BRI1 form PM nanoclusters. Using single-particle tracking we could discriminate both cluster populations and we observed spatiotemporal separation between immune and growth signalling platforms. This finding was confirmed by visualising FLS2 and BRI1 within distinct PM nanodomains marked by specific remorin proteins and differential co-localisation with the cytoskeleton. Our results thus suggest that signalling specificity between these pathways may be explained by the spatial separation of FLS2 and BRI1 with their associated signalling components within dedicated PM nanodomains.

Keywords: A. thaliana; cell biology; growth; immunity; microdomain; plant biology; plasma membrane; receptor kinase; signaling.


Conflict of interest statement

The authors declare that no competing interests exist.

Figures

Figure 1.
Figure 1.. FLS2 and BRI1 form receptor clusters within the plasma membrane.
(A, B) Plasma membrane localisation of FLS2-GFP (A) and BRI1-GFP (B) in epidermal cells of Arabidopsis seedling cotyledons. (C, D) Plasma membrane localisation of FLS2-GFP (C) and BRI1-GFP (D) after transient expression in epidermal leaf cells of N. benthamiana. (E) Quantification of FLS2-GFP and BRI1-GFP plasma membrane receptor cluster diameters in epidermal cells of Arabidopsis cotyledons and after transient expression in N. benthamiana leaves. The coloured data points represent the technical replicates of 3 independent experiments. No statistical differences were observed based on two-tailed heteroscedastic t-tests and a Bonferroni multiple hypothesis correction. (F) Quantification of FLS2-GFP and BRI1-GFP plasma membrane receptor cluster densities in epidermal cells of Arabidopsis seedlings and after heterologous expression in N. benthamiana. The coloured data points represent the technical replicates of 3 independent experiments. No statistical differences were observed based on two-tailed heteroscedastic t-tests and a Bonferroni multiple hypothesis correction. The presented images were acquired using confocal laser scanning microscopy (CLSM). Scale bars represent 5 µm. The colour bar represents the colour code for fluorescence intensities. Black dots represent outliers. Red arrowheads indicate endosomal compartments of BRI1-GFP. Endosomal compartments were omitted for quantitative analysis. DOI: http://dx.doi.org/10.7554/eLife.25114.003
Figure 1—figure supplement 1.
Figure 1—figure supplement 1.. Illustration of the image processing steps for emphasising receptor cluster formation.
(A) Raw data of a confocal micrograph showing the fluorescence intensity of FLS2-GFP in grey scale. (B) Confocal micrograph of FLS2-GFP fluorescence intensity as shown in (A) but using the ‘fire’ lookup table. (C) Confocal micrograph of FLS2-GFP fluorescence intensity as shown in (A) after applying the LoG3D plugin. (D) Confocal micrograph of FLS2-GFP fluorescence intensity as shown in (C) but using the ‘fire’ lookup table. To emphasise our observation of receptor clusters, we applied a spot-enhancing filter on the presented images and time series. The presented images were acquired using confocal laser scanning microscopy (CLSM). The scale bar represents 5 µm. DOI: http://dx.doi.org/10.7554/eLife.25114.004
Figure 1—figure supplement 2.
Figure 1—figure supplement 2.. Plasma membrane localisation of FLS2 and BRI1 with respect to the cytoskeleton.
(A I–A IV) Confocal micrographs of actin filaments visualised using LifeAct-tRFP (A I) and FLS2-GFP (A II) in epidermal leaf cells of Arabidopsis seedling cotyledons as well as the merged image (A III) and a 3D surface plot of the raw data (A IV). (B I–B IV) Confocal micrographs of actin filaments visualised using LifeAct-tRFP (B I) and FLS2-GFP (B II) after transient co-expression in epidermal leaf cells of N. benthamiana as well as the merged image (B III) and a 3D surface plot of the raw data (B IV). (C I–C IV) Confocal micrographs of actin filaments visualised using LifeAct-tRFP (C I) and BRI1-GFP (C II) in epidermal leaf cells of Arabidopsis seedling cotyledons as well as the merged image (C III) and a 3D surface plot of the raw data (C IV). (D I–D IV) Confocal micrographs of actin filaments visualised using LifeAct-tRFP (D I) and BRI1-GFP (D II) after transient co-expression in epidermal leaf cells of N. benthamiana as well as the merged image (D III) and a 3D surface plot of the raw data (D IV). (E I–E IV) Confocal micrographs of TUB5-mCherry (E I) and FLS2-GFP (E II) in epidermal leaf cells of Arabidopsis seedling cotyledons as well as the merged image (E III) and a 3D surface plot of the raw data (E IV). (F I–F IV) Confocal micrographs of TUA6-GFP (F I) and FLS2-mCherry (F II) after transient co-expression in epidermal leaf cells of N. benthamiana as well as the merged image (F III) and a 3D surface plot of the raw data (F IV). (G I–G IV) Confocal micrographs of TUB5-mCherry (G I) and BRI1-GFP (G II) in epidermal leaf cells of Arabidopsis seedling cotyledons as well as the merged image (G III) and a 3D surface plot of the raw data (G IV). (H I–H IV) Confocal micrographs of TUA6-GFP (H I) and BRI1-mRFP (H II) after transient co-expression in epidermal leaf cells of N. benthamiana as well as the merged image (H III) and a 3D surface plot of the raw data (H IV). Fluorescence signals of cytoskeleton components are shown in magenta, fluorescence signals of FLS2 or BRI1 receptors are shown in green. The abbreviation tRFP stands for TagRFP. Scale bars represent 5 µm. The image series indicate that FLS2 and BRI1 receptor clusters repeatedly localised on top of actin filaments as indicated by white arrows in the respective 3D surface plots. In contrast, FLS2 and, to a minor extend, BRI1 receptors were largely excluded from plasma membrane areas that co-localised with cortical microtubules as indicated by white arrows in the respective 3D surface plots. DOI: http://dx.doi.org/10.7554/eLife.25114.005
Figure 2.
Figure 2.. FLS2 receptor clusters are more stable than BRI1 clusters.
(A, B) Plasma membrane localisation of FLS2-GFP (A) and BRI-GFP (B) in epidermal cells of Arabidopsis seedling cotyledons. (C, D) Plasma membrane localisation of FLS2-GFP (C) and BRI1-GFP (D) after transient expression in epidermal leaf cells of N. benthamiana. (E) Kymograph analysis of FLS2-GFP and BRI1-GFP plasma membrane receptor clusters in epidermal cells of Arabidopsis seedling cotyledons and after transient expression in N. benthamiana. Kymographs were obtained from VAEM time series with a temporal resolution of 0.5 s over 250 frames along the indicated arrows in micrographs (A) to (D). (F) Quantification of FLS2-GFP and BRI1-GFP receptor cluster displacements in epidermal cells of Arabidopsis seedling cotyledons obtained from VAEM time series with a temporal resolution of 0.5 s over 250 frames. The coloured data points represent the technical replicates of 4 independent experiments. No statistical differences were observed based on two-tailed heteroscedastic t-tests and a Bonferroni multiple hypothesis correction. (G) Quantification of FLS2-GFP and BRI1-GFP receptor cluster lifetimes in epidermal cells of Arabidopsis seedling cotyledons obtained from VAEM time series with a temporal resolution of 0.5 s over 250 frames. The coloured data points represent the technical replicates of 4 independent experiments. The indicated p-values were obtained using a two-tailed heteroscedastic t-test and a Bonferroni multiple hypothesis correction. The presented images were acquired using variable angle epi-fluorescence microscopy (VAEM). Scale bars represent 5 µm. The colour bar represents the colour code for fluorescence intensities. Black dots represent outliers. DOI: http://dx.doi.org/10.7554/eLife.25114.006
Figure 2—figure supplement 1.
Figure 2—figure supplement 1.. The stability of FLS2 clusters depends on the PM lipid composition.
(A, B) VAEM micrograph of FLS2-GFP (A) and a kymograph of the corresponding VAEM time series (B) after mock treatment. (C, D) VAEM micrograph of BRI1-GFP (C) and a kymograph of the corresponding VAEM time series (D) after mock treatment. (E, F) VAEM micrograph of FLS2-GFP (E) and a kymograph of the corresponding VAEM time series (F) after methyl-β-cyclodextrin (MβCD) treatment. (G, H) VAEM micrograph of BRI1-GFP (G) and a kymograph of the corresponding VAEM time series (H) after MβCD treatment. Application of MβCD, which extracts sterols from the PM, destabilised FLS2-GFP and BRI1-GFP clusters as indicated by the kymographs in (F) and (H). The VAEM micrograph and time series was acquired from a 5 day old Arabidopsis seedling cotyledon after 20 min incubation in 30 mM MβCD, dissolved in liquid MS medium, or mock solution (liquid MS medium). The white arrows in (A), (C), (E) and (G) indicate the spatial dimensions of the kymographs. The scale bars represent 5 µm. DOI: http://dx.doi.org/10.7554/eLife.25114.007
Figure 3.
Figure 3.. BRs reduce BRI1 cluster displacement within the plasma membrane.
(A) Quantification of FLS2-GFP and BRI1-GFP receptor cluster displacements in epidermal cells of Arabidopsis seedling cotyledons after 2 days in liquid medium containing 5 µM BRZ. (B) Quantification of FLS2-GFP and BRI1-GFP receptor cluster lifetimes in epidermal cells of Arabidopsis seedling cotyledons after 2 days in liquid medium containing 5 µM BRZ. (C) Time-dependent quantification of short-range FLS2-GFP and BRI1-GFP receptor cluster displacements in epidermal cells of Arabidopsis seedling cotyledons after BRZ-treatment and subsequent application of 100 nM BL. (D) Time-dependent quantification of short FLS2-GFP and BRI1-GFP receptor cluster lifetimes in epidermal cells of Arabidopsis seedling cotyledons after BRZ-treatment and subsequent application of 100 nM BL. (E) Time-dependent quantification of medium-range FLS2-GFP and BRI1-GFP receptor cluster displacements in epidermal cells of Arabidopsis seedling cotyledons after BRZ-treatment and subsequent application of 100 nM BL. (F) Time-dependent quantification of medium FLS2-GFP and BRI1-GFP receptor cluster lifetimes in epidermal cells of Arabidopsis seedling cotyledons after BRZ-treatment and subsequent application of 100 nM BL. (G) Time-dependent quantification of long-range FLS2-GFP and BRI1-GFP receptor cluster displacements in epidermal cells of Arabidopsis seedling cotyledons after BRZ-treatment and subsequent application of 100 nM BL. (H) Time-dependent quantification of long FLS2-GFP and BRI1-GFP receptor cluster lifetimes in epidermal cells of Arabidopsis seedling cotyledons after BRZ-treatment and subsequent application of 100 nM BL. The presented data points were obtained from VAEM time series with a temporal resolution of 0.5 s over 250 frames. The coloured data points represent the technical replicates of 3 independent experiments. The indicated p-values were obtained using a one-tailed heteroscedastic t-test and a Bonferroni multiple hypothesis correction. DOI: http://dx.doi.org/10.7554/eLife.25114.010
Figure 4.
Figure 4.. Activation of FLS2 results in reduced lateral receptor cluster displacement.
(A) Time-dependent quantification of short-range FLS2-GFP and BRI1-GFP receptor cluster displacements in epidermal cells of Arabidopsis seedling cotyledons after application of 100 nM flg22. (B) Time-dependent quantification of short FLS2-GFP and BRI1-GFP receptor cluster lifetimes in epidermal cells of Arabidopsis seedling cotyledons after application of 100 nM flg22. (C) Time-dependent quantification of medium-range FLS2-GFP and BRI1-GFP receptor cluster displacements in epidermal cells of Arabidopsis seedling cotyledons after application of 100 nM flg22. (D) Time-dependent quantification of medium FLS2-GFP and BRI1-GFP receptor cluster lifetimes in epidermal cells of Arabidopsis seedling cotyledons after application of 100 nM flg22. (E) Time-dependent quantification of long-range FLS2-GFP and BRI1-GFP receptor cluster displacements in epidermal cells of Arabidopsis seedling cotyledons after application of 100 nM flg22. (F) Time-dependent quantification of long FLS2-GFP and BRI1-GFP receptor cluster lifetimes in epidermal cells of Arabidopsis seedling cotyledons after application of 100 nM flg22. The presented data points were obtained from VAEM time series with a temporal resolution of 0.5 s over 250 frames. The coloured data points represent the technical replicates of 3 independent experiments. The indicated p-values were obtained using a one-tailed heteroscedastic t-test and a Bonferroni multiple hypothesis correction. DOI: http://dx.doi.org/10.7554/eLife.25114.011
Figure 5.
Figure 5.. FLS2 and BRI1 show distinct plasma membrane localisation patterns.
(A–D) Confocal micrographs of FLS2-GFP (A) and FLS2-mCherry (B) plasma membrane localisation after transient co-expression in epidermal leaf cells of N. benthamiana as well as the merged image (C) and an image inset (D). (E–H) Confocal micrographs of BRI1-GFP (E) and FLS2-mCherry (F) plasma membrane localisation after transient co-expression in epidermal leaf cells of N. benthamiana as well as the merged image (G) and an image inset (H). (I) Quantitative co-localisation analysis for FLS2-GFP or BRI1-GFP, respectively, with FLS2-mCherry after transient co-expression in epidermal leaf cells of N. benthamiana. The coloured data points represent the technical replicates of 6 independent experiments. The indicated p-values were obtained using a two-tailed heteroscedastic t-test and a Bonferroni multiple hypothesis correction. (J) Quantitative co-localisation analysis for FLS2-GFP or BRI1-GFP, respectively, with FLS2-mCherry after transient co-expression in epidermal leaf cells of N. benthamiana and BRZ-treatment. The coloured data points represent the technical replicates of 2 independent experiments. The indicated p-values were obtained using a two-tailed heteroscedastic t-test and a Bonferroni multiple hypothesis correction. The presented images were acquired using confocal laser scanning microscopy (CLSM). Scale bars in (C) and (G) represent 5 µm, scale bars in (D) and (H) represent 2 µm. The areas that correspond to the images (D) and (H) are indicated by the dashed squares in images (C) and (G). Red arrowheads indicate endosomal compartments of BRI1-GFP. Endosomal compartments were omitted for quantitative analysis. The colour bar represents the colour code for fluorescence intensities. DOI: http://dx.doi.org/10.7554/eLife.25114.012
Figure 5—figure supplement 1.
Figure 5—figure supplement 1.. Control experiments for verifying the specific localisation patterns of FLS2 and BRI1.
(A) Quantitative co-localisation analysis for FLS2-GFP or BRI1-GFP, respectively, with FLS2-mCherry after transient co-expression in epidermal leaf cells of N. benthamiana. (B) Quantitative co-localisation analysis for FLS2-GFP or BRI1-GFP, respectively, with FLS2-mCherry after transient co-expression in epidermal leaf cells of N. benthamiana and BRZ-treatment. The coloured data points indicate the values of technical replicates; black dots indicate the position of outliers. To assess whether the determined co-localisation values (original or ori.) were significant, co-localisation analysis was also carried out after image randomisation. For this purpose, one of the two image channels was rotated by 90 degrees prior to co-localisation analysis (rotated or rot.). In addition, the co-localisation values of a reciprocal experiment are shown. Here, co-localisation of FLS2-GFP or BRI1-GFP was determined with regard to BRI1-mRFP. As emphasised by the represented p-values, we observed a specific co-localisation for FLS2-GFP and FLS2-mCherry. In contrast, the co-localisation of BRI1-GFP with FLS2-mCherry was not different from randomised images, and thus non-specific. Similar observations were made after BRZ-treatment for 2 days to deplete endogenous BRs as well as for reciprocal experiments using BRI1-mRFP as reference. The indicated p-values were obtained using a two-tailed heteroscedastic t-test and a Bonferroni multiple hypothesis correction. DOI: http://dx.doi.org/10.7554/eLife.25114.013
Figure 6.
Figure 6.. FLS2 and BRI1 clusters are spatiotemporally separated.
(A–C) Plasma membrane localisation of FLS2-GFP (A) and FLS2-mCherry (B) after transient co-expression in epidermal leaf cells of N. benthamiana as well as the merged image (C). (D) Kymograph analysis of VAEM micrograph shown in (C). The spatial dimension of the kymograph is indicated by the white arrow in (C). The acquisition time of a single channel was 0.25 s. For each channel 200 frames were collected. (E–G) Plasma membrane localisation of BRI1-GFP (E) and FLS2-mCherry (F) after transient co-expression in epidermal leaf cells of N. benthamiana as well as the merged image (G). (H) Kymograph analysis of VAEM micrograph shown in (G). The spatial dimension of the kymograph is indicated by the white arrow in (C). The acquisition time of a single channel was 0.25 s. For each channel 200 frames were collected. The presented images were acquired using variable angle epi-fluorescence microscopy (VAEM). In the merged images FLS2-GFP or BRI1-GFP signals are shown in green and FLS2-mCherry signals are shown in magenta. The scale bar represents 5 µm. The colour bar represents the colour code for fluorescence intensities. Two independent experiments with similar results were performed. DOI: http://dx.doi.org/10.7554/eLife.25114.016
Figure 7.
Figure 7.. FLS2 and BRI1 co-localize differentially with remorin markers.
(A I–A III) Confocal micrographs of mRFP-REM1.2 (A I) and FLS2-GFP (A II) plasma membrane localisation after transient co-expression in epidermal leaf cells of N. benthamiana as well as the merged image (A III). (B I–B III) Confocal micrographs of mRFP-REM1.2 (B I) and BRI1-GFP (B II) plasma membrane localisation after transient co-expression in epidermal leaf cells of N. benthamiana as well as the merged image (B III). (C I–C III) Confocal micrographs of mRFP-REM1.3 (C I) and FLS2-GFP (C II) plasma membrane localisation after transient co-expression in epidermal leaf cells of N. benthamiana as well as the merged image (C III). (D I–D III) Confocal micrographs of mRFP-REM1.3 (D I) and BRI1-GFP (D II) plasma membrane localisation after transient co-expression in epidermal leaf cells of N. benthamiana as well as the merged image (D III). (E I–E III) Confocal micrographs of mRFP-REM6.1 (E I) and FLS2-GFP (E II) plasma membrane localisation after transient co-expression in epidermal leaf cells of N. benthamiana as well as the merged image (E III). (F I–F III) Confocal micrographs of mRFP-REM6.1 (F I) and BRI1-GFP (F II) plasma membrane localisation after transient co-expression in epidermal leaf cells of N. benthamiana as well as the merged image (F III). (G I–G III) Confocal micrographs of mRFP-REM6.2 (G I) and FLS2-GFP (G II) plasma membrane localisation after transient co-expression in epidermal leaf cells of N. benthamiana as well as the merged image (G III). (H I–H III) Confocal micrographs of mRFP-REM6.2 (H I) and BRI1-GFP (H II) plasma membrane localisation after transient co-expression in epidermal leaf cells of N. benthamiana as well as the merged image (H III). (I) Quantitative co-localisation analysis for FLS2-GFP and BRI1-GFP with mRFP-REM1.2, mRFP-REM1.3, mRFP-REM6.1, and mRFP-REM6.2, respectively. The coloured data points represent the technical replicates of 3 independent experiments. The indicated p-values were obtained using a two-tailed heteroscedastic t-test and a Bonferroni multiple hypothesis correction. In the merged images FLS2-GFP or BRI1-GFP signals are shown in green and REM signals are shown in magenta. Scale bars represent 2 µm. The colour bar represents the colour code for fluorescence intensities. Black dots represent outliers. DOI: http://dx.doi.org/10.7554/eLife.25114.017
Figure 7—figure supplement 1.
Figure 7—figure supplement 1.. Control experiments for verifying the specific co-localisation of FLS2 and BRI1 with remorin markers.
The coloured data points indicate the values of technical replicates; black dots indicate the position of outliers. To assess whether the determined co-localisation values (orig.) were significant, co-localisation analysis was also carried out after image randomisation. For this purpose, one of the two image channels was rotated by 90 degrees prior to co-localisation analysis (rota.). As shown by the represented p-values, FLS2-GFP (FLS2) showed to a varying degree specific co-localisation with the four tested mRFP-tagged remorin markers. In contrast, BRI1-GFP (BRI1) only specifically co-localised with mRFP-REM6.1 (REM6.1) and mRFP-REM6.2 (REM6.2). The indicated p-values were obtained using a two-tailed heteroscedastic t-test and a Bonferroni multiple hypothesis correction. DOI: http://dx.doi.org/10.7554/eLife.25114.018
Figure 8.
Figure 8.. FLS2 and BRI1 signaling complexes also undergo cluster formation within the plasma membrane.
(A–D) Confocal micrographs of BSK1-CFP (A), BSK1-nYFP/BRI1-cYFP (BiFC) (B), and BRI1-mRFP (C) plasma membrane localisation after transient co-expression in epidermal leaf cells of N. benthamiana as well as the merged image (D). (E–H) Confocal micrographs of BSK1-CFP (E), BSK1-nYFP/FLS2-cYFP (BiFC) (F), and FLS2-mCherry (G) plasma membrane localisation after transient co-expression in epidermal leaf cells of N. benthamiana as well as the merged image (H). (I) Quantitative co-localisation analysis for the reconstituted YFP fluorescence intensities (BiFC) with BSK1-CFP (BSK1) as well as BRI1-mRFP (BRI1) or FLS2-mCherry (FLS2) and the quantified co-localisation between BSK1-CFP with BRI1-mRFP or FLS2-mCherry. The coloured data points represent the technical replicates of 3 independent experiments. No statistical differences were observed based on two-tailed heteroscedastic t-tests and a Bonferroni multiple hypothesis correction. BiFC stands for bimolecular fluorescence complementation and the labelled image panels show YFP fluorescence signals for the respective protein complexes. Yc and Yn indicate the C- and N-terminal fragments of the split YFP fluorophore, respectively. Scale bars represent 5 µm. Black dots represent outliers. DOI: http://dx.doi.org/10.7554/eLife.25114.019
Figure 9.
Figure 9.. BRI1-BIK1, but not FLS2-BIK1, complexes associate with cortical microtubules.
(A–D) Confocal micrographs of BIK1-CFP (A), BIK1-nYFP/BRI1-cYFP (BiFC) (B), and BRI1-mRFP (C) plasma membrane localisation after transient co-expression in epidermal leaf cells of N. benthamiana as well as the merged image (D). (E–H) Confocal micrographs of BIK1-CFP (E), BIK1-nYFP/FLS2-cYFP (BiFC) (F), and FLS2-mCherry (G) plasma membrane localisation after transient co-expression in epidermal leaf cells of N. benthamiana as well as the merged image (H). (I–K) Confocal micrographs of BIK1-GFP (I) and LifeAct-tRFP (J) fluorescence intensities after transient co-expression in epidermal leaf cells of N. benthamiana as well as the merged image (K). (L–N) Confocal micrographs of BIK1-mRFP (L) and TUB5-GFP (M) fluorescence intensities after transient co-expression in epidermal leaf cells of N. benthamiana as well as the merged image (N). (O) Quantitative co-localisation analysis for the reconstituted YFP fluorescence intensities (BiFC) with BIK1-CFP (BIK1) as well as BRI1-mRFP (BRI1) or FLS2-mCherry (FLS2) and the quantified co-localisation between BIK1-CFP with BRI1-mRFP or FLS2-mCherry. The coloured data points represent the mean values of 3 independent experiments. No statistical differences were observed based on two-tailed heteroscedastic t-tests and a Bonferroni multiple hypothesis correction. BiFC stands for bimolecular fluorescence complementation and the labelled image panels show YFP fluorescence signals for the respective protein complexes. Yc and Yn indicate the C- and N-terminal fragments of the split YFP fluorophore, respectively. LifeAct-tRFP was employed to visualise actin filaments, whereby tRFP stands for TagRFP. Scale bars represent 5 µm. Black dots represent outliers. DOI: http://dx.doi.org/10.7554/eLife.25114.020
Figure 9—figure supplement 1.
Figure 9—figure supplement 1.. BIK1 and BRI1-BIK1 complexes associate with cortical microtubules.
(A–D) Confocal micrographs of BIK1-CFP (A), BIK1-nYFP/BRI1-cYFP (B), and BRI1-mRFP (C) plasma membrane localisation after transient co-expression in epidermal leaf cells of N. benthamiana as well as the merged image (D). (E–H) Confocal micrographs of BIK1-CFP (E), BIK1-nYFP/BRI1-cYFP (F), and BRI1-mRFP (G) plasma membrane localisation after transient co-expression in epidermal leaf cells of N. benthamiana as well as the merged image (H). (I–K) Confocal micrographs of BIK1-mRFP (I) and TUA6-GFP (J) after transient co-expression in epidermal leaf cells of N. benthamiana together with the merged image (K). The illustrated images show the different degrees of cortical microtubule association of BIK1 and BIK1 complexes. BiFC stands for bimolecular fluorescence complementation and the labelled image panels show YFP fluorescence signals for the respective protein complexes. Scale bars represent 5 µm. DOI: http://dx.doi.org/10.7554/eLife.25114.021
Author response image 1.
Author response image 1.. Subpopulations of FLS2 and BRI1 co-localise with BAK1 in plasma membrane nanodomains.
The images show the plasma membrane localisation of FLS2-GFP or BRI1-GFP with BAK1- mCherry. The white arrowheads indicate plasma membrane nanodomains that contain fluorescently labelled receptor and co-receptor molecules simultaneously. The images were acquired 5 days post germination using VAEM and the scale bars represent a distance of 5 µm. The lines were generated by crossing pFLS2::FLS2-GFP (Göhre et al., 2008) or pBRI1::BRI1- GFP (Friedrichsen et al., 2000), respectively, with pBAK1::BAK1-mCherry (Bücherl et al., 2013). DOI: http://dx.doi.org/10.7554/eLife.25114.023
Author response image 2.
Author response image 2.. FLS2-GFP forms receptor clusters in fls2 mutant background.
The images show the plasma membrane localisation of pFLS2::FLS2-GFP stably transformed in the fls2 mutant or Columbia wild type background, respectively. The images were acquired 5 days post germination using CLSM and the scale bars represents a distance of 5 µm. DOI: http://dx.doi.org/10.7554/eLife.25114.024
Author response image 3.
Author response image 3.. Actin depolymerisation does not abolish FLS2 cluster formation.
DOI: http://dx.doi.org/10.7554/eLife.25114.025
Author response image 4.
Author response image 4.. FLS2 still undergoes cluster formation in serk mutant backgrounds.
DOI: http://dx.doi.org/10.7554/eLife.25114.026

Similar articles

Cited by

References

    1. Aan den Toorn M, Albrecht C, de Vries S. On the origin of SERKs: bioinformatics analysis of the somatic embryogenesis receptor kinases. Molecular Plant. 2015;8:762–782. doi: 10.1016/j.molp.2015.03.015. - DOI - PubMed
    1. Abulrob A, Lu Z, Baumann E, Vobornik D, Taylor R, Stanimirovic D, Johnston LJ. Nanoscale imaging of epidermal growth factor receptor clustering: effects of inhibitors. Journal of Biological Chemistry. 2010;285:3145–3156. doi: 10.1074/jbc.M109.073338. - DOI - PMC - PubMed
    1. Albrecht C, Boutrot F, Segonzac C, Schwessinger B, Gimenez-Ibanez S, Chinchilla D, Rathjen JP, de Vries SC, Zipfel C. Brassinosteroids inhibit pathogen-associated molecular pattern-triggered immune signaling independent of the receptor kinase BAK1. PNAS. 2012;109:303–308. doi: 10.1073/pnas.1109921108. - DOI - PMC - PubMed
    1. Ali GS, Prasad KV, Day I, Reddy AS. Ligand-dependent reduction in the membrane mobility of FLAGELLIN SENSITIVE2, an Arabidopsis receptor-like kinase. Plant and Cell Physiology. 2007;48:1601–1611. doi: 10.1093/pcp/pcm132. - DOI - PubMed
    1. Asami T, Min YK, Nagata N, Yamagishi K, Takatsuto S, Fujioka S, Murofushi N, Yamaguchi I, Yoshida S. Characterization of Brassinazole, a triazole-type brassinosteroid biosynthesis inhibitor. Plant Physiology. 2000;123:93–100. doi: 10.1104/pp.123.1.93. - DOI - PMC - PubMed

Publication types

MeSH terms

LinkOut - more resources