. 2017 Mar 6:6:e24910.
doi: 10.7554/eLife.24910.

Detecting changes in dynamic and complex acoustic environments

Affiliations

Detecting changes in dynamic and complex acoustic environments

Yves Boubenec et al. Elife. .

Abstract

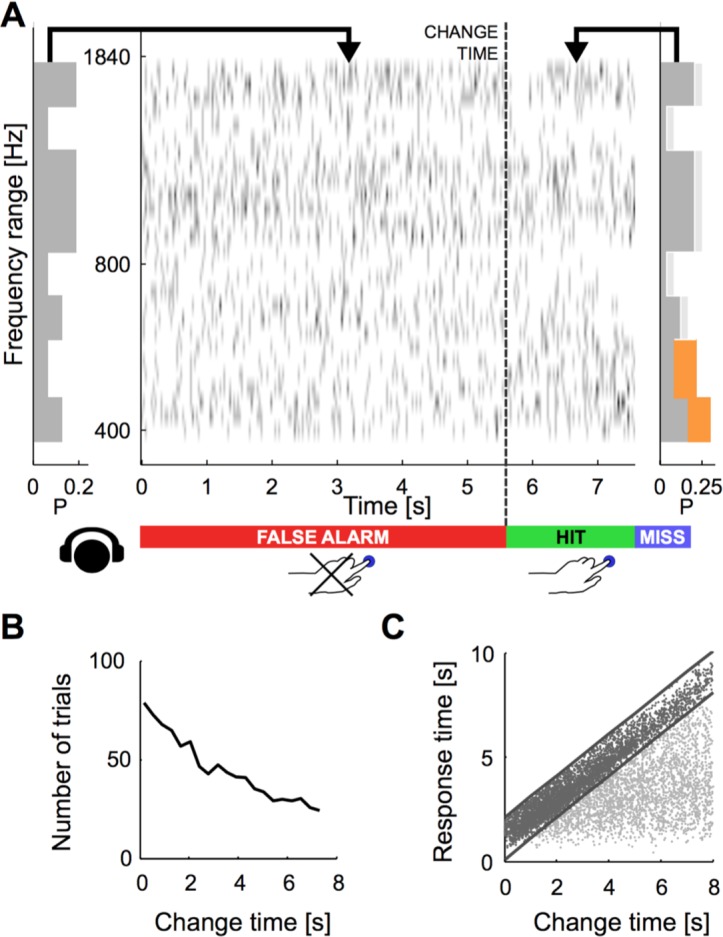
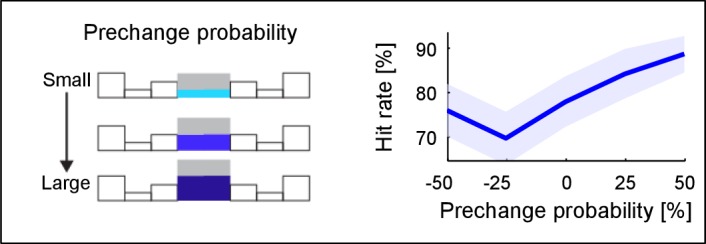
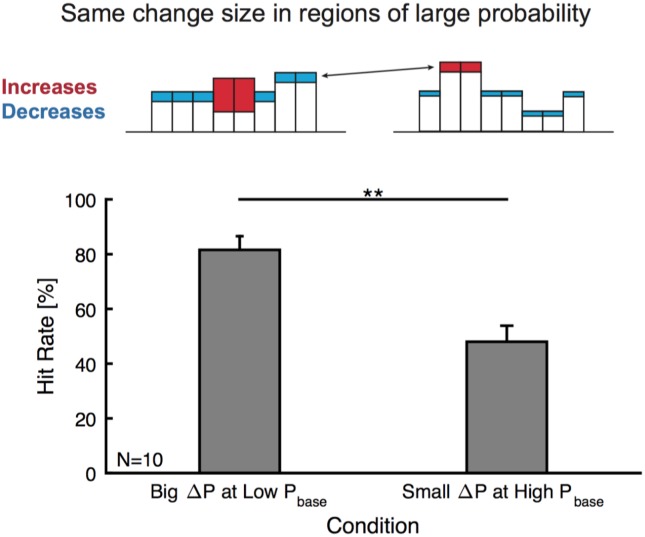
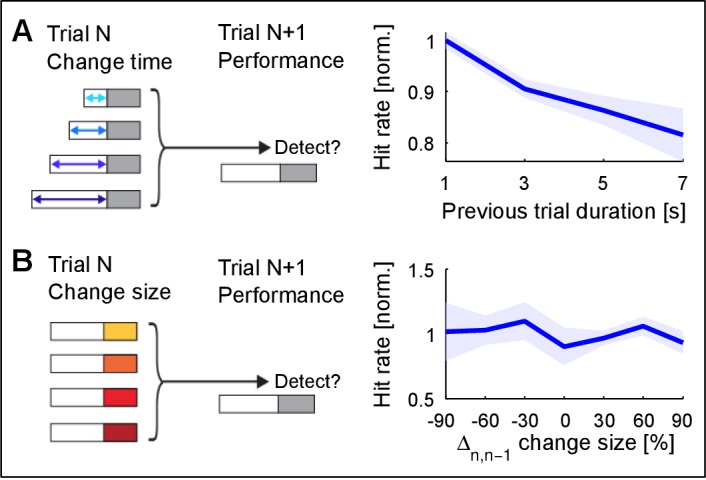
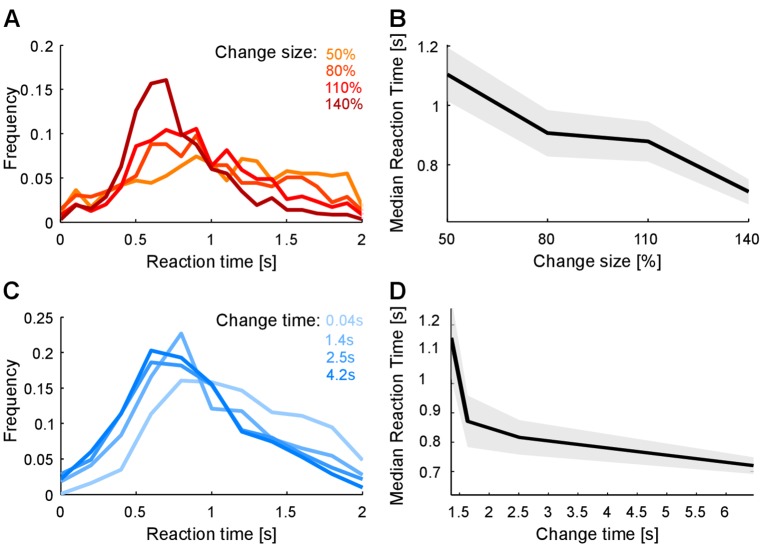
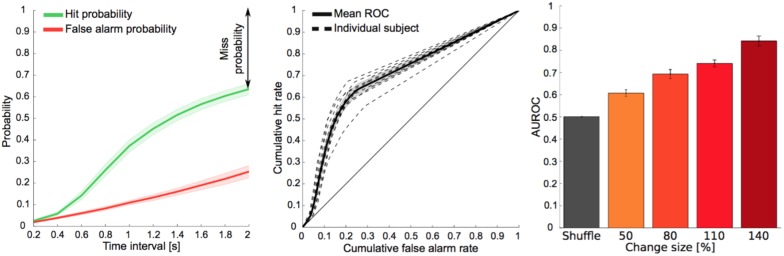
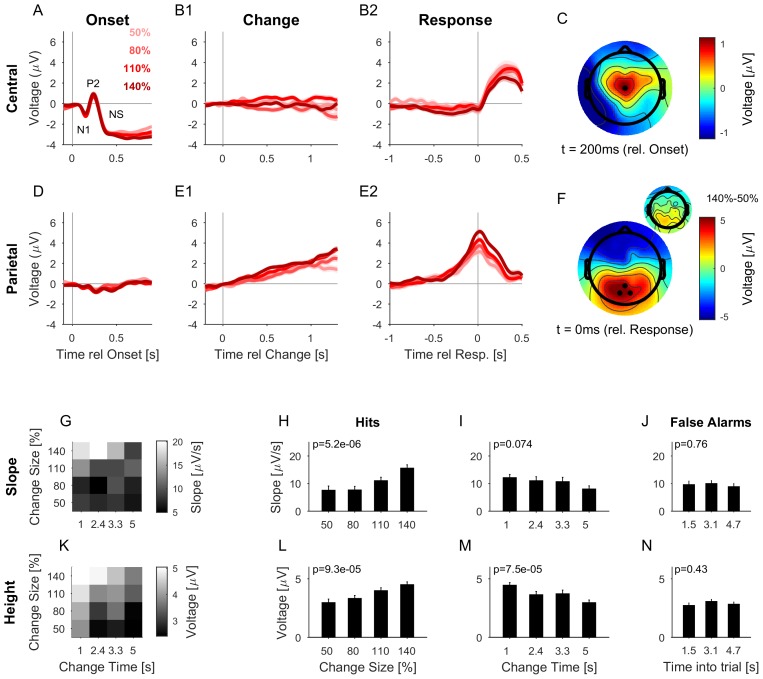
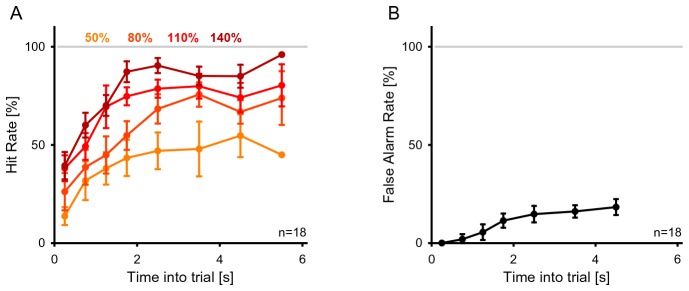
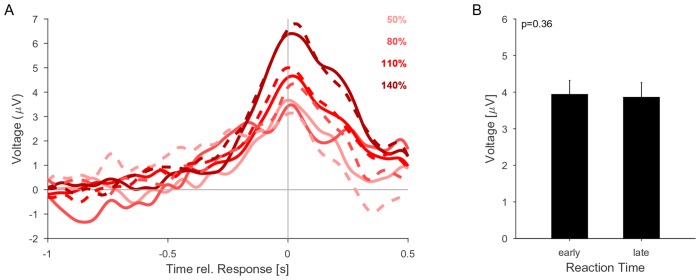
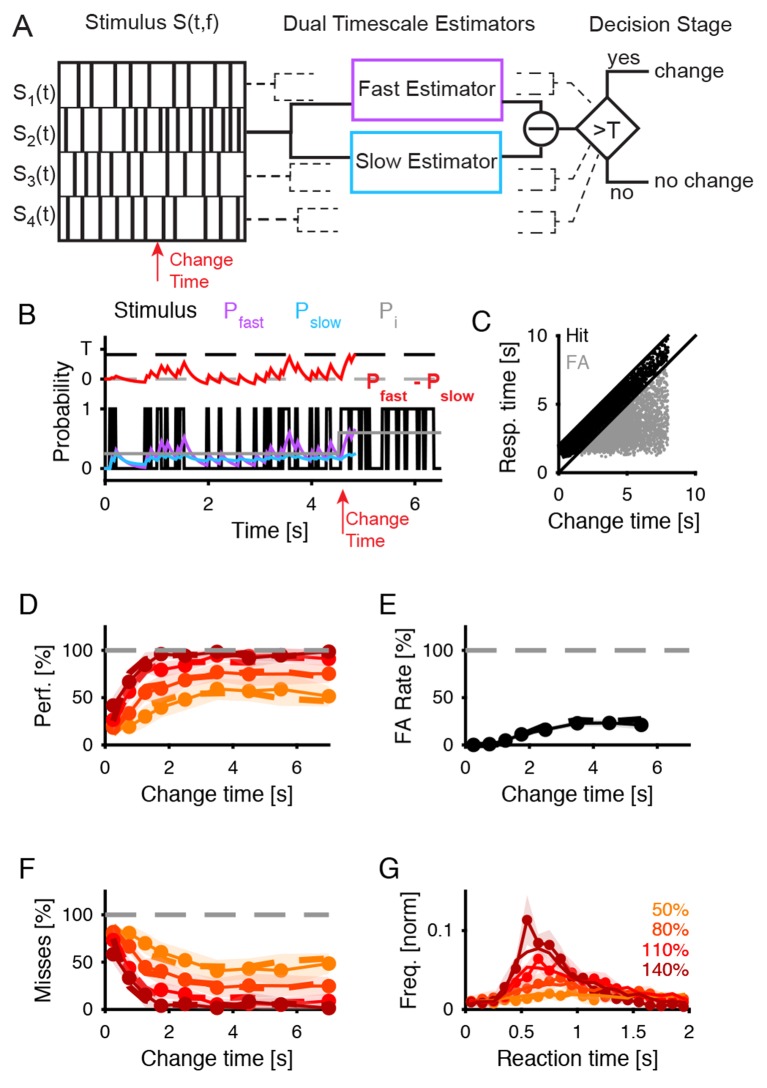
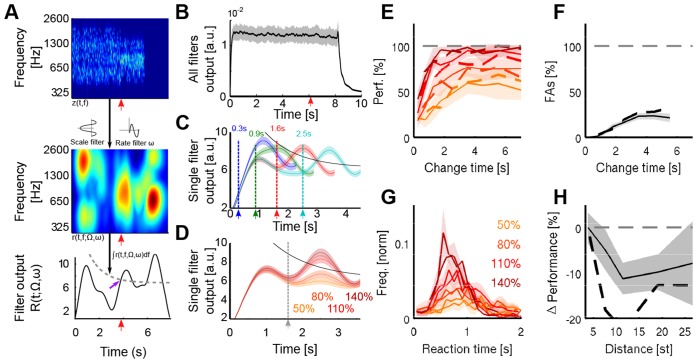
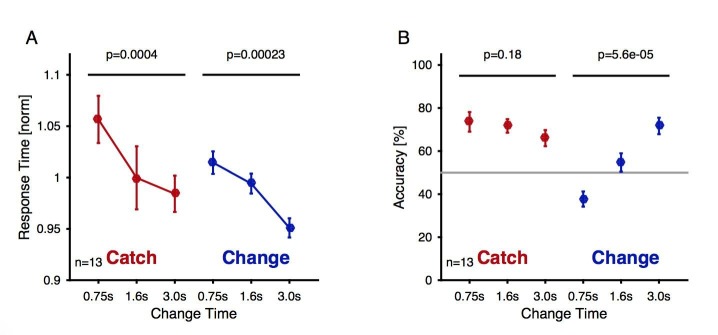
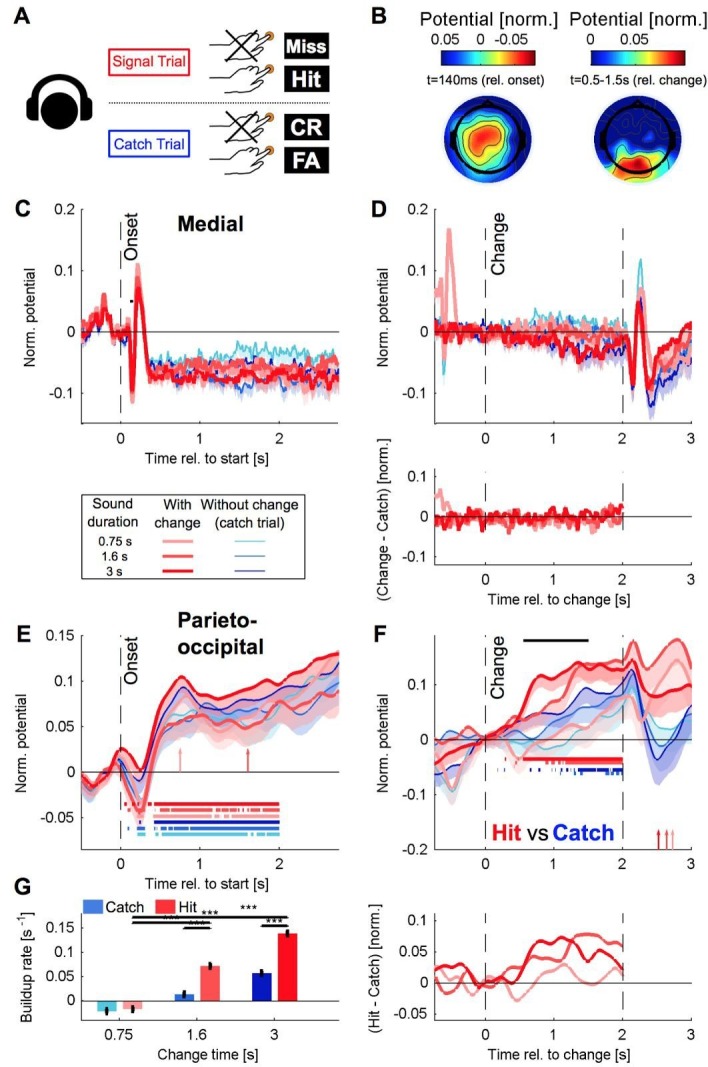
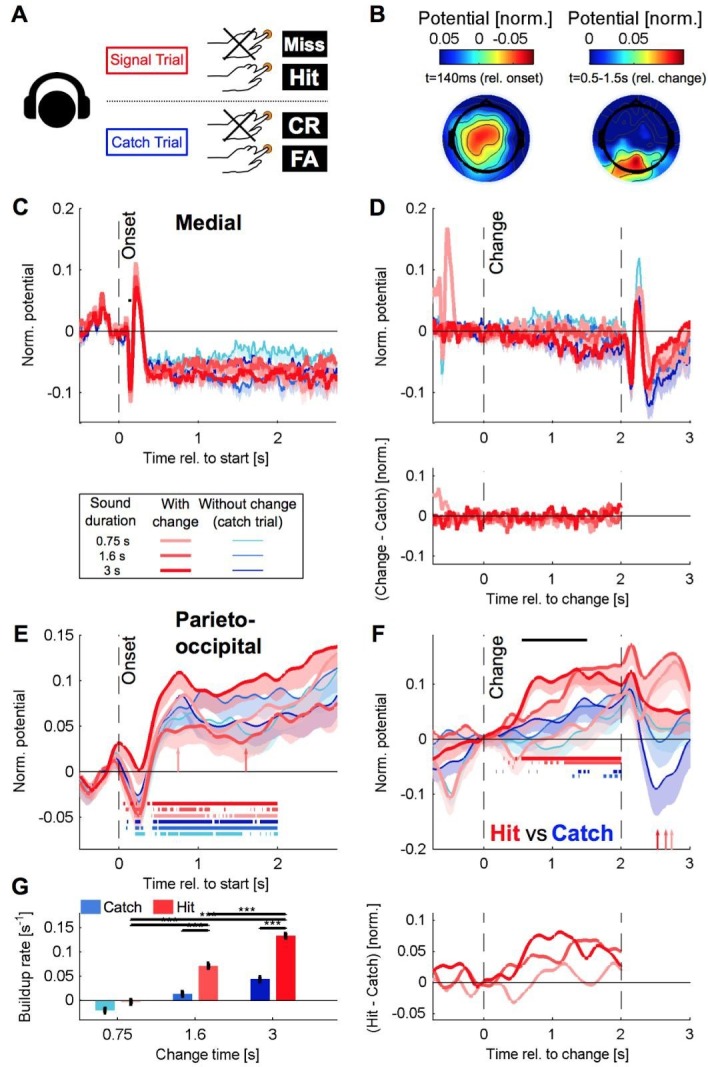
Natural sounds such as wind or rain, are characterized by the statistical occurrence of their constituents. Despite their complexity, listeners readily detect changes in these contexts. We here address the neural basis of statistical decision-making using a combination of psychophysics, EEG and modelling. In a texture-based, change-detection paradigm, human performance and reaction times improved with longer pre-change exposure, consistent with improved estimation of baseline statistics. Change-locked and decision-related EEG responses were found in a centro-parietal scalp location, whose slope depended on change size, consistent with sensory evidence accumulation. The potential's amplitude scaled with the duration of pre-change exposure, suggesting a time-dependent decision threshold. Auditory cortex-related potentials showed no response to the change. A dual timescale, statistical estimation model accounted for subjects' performance. Furthermore, a decision-augmented auditory cortex model accounted for performance and reaction times, suggesting that the primary cortical representation requires little post-processing to enable change-detection in complex acoustic environments.

Keywords: EEG; auditory decision-making; auditory textures; centro-parietal positivity; change detection; human; neuroscience; psychophysics.


Conflict of interest statement

The authors declare that no competing interests exist.

Figures

Figure 1.
Figure 1.. Dynamical change-detection paradigm with auditory textures.
(A) Subjects listened to an acoustic textural stimulus, whose predictability was governed by its marginal frequency distribution (grey curve, left panel). Tones in individual frequency bins were drawn independently consistent with the marginal (middle panel). Listeners were instructed to report changes by a button press. The frequency marginal was modified (indicated in orange in the right panel distribution) after a randomly chosen point in time (‘change time’). The probabilities in two adjacent or non-adjacent frequency bins were increased together, and the distribution over the bins renormalized to maintain average global level. (B) The distribution of change times was chosen from an exponential distribution. This ensured that the probability of a change in the next time-bin remained constant (shown here is the empirical distribution). (C) Response times occurred before (false alarms) and after the change time (hits). Subjects usually responded only after an initial listening duration, allowing them to acquire the sound statistics. DOI: http://dx.doi.org/10.7554/eLife.24910.002
Figure 2.
Figure 2.. Detecting a change in statistics improves with size and time of change.
(A) Performance of change detection depended significantly on change time (abscissa) and change size (shades of orange indicate the step size as percent of the original bin probability, see inset). Only changes in contiguous bins were used presently, to maintain identical trial numbers across difficulties. (B) The dynamics of the performance curve varied with change size, indicated by the speed parameter τ of an Erlang CDF fitted to the data (see Materials and methods). (C) Dynamical d’ confirms the dependence of performance on change time and change size. The dependence on change time suggests an improved detection relying on a converged estimate of the baseline statistics, whereas the dependence on change size indicates a higher level of certainty can be attained more rapidly if the amount of evidence is larger. (D) Instantaneous false alarm rate is uniform across time, after an initial hesitation to respond in the first 2 s. The initial hesitation is likely due to the task-design, requiring an initial estimation of the sound statistics. DOI: http://dx.doi.org/10.7554/eLife.24910.003
Figure 2—figure supplement 1.
Figure 2—figure supplement 1.. Change detection improves with base probability.
The prechange marginal probability of a frequency bin significantly influences the performance in the same trial (~10% increase, p=0.005, only 110% condition considered here). Prechange probability is relative to the flat marginal probability (pinit = 0.125), i.e. the absolute amount of change in probability is equalized This suggests that large prechange probabilities allow a faster or more accurate estimate, possibly due to a higher rate of tones sampled up to the change time. DOI: http://dx.doi.org/10.7554/eLife.24910.004
Figure 2—figure supplement 2.
Figure 2—figure supplement 2.. Change detection is not focussed on high probability bins.
Subjects could adopt a strategy to listen to salient, high probability bins. We tested this hypothesis by comparing equal changes in high probability bins, with differential changes in other bins (top, compare left and right example frequency marginals where red indicates the increase in a frequency region and blue a decrease. These patterns arise from the local change (increase) together with the decrease due to normalization). If listener's focussed on high probability bins, very similar performance should be expected. In contrast we find a strong dependence on the surrounding bins (bottom), with hit rates substantially higher (p<0.01, Wilcoxon signed ranks, N = 10) for the case of a strong increase in a low probability region (left) than smaller changes in low frequency regions (right), although change in high probability bins was kept roughly the same. DOI: http://dx.doi.org/10.7554/eLife.24910.005
Figure 2—figure supplement 3.
Figure 2—figure supplement 3.. Change detection improves with stimulus exposure in the previous trial.
(A) Listening duration in the previous trial significantly reduces detectability in the current trial (~15% decrease, p=0.008, Friedman test). A very similar result was obtained in comparison with change time in the previous trial. Performance in the current trial was normalized to the average performance within each change size. This suggests that the estimate of the previous trial is more stable for longer exposure, which interferes with the estimation in the current trial. Performance in the previous trial was not predictive of performance in the current trial (data not shown). (B) Change size of the previous trial has no influence on the detectability in the current trial (p=0.12, Kruskal-Wallis). Change size in the previous trial was evaluated both absolute and relative to the current trial’s change size (the latter is depicted). Performance in the current trial was normalized as in A). Together, these results suggest that ‘what’ is estimated is less influential on performance, than ‘how well’ it has been estimated. DOI: http://dx.doi.org/10.7554/eLife.24910.006
Figure 3.
Figure 3.. Reaction times also reflect estimation of pre- and post-change stimulus properties.
(A) Reaction time distribution sharpens with change size. (B) Median response time significantly reduces by 20% (p<10−4, Kruskal-Wallis) with larger change size (different colors indicate different change sizes). These effects indicate a faster, temporally more constrained decision, which could indicate more rapid evidence accumulation for larger changes. (C) Reaction time distribution sharpens with change time and D) median reaction time reduces rapidly with change time by 25% (p<10−5, Kruskal-Wallis). Both effects indicate a higher degree of certainty in decision making, which could indicate a more converged estimation of the pre-change statistics. DOI: http://dx.doi.org/10.7554/eLife.24910.007
Figure 3—figure supplement 1.
Figure 3—figure supplement 1.. Discriminative performance across change sizes.
(A) The probabilities for hits and false alarms were independently computed from their respective reaction time (RT) distributions at each time intervals from 0.2 to 2 s with 0.2 s increments (see details in the d’ Analysis paragraph of the Methods and Yin et al., 2010). (B) The false alarm probability function was plotted against hit probability function to construct the receiver operating curve (ROC). The area under the ROC (AUROC) is a measure of discriminative performance of the task. (C) The AUROC was significantly different across change sizes and chance level (p<10−7; Friedman). DOI: http://dx.doi.org/10.7554/eLife.24910.008
Figure 4.
Figure 4.. Detectability of changes depends on spectral properties of the change.
(A) Spectral distance between the changed bin centers ('change distribution', measured in semitones, st) significantly reduces performance (p=0.01, Kruskal-Wallis test). Spectral distance ranged from neighboring (three st) bin centers to locations at the edges of the tested range (23 st). (B) Absolute spectral position of the changed bins does not influence performance (p=0.85, Kruskal-Wallis). Absolute spectral position was not significantly correlated with the detectability. DOI: http://dx.doi.org/10.7554/eLife.24910.009
Figure 5.
Figure 5.. The CPP potential shows a dependence on both time and size of change, while the central potential remains unaffected.
(A) After stimulus onset, the central potential (Ch. 1, black dot in C) shows a classical N1-P2 progression, followed by a sustained negative potential (labelled NS here). Different shades of red indicate different change sizes. Curves are average over all change times, to avoid crowding the plots. Note that the lowpass filtering at 20 Hz (common for all potentials) reduces the N1/P2 amplitudes below their typical size. (B1) Locked to the time of change, the central potential shows a slow negative trend, which, however, does not depend systematically on change size. (B2) Preceding the response, the central electrodes show no significant change in potential, which only starts to deviate from 0 after the button press. (C) At 200 ms after stimulus onset, the topography of the potential indicates a typical auditory onset response for bilateral stimulation, i.e. centered on Cz (El.1 in the equidistant layout, black dot). (D) The potential above the central parietal cortex (average over Ch. 14,27,28 in the equidistant cap, black dots in F) shows no substantial change at stimulus onset. (E1) Aligned to the time of change, the CPP electrodes show a progressive increase in potential, with some staggering according to change size. In comparison to the response-locked potentials, the present potential is wider and smaller since it is composed of responses at different times. (E2) In contrast to the central electrodes, the CPP electrodes show a clear increase before the response, peaking at or slightly after the response time. (F) The topography locked to the response is found to be centered over the parietal cortex, tending towards the occipital cortex (black dots mark Ch. 14,27,28). The inset shows the difference between the 140% and 50% condition, indicating that the difference in potential is also localized consistently with the average topography. Note, that there was no display change in the entire tone presentation, and a 0.5 s gap after the response, before the screen changed, hence, visual responses can be excluded. (G) CPP slope of the potential leading up to the response in relation to the different change time and size conditions was measured in a window of 300–50 ms before the response. (H) CPP slope depended significantly on change size (2-way ANOVA with change time and change size as factors, p<<0.001 for the change time as a factor). (I) CPP slope did not depend significantly on change time (ANOVA as above, p=0.07). (J) CPP slope for false alarms showed no significant dependence on the time into the trial (p=0.76, 1-way ANOVA). (K) Peak height of the CPP was measured in a symmetric window of 80 ms around the response time. (L) Peak height of the CPP showed a significant increase with change size (2-way ANOVA with change time and size as factors, p<<0.001 for change size). (M) Peak height depended significantly on change time, decreasing with longer change times (ANOVA as above, p<<0.001 for change time). (N) Peak heights for false alarms showed no dependence on time into the trial (p=0.43, 1-way ANOVA) but were significantly smaller than the hit trials (p<1e-9, 1-way ANOVA). Error bars indicate single SEMs for all plots. DOI: http://dx.doi.org/10.7554/eLife.24910.010
Figure 5—figure supplement 1.
Figure 5—figure supplement 1.. Change detection performance during the EEG experiment.
(A) The detection rate of subjects in the EEG version of the task was quite comparable to the one in the psychophysics only task (see Figure 2A). (B) The false alarm rate stayed approximately constant after the initial 2 s, corresponding to the available response period. Precisely, the false alarm rate given here is the instantaneous rate per second as a fraction of all trials with a change time greater than the current time bin. DOI: http://dx.doi.org/10.7554/eLife.24910.011
Figure 5—figure supplement 2.
Figure 5—figure supplement 2.. Same data and analysis as in Figure 5, however, detrended with a classical high-pass filter (Matlab: filtfilt, 0.1 Hz, 15th order, 50 dB attenuation in the stop band).
DOI: http://dx.doi.org/10.7554/eLife.24910.012
Figure 6.
Figure 6.. The CPP potential shows no dependence on whether responses occur early or late after the change.
(A) CPP potentials aligned to response as in Figure 5E2 (for second change-time bin, i.e. around 2.4 s). The solid lines are the early responses (up to median reaction time) and the dashed lines are the late responses (median reaction time to end of response-window). (B) Across all conditions the reaction time did not significantly influence the height of the CPP potential (p=0.36 for reaction time, 3-way ANOVA over reaction time, change size and change time). DOI: http://dx.doi.org/10.7554/eLife.24910.013
Figure 7.
Figure 7.. Dual timescale statistical estimation replicates behavioral results.
(A) The dual timescale model consists of two dynamical estimation processes operating with different speeds. If their estimates differ by more than a threshold T, a change in the stimulus is detected. The model was fitted to the entire set of behavioral data (D–G). (B) In a single trial the slow (Pslow, blue) and the fast (Pfast, purple) estimates of the actual stimulus probability (light grey) vary with the stimulus (black) on different timescales. Here, a decision. (PfastPslow>T) is detected at 300 ms after the change in the stimulus (red). (C) The distribution of response times compared with the change times exhibits a similar shape as for the real subjects (see Figure 1B). (D) Detection performance of the model (dashed lines) closely matches the human data (continuous line with 1 SEM error hull) both as a function of change time and change size (different shades see legend in G), see text for parameter values). (E) False alarm rates are also matched closely (same legend as in D). (F) Miss rates are matched equally closely (same legend as in D). (G) Response time distributions are also matched closely, which is of interest as no explicit model of response times was included in the model (same legend as in D). DOI: http://dx.doi.org/10.7554/eLife.24910.014
Figure 8.
Figure 8.. A cortical filter-bank model provides an implementation consistent with the behavioral results.
(A) Conceptual structure of the model. The cochleogram (top panel) is passed through modulation filters (scale Ω: 0.54 cycle/oct.; rate ω: 0.72 Hz) for obtaining a cortical representation of the sound (middle panel). Changes are detected with a threshold (bottom panel, grey dashed line) applied to the frequency-averaged cortical representation (collapsing threshold parameters: λ = 1.14 s; b = 10.77; a = 6.23). First peak exceeding the threshold is classified as change (purple arrow). Timing of change is indicated by a red arrow in the three panels. (B) Average output of the cortical model across all modulation filters. Although trial onset elicits an overall increase in activity, the change in statistics does not lead to an average change in activity (depiction for single trial length, with change time indicated by arrow). (C) Single filter output as a function of change time (average over 100 trials for each curve). Change times are indicated by colored arrows. Notice that the change-related peak is not discernible for early changes, due to its interaction with the onset response. Same parameters than in A). (D) Single filter output as a function of change sizes (average over 100 trials for each curve). Same parameters as in A). (E) Performance for human participants (thin lines) and the decision model (dashed thick lines), as a function of change size and change time. Same colors as in D). (F) False alarm rate as a function of change size and change time. Same colors as in D). (G) Response time distributions as a function of change size. Same colors as in D). (H) Decrease in performance with respect to the distance between incremented bins. Actual data in full line, model result is depicted with a dashed black line. DOI: http://dx.doi.org/10.7554/eLife.24910.015
Author response image 1.
Author response image 1.. Change detection reaction times and performance during the delayed response EEG experiment as a function of exposure to the first texture Reaction time decreased significantly as a function of change time and trial type both for catch (brown) and change trials (blue, 1 way ANOVA, p-values indicated in the figure).
Reaction times were normalized within each subject before averaging to account for individual overall differences. (A) The accuracy (correct response for either trial type) of catch trials stayed unchanged (brown, 1-way ANOVA), while the performance for the change trials improved significantly with change time (blue, 1-way ANOVA). DOI: http://dx.doi.org/10.7554/eLife.24910.020
Author response image 2.
Author response image 2.. Recreated Figure 5 for the delayed paradigm with a larger number of subjects (n=13), demonstrating that the topography of the potential is unchanged, as are the dependence of slope on change time (which we, however, now interpret as a combination of change time and response time).
DOI: http://dx.doi.org/10.7554/eLife.24910.021
Author response image 3.
Author response image 3.. Recreation of Figure 5 for the delayed paradigm with a classical highpass filter, same caption (compare to Author response image 2).
DOI: http://dx.doi.org/10.7554/eLife.24910.022

Similar articles

Cited by

References

    1. Ahrens MB, Linden JF, Sahani M. Nonlinearities and contextual influences in auditory cortical responses modeled with multilinear spectrotemporal methods. Journal of Neuroscience. 2008;28:1929–1942. doi: 10.1523/JNEUROSCI.3377-07.2008. - DOI - PMC - PubMed
    1. Andreou LV, Griffiths TD, Chait M. Sensitivity to the temporal structure of rapid sound sequences - An MEG study. NeuroImage. 2015;110:194–204. doi: 10.1016/j.neuroimage.2015.01.052. - DOI - PMC - PubMed
    1. Barascud N, Pearce MT, Griffiths TD, Friston KJ, Chait M. Brain responses in humans reveal ideal observer-like sensitivity to complex acoustic patterns. Proceedings of the National Academy of Sciences. 2016;113:E616–E625. doi: 10.1073/pnas.1508523113. - DOI - PMC - PubMed
    1. Bizley JK, Walker KM, Nodal FR, King AJ, Schnupp JW. Auditory cortex represents both pitch judgments and the corresponding acoustic cues. Current Biology. 2013;23:620–625. doi: 10.1016/j.cub.2013.03.003. - DOI - PMC - PubMed
    1. Bogacz R, Brown E, Moehlis J, Holmes P, Cohen JD. The physics of optimal decision making: a formal analysis of models of performance in two-alternative forced-choice tasks. Psychological Review. 2006;113:700–765. doi: 10.1037/0033-295X.113.4.700. - DOI - PubMed

Publication types

LinkOut - more resources