. 2017 Mar 9;168(6):977-989.e17.
doi: 10.1016/j.cell.2017.02.002. Epub 2017 Mar 2.

Inefficient Crossover Maturation Underlies Elevated Aneuploidy in Human Female Meiosis

Affiliations

Inefficient Crossover Maturation Underlies Elevated Aneuploidy in Human Female Meiosis

Shunxin Wang et al. Cell. .

Abstract

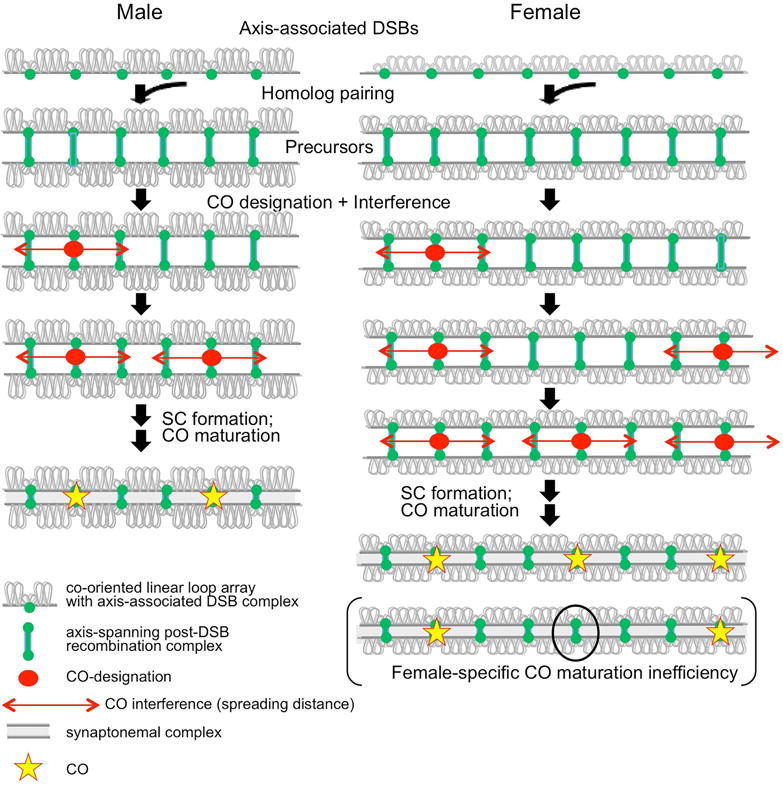
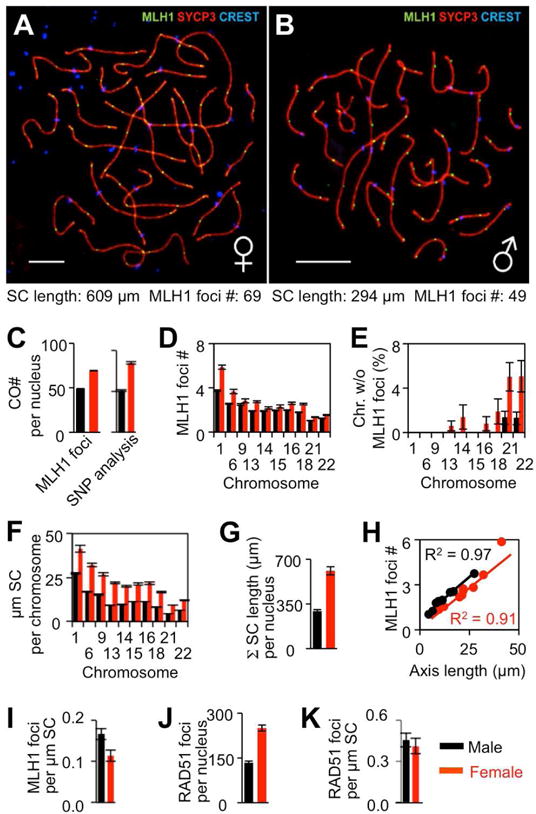
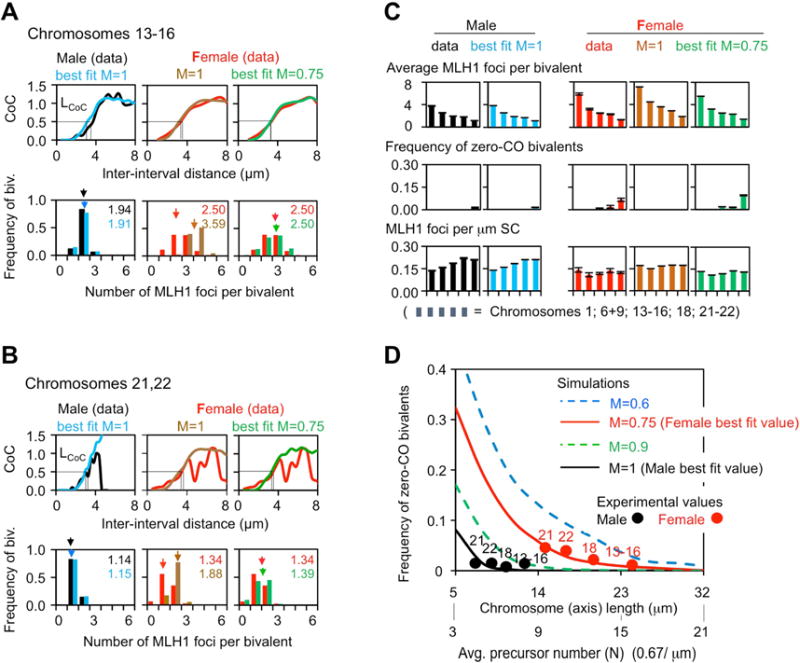
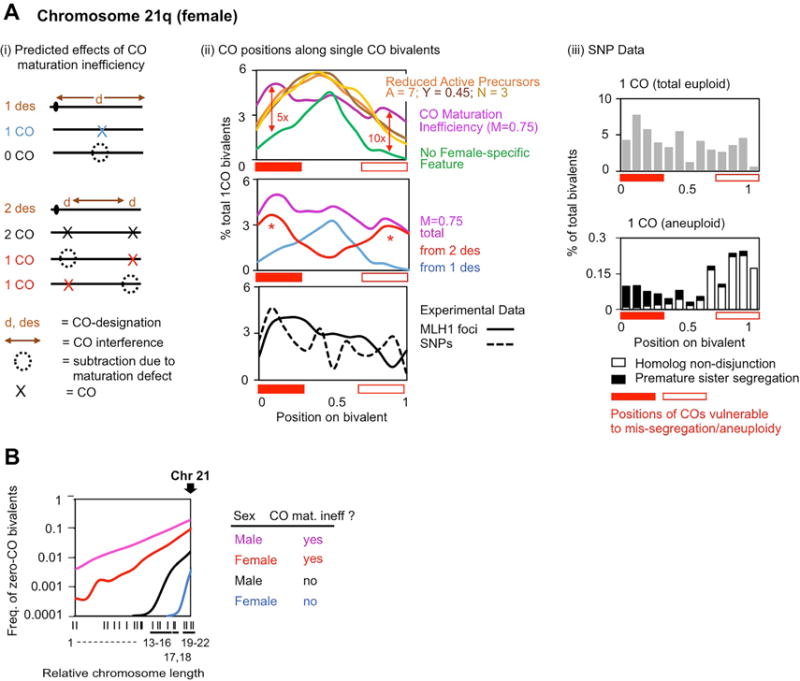
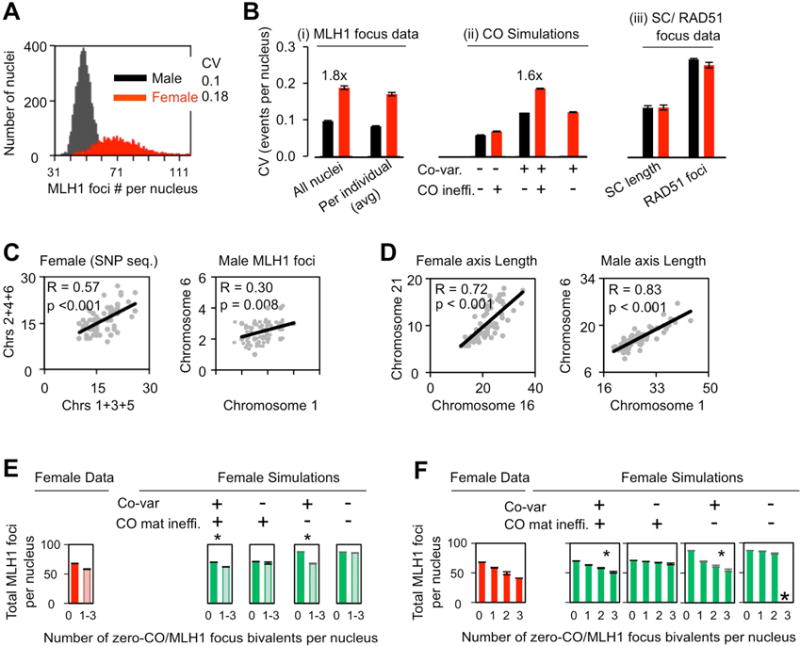
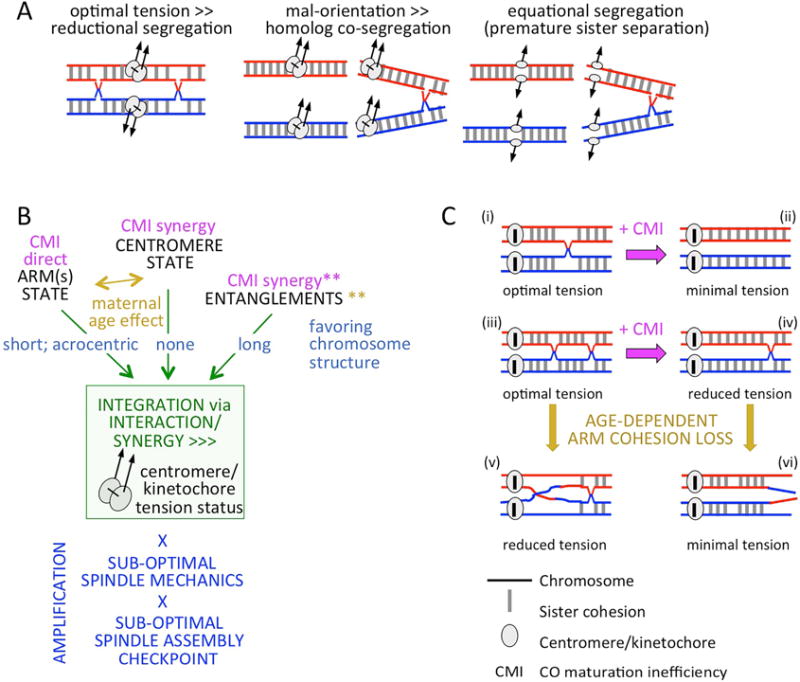
Meiosis is the cellular program that underlies gamete formation. For this program, crossovers between homologous chromosomes play an essential mechanical role to ensure regular segregation. We present a detailed study of crossover formation in human male and female meiosis, enabled by modeling analysis. Results suggest that recombination in the two sexes proceeds analogously and efficiently through most stages. However, specifically in female (but not male), ∼25% of the intermediates that should mature into crossover products actually fail to do so. Further, this "female-specific crossover maturation inefficiency" is inferred to make major contributions to the high level of chromosome mis-segregation and resultant aneuploidy that uniquely afflicts human female oocytes (e.g., giving Down syndrome). Additionally, crossover levels on different chromosomes in the same nucleus tend to co-vary, an effect attributable to global per-nucleus modulation of chromatin loop size. Maturation inefficiency could potentially reflect an evolutionary advantage of increased aneuploidy for human females.


Figures

Figure 1
Figure 1. CO formation and patterning via chromosome structure
Prophase chromosomes comprise co-oriented sister linear loop arrays, along which DSBs occur in tethered loop-axis complexes (top line). DSBs mediate homolog pairing via inter-axis bridge ensembles (green lines), which are presumptively the undifferentiated precursors acted upon by CO-designation and accompanying interference (red arrows). Via this process, CO-designation events are evenly spaced along the chromosomes and their number scales with physical chromosome length (compare male versus female). In contrast to male (left), in female (right) ~25% of CO-designated interactions fail to finally mature into an actual CO (bottom line). See also Figure S1.
Figure 2
Figure 2. Analysis of male and female COs and SCs
(A,B) Surface spread of pachytene bivalents in human primary oocyte (A) and spermatocyte (B). SC-linked axes are Immunostained by axis marker SYCP3, CO-diagnostic foci by MLH1 and centromeres by CREST. Scale bars, 10 μm. (C–K) Comparisons of chromosome features in males (black) and females (red). Bars = Standard Error (SE) in (C–G, J) and 95% confidence intervals in (I, K). p-values for male/female differences in (C–J) are <0.001, one-tailed, except in (D) p=0.06 for chromosome 9 and p=0.004 for chromosome 15. p=0.35 (K). p-values determined by Mann-Whitney test for (C), (D), (F), (G), (J); Fisher’s Exact test for (E); Pearson correlation test for (H) and from confidence intervals in (I, K). Data sources, sample sizes and further details of statistical analysis are given in STAR Methods. See also Figure S1.
Figure 3
Figure 3. Simulation analysis of male and female CO patterns
CO patterns from MLH1 focus analysis (male black and female red) were compared with patterns predicted from fill-in-the-holes simulation analyses performed under conditions of interest (text; STAR Methods). (A,B) Descriptions for two groups of similar chromosomes: 13–16 (A) and 21–22 (B). Top: Coefficient of Coincidence (CoC) curves; bottom: frequencies of bivalents with different numbers of COs (and the average). For CoC analysis, each chromosome is divided into a series of intervals. CoC is the ratio of the frequency of “observed” double COs to the frequency of “expected ”double COs, which is defined by the product of the CO frequencies in each of the two component intervals considered individually. A CoC curve plots this ratio, for every pair of intervals, as a function of inter-interval distance. In the presence of CO interference, the frequency of double COs is much lower than expected for closely-spaced intervals, increases to the level expected for independent occurrence (CoC = 1), and then fluctuates around that value due to the tendency for even spacing (STAR Methods and Figure S1). No rigorous statistical test exists to evaluate the difference between two CoC curves. However, a sensitive and reliable quantitative indicator is the inter-interval distance at which CoC = 0.5, “LCoC” (STAR Methods). Examples of non-matching CoC curves are in Figure S3. (C) The goodness-of-fit of each simulated CO number distribution per bivalent as compared to the experimental data was evaluated by the sum of the squares of the differences (SSD): Chromosome 13–16: female M=1, SSD=0.353; M=0.75, SSD=0.004. Chromosomes 21, 22: female M=1, SSD=0.349; M=0.75, SSD=0.025. (D) Simulation-predicted frequencies of zero-CO bivalents as a function of chromosome length (or, equivalently, number of “precursors”, i.e. DSBs) at different levels of maturation efficiency (“M”) (STAR Methods). Note close matches of experimental (filled circles) and predicted (curves) values. See also Figures 4B, S2–S4. MLH1 data in Table S1.
Figure 4
Figure 4. Female-specific CO maturation inefficiency: effects
(A) Observed and predicted CO patterns on chromosome 21q. (i) Cartoon of predicted effects of CO maturation inefficiency on 21q bivalents with one (top) or two COs (bottom). (ii top): CO positions on single-CO bivalents as predicted by simulations to occur either: without any type of female-specific feature/deficit (green); with CO maturation inefficiency (purple); or with CO reduction by subtraction of active CO precursors prior to CO designation/interference (three different possibilities, gold, brown and orange; text). CO maturation inefficiency uniquely gives a broad distribution (purple) that matches the experimental distribution (II bottom; panel (iii) top) and results (II, middle) from the combined effects of single-designations with ensuing CO maturation (blue) or two designations, only one of which matures to a CO (red). Red open/closed bars: positions of COs in mis-segregation-prone bivalents (panel iii bottom). Red vertical arrows (top) and red asterisks (middle): contribution of CO maturation inefficiency to such bivalents. (iii) Experimentally-defined positions of COs along single-CO bivalents that have undergone either normal segregation (top) or mis-segregation (bottom) (adapted from Oliver et al., 2014). Mis-segregations are of two different types (filled and open vertical black bars). (B) Predicted frequencies of zero-CO bivalents for males and females, with and without CO maturation inefficiency (derived from Figure 3D). Arrow: position of chromosome 21. See also Figure S5.
Figure 5
Figure 5. Variation in the total number of COs per nucleus
(A,B) Nucleus-to-nucleus variation in total CO levels is greater in female (red) versus male (black) due to global co-variation plus female-specific CO maturation inefficiency as defined by Coefficients of variation (CV). (A; B(i, left)) CVs of MLH1 foci per nucleus as defined for all nuclei taken together. (B(i, right)) Average CVs for each sex: CVs of total COs per nucleus were determined for all nuclei from each of 57 males and, separately, from 62 females. (B (ii)) CVs of total COs per nucleus (all individuals) were predicted by simulations under indicated conditions (text; STAR Methods). (B (iii)) CVs of total SC lengths per nucleus and total number of RAD51 foci per nucleus. (B): Bars = SE. Significances of male/female differences: (B (i left) p<0.001 (likelihood ratio test); (B (i right)) p<0.001 (t-test). (B (iii): For SC length, p=0.377; for RAD51 foci, p=0.61 (likelihood ratio tests). (C, D) (C, D) Co-variation of CO numbers (C), or SC lengths (D), on two different chromosomes (or comparable groups of chromosomes) within individual nuclei (Pearson correlation, one tailed). (E, F). Tendency of zero-CO bivalent(s) to occur in female nuclei with a lower total number of COs (E left); progressive clustering of multiple zero-CO bivalents in a single nucleus is correlated with a progressive decrease in the total number of COs per nucleus (F left). Simulations show that these differences are attributable to global regulation of CO levels whereas CO maturation inefficiency is not significantly involved (E right; F right). The goodness of fit of each simulated data set to experimental data was defined by SSDs: (E) Left to right: SSD=101, 62, 6, 432, 2. (F) Left to right: SSD=244, 124, 12, 439, 17; underlining marks cases with significant match (also see small asterisks). Large asterisk = no cases in 5000 nuclei. (A–F): data sources, sample sizes and further details of statistical analysis in STAR METHODS. See also Figure S6.
Figure 6
Figure 6. Contribution of CO maturation inefficiency to human female aneuploidy
(A left): regular MI segregation. (A middle and right): two types of mis-segregation due to suboptimal level of tension imposed upon homolog kinetochore complexes (as created by absence of a CO/chiasma or presence of distal COs/chiasmata; illustrated for one arm only). (B) The kinetochore complex (rectangle) can serve as a hub for integrating diverse interactive/synergistic inputs (e.g. CO maturation inefficiency (CMI) and loss of sister cohesion (maternal age effect)) into its overall “tension status” as determined by the level of tension that is either exerted upon the complex, or is sensed or transduced by the complex to the segregation process (green arrows). **When persistent, entanglements can synergize with the above effects (text), or they can be resolved by CMI and age-dependent cohesion loss. Centromere/kinetochore tension status can also be amplified by sub-optimal spindle function and/or sub-optimal SAC (bottom, blue). (C) CMI can create the two at-risk configurations shown in panel (A): (i)–(ii) and (iii)–(iv). Age-dependent loss of cohesion can cause loss of chiasma(ta) from CO-containing bivalents (iv-to-vi) or reduced mechanical linkage between chiasma and kinetochore (e.g. iii-to-v). (Illustrated for one chromosome arm only).

References

    1. Bennabi I, Terret ME, Verlhac MH. Meiotic spindle assembly and chromosome segregation in oocytes. J Cell Biol. 2016;215:611–619. - PMC - PubMed
    1. Bojko B. Human meiosis VIII: chromosome pairing and formation of the synaptonemal complex in oocytes. Carisberg Res Commun. 1983;48:457–483.
    1. Bojko M. Human meiosis IX. Crossing over and chiasma formation in oocytes. Carisberg Res Commun. 1985;50:43–72.
    1. Campbell CL, Furlotte NA, Eriksson N, Hinds D, Auton A. Escape from crossover interference increases with maternal age. Nat Commun. 2015;6:6260. - PMC - PubMed
    1. Cheng EY, Hunt PA, Naluai-Cecchini TA, Fligner CL, Fujimoto VY, Pasternack TL, Schwartz JM, Steinauer JE, Woodruff TJ, Cherry SM, et al. Meiotic recombination in human oocytes. PLoS Genet. 2009;5:e1000661. - PMC - PubMed

Complete references for Data Sources

    1. Codina-Pascual M, Campillo M, Kraus J, Speicher MR, Egozcue J, Navarro J, Benet J. Crossover frequency and synaptonemal complex length: their variability and effects on human male meiosis. Mol Hum Reprod. 2006;12:123–133. - PubMed
    1. Coop G, Wen X, Ober C, Pritchard JK, Przeworski M. High-resolution mapping of crossovers reveals extensive variation in fine-scale recombination patterns among humans. Science. 2008;319:1395–1398. - PubMed
    1. Hassold T, Judis L, Chan ER, Schwartz S, Seftel A, Lynn A. Cytological studies of meiotic recombination in human males. Cytogenet Genome Res. 2004;107:249–255. - PubMed
    2. Hou Y, Fan W, Yan L, Li R, Lian Y, Huang J, Li J, Xu L, Tang F, Xie XS, Qiao J. Genome analyses of single human oocytes. Cell. 2013;155:1492–506. - PubMed
    1. Kong A, Barnard J, Gudbjartsson DF, Thorleifsson G, Jonsdottir G, Sigurdardottir S, Richardsson B, Jonsdottir J, Thorgeirsson T, Frigge ML, et al. Recombination rate and reproductive success in humans. Nat Genet. 2004;36:1203–1206. - PubMed
    1. Pan Z, Yang Q, Ye N, Wang L, Li J, Yu D, Cooke HJ, Shi Q. Complex relationship between meiotic recombination frequency and autosomal synaptonemal complex length per cell in normal human males. Am J Med Genet. 2012;158A:581–587. - PubMed

Publication types