. 2017 Apr 4;25(4):592-602.e2.
doi: 10.1016/j.str.2017.02.004. Epub 2017 Mar 2.

Variability of Protein Structure Models from Electron Microscopy

Affiliations

Variability of Protein Structure Models from Electron Microscopy

Lyman Monroe et al. Structure. .

Abstract

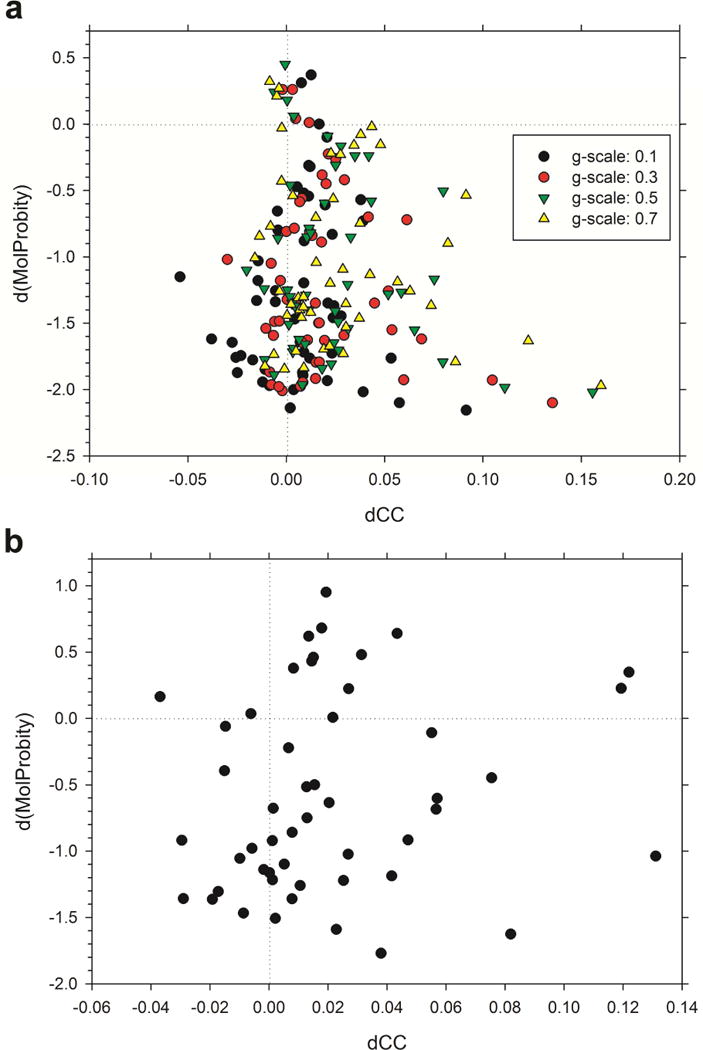
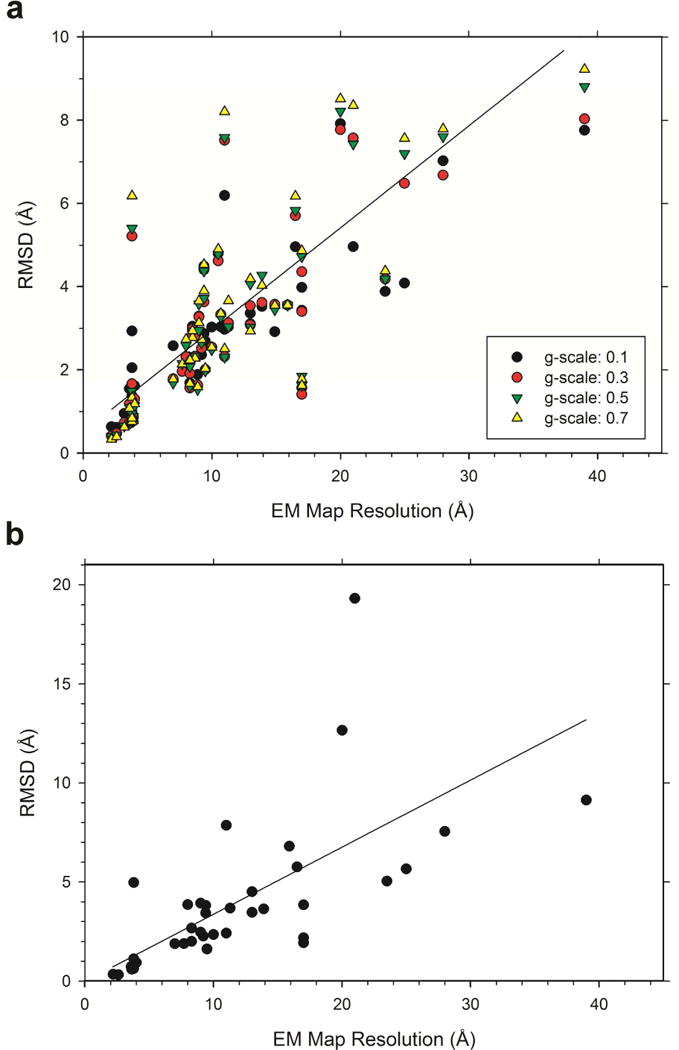
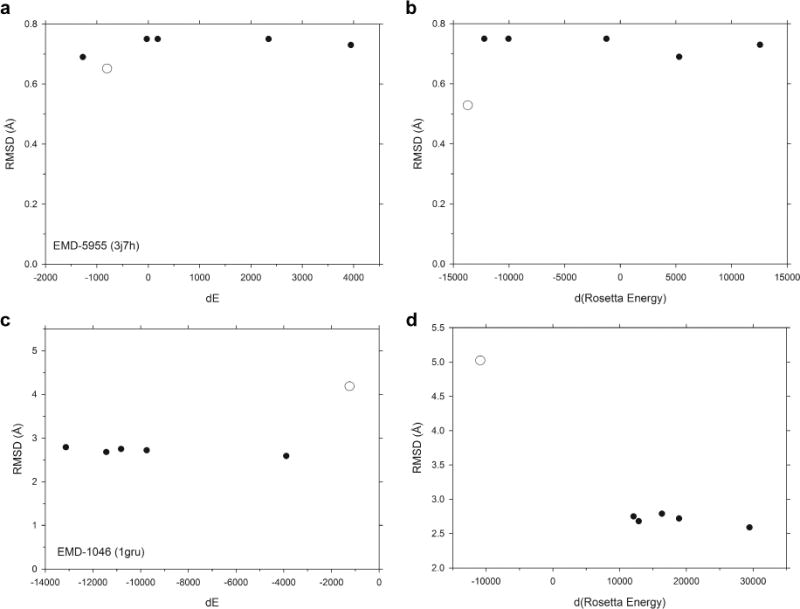
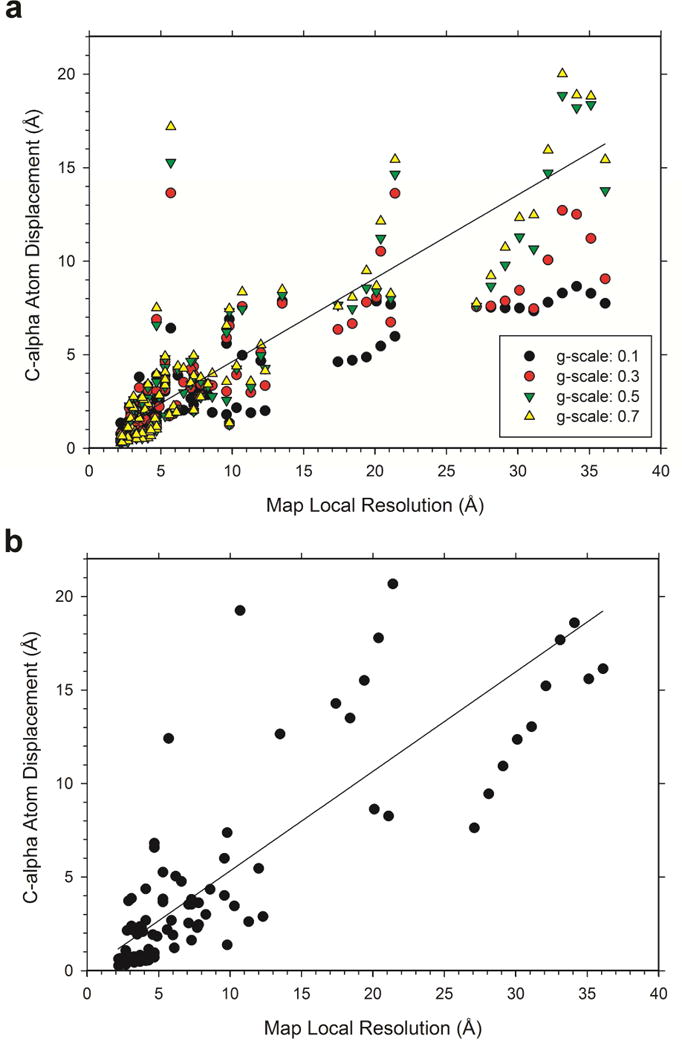
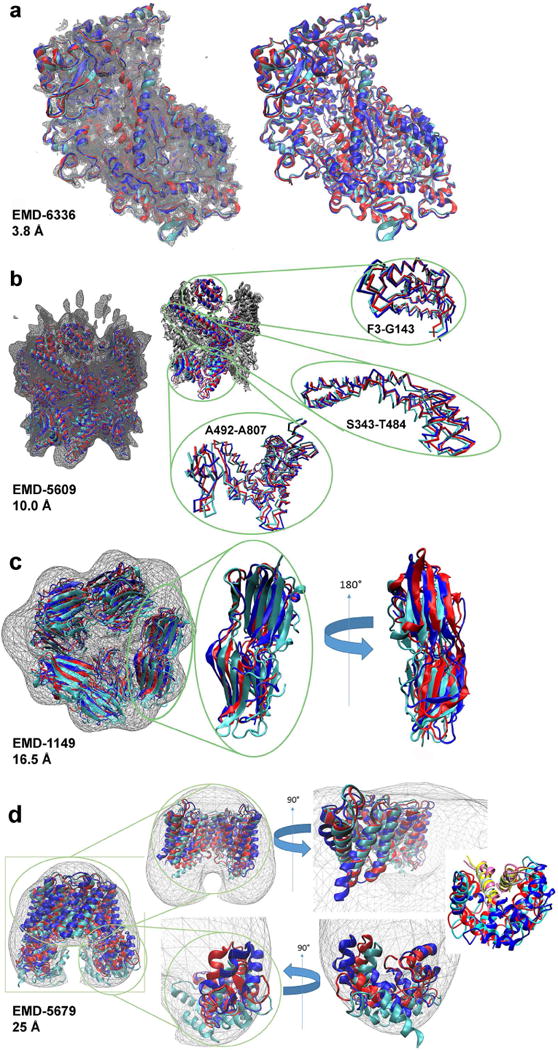
An increasing number of biomolecular structures are solved by electron microscopy (EM). However, the quality of structure models determined from EM maps vary substantially. To understand to what extent structure models are supported by information embedded in EM maps, we used two computational structure refinement methods to examine how much structures can be refined using a dataset of 49 maps with accompanying structure models. The extent of structure modification as well as the disagreement between refinement models produced by the two computational methods scaled inversely with the global and the local map resolutions. A general quantitative estimation of deviations of structures for particular map resolutions are provided. Our results indicate that the observed discrepancy between the deposited map and the refined models is due to the lack of structural information present in EM maps and thus these annotations must be used with caution for further applications.

Keywords: EMDB; computational modelling; cryo-EM; electron microscopy; model refinement; protein structure modelling; protein tertiary structure; structure biology; structure optimization.


Figures

Figure 1
Figure 1
Change in the potential energy and cross-correlation to EM maps of the refined protein structure models. The two values were computed after the refinement in comparison with the initial structure. dCC, the difference of the cross-correlation; dE, difference of the energy of structure models. (a), Results using MDFF with four different g-scale values, 0.1 (filled circles), 0.3 (red circles), 0.5 (green triangles), 0.7 (yellow triangles). The energy was evaluated with the CHARMM potential energy used in MDFF, excluding the map fitness term. The figure shows results for 47 EM maps excluding two virus capsids, EMD-2365 and EMD-5466, which showed exceptionally large positive dE (see text). The inset figure includes al 49 maps. (b), results using Rosetta. The Rosetta free energy was used.
Figure 2
Figure 2
Change in MolProbity score (MPScore) and cross correlation between initial models and final refined models. (a), MDFF refinement results; (b), models refined with Rosetta.
Figure 3
Figure 3
RMSD between the initial fitted protein model and the final structure after refinement against the resolution of their respective maps. (a), Results for MDFF with four different g-scale values, 0.1 (filled circles), 0.3 (red circles), 0.5 (green triangles), 0.7 (yellow triangles). The line shown is a weighted regression line for a g-scale of 0.5: RMSD = 0.528 + 0.247 *(map resolution). The reciprocal predicted value was used for weights. r2 is 0.541. (b), results for Rosetta. A weighted regression line using the reciprocal predicted value is shown: RMSD = −0.046 + 0.343*(map resolution). r2 is 0.504. To compute the regression lines, redundant entries of the same proteins with a similar map resolution and RMSD values were excluded. Those excluded were (GroEL: 2c7d, 2cgt, 4aau, 4ab3, 3zpz; α-1 glycine receptor: 3jad, 3jae; MacA-ClpC complex: 3j3r, 3j3s, 3j3u; β-galactosidase: 3j7h; TriC: 4a0v).
Figure 4
Figure 4
RMSD between the refined models using MDFF and Rosetta. (a), RMSD between Rosetta and MDFF refined models relative to the map resolutions. For MDFF, the four different g-scales were used. The color code is the same as Figs. 1 and 3. (b), RMSD between refined models by Rosetta and refined models by MDFF with a g-scale of 0.5 relative to the cases when a g-scale of 0.1 was used for MDFF.
Figure 5
Figure 5
Comparison with other crystal structures. For two examples of EM maps with associated PDB entry, RMSD and the energy difference with other crystal structures were computed. (a), (b), beta-galactosidase, EMD-5955 (PDB ID: 3j7h), solved at 3.2 Å. (a) shows the CHARMM energy difference; and (b) shows the difference in term of the Rosetta energy with RMSD between 3j7h and five other crystal structures of the same protein, 1f4h, 1hn1, 1jz2, 3iaq, and 3t2o (solid circles). The open circle is the refined structure by (a) MDFF (g-scale 0.5) and (b) Rosetta, compared with 3j7h. For the CHARMM energy, structures were evaluated at the start of the refinement, after the initial energy minimization was applied and the temperature is raised to 300K, in the same way as the earlier figures. (c), (d), GroEL, EMD-1046 (PDB ID: 1gru), solved at 23.5 Å. Crystal structures used were 1aon, 1pcq, 1pf9, 1svt, and 1sx4 (solid circles).
Figure 6
Figure 6
Distances of Cα atoms moved by the refinement relative to the local resolution maps. Local map resolution was computed with ResMap. For an EM map, the displacements of Cα atoms for grid positions with the same local resolution were averaged. Data for a resolution was discarded if less than 10 Cα atoms belonged to the resolution. (a), Results for MDFF with four different g-scale values, 0.1 (filled circles), 0.3 (red circles), 0.5 (green triangles), 0.7 (yellow triangles). The line shown is a weighted regression line for a g-scale of 0.5: Cα displacement = 0.124 + 0.446 *(local map resolution). The reciprocal predicted value was used for weights. r2 is 0.597. (b), results for Rosetta. A weighted regression line using the reciprocal predicted value is shown: RMSD = −0.03 + 0.533*(map resolution). r2 is 0.567.
Figure 7
Figure 7
Example of structure refinements. The overlay of selected initial and refined structures produced by MDFF (using a g-scale of 0.5) and Rosetta are colored cyan, blue, and red respectively. Density maps for these structures are shown as gray wire frames. (a), The 3.8 Å resolution map of L-protein of vesicular stomatitis virus (EMDB ID: 6337) and its atomic model (PDB ID: 5a22) (left), as well as the atomic model shown without the wire frame map for visual clarity (right). (b), The 10.0 Å resolution map, EMD-5609, and its structure model (PDB ID: 3j3u) of MecA-ClpC complex (left). The structures with the A chain shown in color, while the rest of the complex is shown in white (center). Selected domains are isolated and magnified for visual clarity (right). The residue range of these domains are included as insets near each image. (c), The 16.5 Å resolution map (EMDB: 1149) and its structure model (PDB ID: 2byu) of small heat shock protein Arc 1 (left). An isolated subunit of the structure magnified for visual clarity (center). A 180-degree rotated view of the isolated subunit (right). (d), A 25 Å resolution map (EMDB: 5649) and its structure model (PDB ID: 3j41) of aquaporin-O/calmodulin complex (left). Map and structure of the core region of the complex with lobe domains and front half of core removed for ease of viewing (top center). A rotated view of the core domain (top right). Magnification of a single lobe calmodulin domain with core domain removed (bottom center) and a rotated view of the calmodulin domain (bottom right). Interaction with the calmodulin domain with two helices (chain C, D: 225–241) (shown in yellow, light blue, and pink for the original structure model, the model from MDFF, and the Rosetta model, respectively) are highlighted in far right.

Similar articles

Cited by

References

    1. Bradley P, Misura KM, Baker D. Toward high-resolution de novo structure prediction for small proteins. Science. 2005;309:1868. - PubMed
    1. Ceulemans H, Russell RB. Fast fitting of atomic structures to low-resolution electron density maps by surface overlap maximization. Journal of molecular biology. 2004;338:783–793. - PubMed
    1. Chen VB, Arendall WB, 3rd, Headd JJ, Keedy DA, Immormino RM, Kapral GJ, Murray LW, Richardson JS, Richardson DC. MolProbity: all-atom structure validation for macromolecular crystallography. Acta crystallographica Section D, Biological crystallography. 2010;66:12–21. - PMC - PubMed
    1. DiMaio F, Tyka MD, Baker ML, Chiu W, Baker D. Refinement of protein structures into low-resolution density maps using rosetta. Journal of molecular biology. 2009;392:181–190. - PMC - PubMed
    1. Dror O, Lasker K, Nussinov R, Wolfson H. EMatch: an efficient method for aligning atomic resolution subunits into intermediate-resolution cryo-EM maps of large macromolecular assemblies. Acta crystallographica Section D, Biological crystallography. 2007;63:42–49. - PMC - PubMed

Publication types

LinkOut - more resources