. 2017 Mar 22;93(6):1375-1387.e2.
doi: 10.1016/j.neuron.2017.02.025. Epub 2017 Mar 2.

Cell-Autonomous Excitation of Midbrain Dopamine Neurons by Endocannabinoid-Dependent Lipid Signaling

Affiliations

Cell-Autonomous Excitation of Midbrain Dopamine Neurons by Endocannabinoid-Dependent Lipid Signaling

Stephanie C Gantz et al. Neuron. .

Abstract

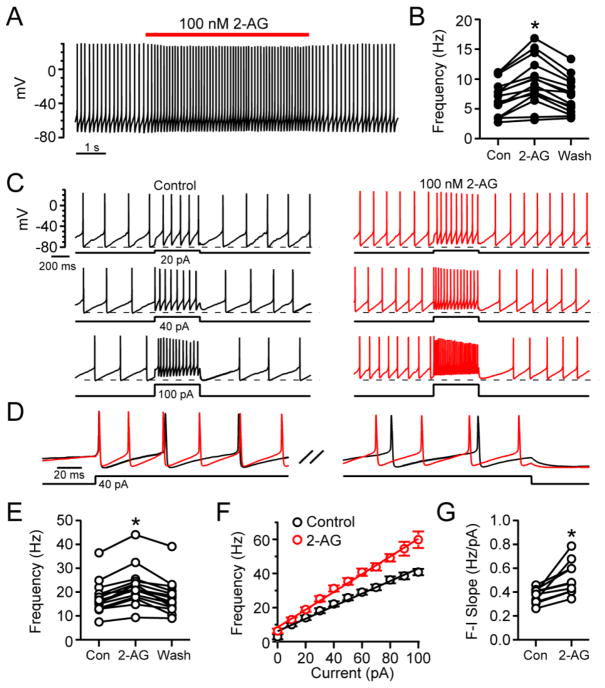
The major endocannabinoid in the mammalian brain is the bioactive lipid 2-arachidonoylglycerol (2-AG). The best-known effects of 2-AG are mediated by G-protein-coupled cannabinoid receptors. In principle, 2-AG could modify neuronal excitability by acting directly on ion channels, but such mechanisms are poorly understood. Using a preparation of dissociated mouse midbrain dopamine neurons to isolate effects on intrinsic excitability, we found that 100 nM 2-AG accelerated pacemaking and steepened the frequency-current relationship for burst-like firing. In voltage-clamp experiments, 2-AG reduced A-type potassium current (IA) through a cannabinoid receptor-independent mechanism mimicked by arachidonic acid, which has no activity on cannabinoid receptors. Activation of orexin, neurotensin, and metabotropic glutamate Gq/11-linked receptors mimicked the effects of exogenous 2-AG and their actions were prevented by inhibiting the 2-AG-synthesizing enzyme diacylglycerol lipase α. The results show that 2-AG and related lipid signaling molecules can directly tune neuronal excitability in a cell-autonomous manner by modulating IA.


Figures

Figure 1
Figure 1. 2-AG speeds both pacemaking and evoked burst-like firing
(A) Whole-cell current-clamp recording demonstrating the acceleration of spontaneous AP firing by application of 100 nM 2-AG. (B) Plot of mean spontaneous firing rate showing the increase in frequency by 2-AG (p<0.001, n=15). (C) Representative traces of whole-cell current-clamp recording of spontaneous AP firing and AP firing evoked by current injection (500 ms), demonstrating 2-AG acceleration of spontaneous and evoked AP firing. Dashed line is at −80 mV. (D) Middle traces in C superimposed on an expanded time scale. (E) Plot of initial firing frequency (first three APs) evoked by 20 pA current injection for each cell showing the increase in frequency by 2-AG (p<0.001, n=15). (F) Plot of initial firing frequency (first three APs) versus injected current in control (black) and 100 nM 2-AG (red); means±SEM, linear fit from 0 to 100 pA indicates mean F-I slope. (G) F-I slopes for each cell, determined by linear fit from 0 to 100 pA, showing the increase by 2-AG (p=0.002, n=10). Wash solution contained 1 mg/ml BSA for rapid reversibility. In some experiments, control solution also contained BSA. * denotes statistical significance.
Figure 2
Figure 2. 2-AG alters the AP waveform
(A) Average AP waveforms recorded in control (black) and in 100 nM 2-AG (red), aligned at peaks. Right, expanded time scale. (B) 2-AG did not change the spontaneous AP width (measured at midpoint between the peak and trough, p=0.85, n=15) (C) 2-AG decreased the spontaneous AP after hyperpolarization (AHP, measured at the trough following the AP, p<0.001, n=15). (D) 2-AG increased the interspike slope during both spontaneous (left) and evoked (right) firing (measured in the middle 60% of the interspike interval, p<0.001, n=15). (B–D) offset points: means±SEM. In some experiments, control solution contained 1 mg/ml BSA. * denotes statistical significance, ns indicates not significant.
Figure 3
Figure 3. 2-AG inhibits A-type potassium current
(A) Left: Current evoked by a voltage-step from −108 to −28 mV, in control Tyrode’s solution (black) and after 100 nM 2-AG (red). IA was measured as the peak of the rapidly inactivating component. Right: IA shown on an expanded time scale with application of 100 nM (red), 1 μM (green), or 10 μM (blue) 2-AG (three different experiments). (B) IA was activated as in A, once every 5 s. Normalized plot of IA amplitude versus time during application of 100 nM (red, n=11), 1 μM (green, n=7), and 10 μM (blue, n=34) 2-AG, means±SEM. (C) 2-AG inhibited IA in a concentration-dependent manner, (30 nM: p=0.004, n=9; 100 nM: p=0.001, n=11; 300 nM: p=0.001, n=11; 1 μM: p=0.02, n=7; 3 μM: p=0.02, n=7; 10 μM: p<0.001, n=34; 30 μM: p=0.02, n=7), means ± SEM. (D) 2-AG decreased the inactivation time constant of IAfast, determined by a single exponential fit) in a concentration-dependent manner, shown relative to τfast in control (100 nM: p=0.001, n=11; 1 μM: p=0.02, n=7; 10 μM: p<0.001, n=33), means±SEM. See also Figure S1 and S2.
Figure 4
Figure 4. 2-AG shifts the voltage-dependent activation of A-type potassium current
(A) IA in control Tyrode’s solution (black) and with 1 μM 2-AG (green). IA was isolated using a two-pulse voltage protocol, first evoking total potassium current by 500 ms steps from −88 mV, then inactivating IA by a 500 ms step to −58 mV preceding a second 500 ms test step, with IA obtained by subtracting currents during the two test steps. (B–D) Conductance was determined from the peak IA evoked from a holding potential of −88 mV, calculated using a reversal potential of −90 mV. Solid lines represent fit of the data to a Boltzmann function. (B–C) Change in conductance-voltage relationship by 1 μM 2-AG (B, green) or 10 μM 2-AG (C, blue). (D) Normalized conductance-voltage plots demonstrating the rightward shift in IA activation in 1 μM (green) or 10 μM 2-AG (blue) relative to control (black), means±SEM. (E) 2-AG (300 nM-10 μM) produced a significant rightward shift in the average midpoint of activation (Vh, ns = 6–12), means±SEM, * denotes statistical significance. See also Figure S3.
Figure 5
Figure 5. Inhibition of A-type potassium current by 2-AG does not require cannabinoid receptors or G protein signaling
(A) IA inhibition by 2-AG in control Tyrode’s solution (left, Control: black, 2-AG: grey) and in the combined presence of CB1 and CB2 receptor inverse agonists (right, 1 μM AM251 and 1 μM AM630, AMs: teal, 2-AG: grey). (B) IA was activated as in A, once every 5 s. Normalized plot of IA amplitude versus time during application of 3 μM 2-AG in control (black, n=7) and in AM251 and AM630 (teal, n=13–14), means±SEM. (C) Change in inactivation time constant of IAfast, determined by a single exponential fit) by 3 μM 2-AG (applied in the presence of AM251 and AM630 (p<0.001, n=12) (D) Inhibition of IA by 3 μM 2-AG in control, AM251 and AM630, NESS 0327 (1 nM), SR 144528 (10 nM), or NESS 0327 and SR 144528, means±SEM (E) Change in Vh by 3 μM 2-AG in control, AM251 and AM630, NESS 0327, SR 144528, or NESS 0327 and SR 144528, means±SEM. (F) With GDPβS-containing internal solution, repeated application of 10 μM 2-AG robustly inhibited the amplitude of IA, shown as a representative experiment (left, grey bars indicate time of 2-AG application) and in collected results (right, means±SEM). For experiments with repeated application of 2-AG, control solution contained 1 mg/ml BSA. * denotes statistical significance, ns indicates not significant.
Figure 6
Figure 6. Arachidonic acid excites dopamine neurons and inhibits A-type potassium current
(A) Representative traces of whole-cell current-clamp recording of spontaneous AP firing and AP firing evoked by current injection (500 ms, 20 pA), demonstrating arachidonic acid (AA) acceleration of spontaneous and evoked AP firing. Dashed line is at −80 mV. (B) Plot of mean spontaneous firing rate showing the increase in frequency by AA (p<0.001, n=7). (C) Plot of initial firing frequency (first three APs) evoked by 20 pA current injection for each cell showing the increase in frequency by AA (p<0.05, n=7). (D) Plot of F-I slopes for each cell (determined by linear fit from initial firing frequency (first three APs) versus injected current to 100, showing the increase by AA (p<0.05, n=7). Wash solution contained 1 mg/ml BSA for reversibility. In some experiments, control solution also contained BSA. (E) IA activated by a voltage step from −108 to −28 mV in control (black) and after application of AA (100 nM, red). (F) 100 nM AA significantly inhibited the amplitude of IA (p=0.001, n=11) shown with 2-AG (100 nM) data from Figure 3C to aid visual comparison. (G)100 nM AA decreased the inactivation time constant of IAfast, determined by a single exponential fit, p=0.002, n=11) relative to τfast in control, shown with 2-AG (100 nM) data from Figure 3D to aid visual comparison. * denotes statistical significance. See also Figure S4.
Figure 7
Figure 7. Effects of 2-AG on A-type potassium current are reversed by external BSA
(A) IA in control Tyrode’s solution (black), 10 μM 2-AG (blue), and after (Left) 1 min wash in Tyrode’s (grey) or (Right) 1 min wash in Tyrode’s solution with 1 mg/ml BSA (brown). (B–C) IA was activated as in A, once every 5 s. (B) Normalized plot of IA amplitude versus time during application of 10 μM 2-AG and wash in Tyrode’s solution (blue, n=6–8) or Tyrode’s solution with 1 mg/ml BSA (brown, n=5–9), means±SEM. (C) Normalized plot of the inactivation time constant of IAfast, determined by a single exponential fit) during application of 10 μM 2-AG and wash in Tyrode’s solution (blue, n=4–8) or Tyrode’s solution with 1 mg/ml BSA (brown, n=5–9), means±SEM. See also Figure S5.
Figure 8
Figure 8. Mobilization of 2-AG by Gq/11 protein-coupled receptors inhibits A-type potassium current
(A) Effect of agonists (red) for the mGluR (DHPG), orexin (orexin A), or neurotensin (NT) receptors on IA activated by a voltage step from −108 to −28 mV. (B) IA recorded during exposure to the same agonists applied in Tyrode’s solution with 1 mg/ml BSA. (C) IA recorded during exposure to the same agonists applied in the presence of the DGLα inhibitor THL (100 nM). (D) IA recorded during exposure to the same agonists applied after intracellular dialysis of the PLC inhibitor U73122 (1 μM). (E) IA was activated as in A, once every 5 s. Normalized plot of IA amplitude versus time during application of 10 μM DHPG in control (black, n=8–12), Tyrode’s with BSA (brown, n=8–9), or THL (dark grey, n=7–9), or after intracellular dialysis of U73122 (light grey, n=5–6), means±SEM. (F) In Tyrode’s, DHPG, orexin A, and NT inhibited IA amplitude (black, DHPG: p<0.001, n=12; orexin A: p=0.004, n=9; NT: p=0.02, n=8). When applied in Tyrode’s with BSA (brown), in THL (dark grey), or after intracellular dialysis with U73122 (light grey), DHPG, orexin A, and NT had little or no effect on the amplitude of IA (in BSA: DHPG: p>0.999, n=8; orexin A: p=0.11, n=8; NT: p=0.20, n=8; in THL: DHPG: p=0.31, n=8; orexin A: p=0.08, n=7; NT: p=0.95, n=8; in U73122: DHPG: p=0.69, n=6; orexin A: p=0.03, n=6; NT: p=0.03, n=6), means±SEM. * denotes statistical significance, ns indicates not significant. See also Figure S7.
Figure 9
Figure 9. Working model for the inhibition of A-type potassium current by 2-AG
Activation of Gq/11 protein-coupled receptors (GqPCR) mobilizes 2-AG through the activation of phospholipase C (PLC), generation of diacylglyercol (DAG), and conversion of DAG to 2-AG by DAG lipase (DAGL). 2-AG inhibits IA by lipid interaction with Kv4.3 channels. 2-AG may be converted to structurally-related metabolites, such as arachidonic acid (AA), through MAG lipase (MAGL) or another enzyme. If produced, AA can inhibit IA by a similar mechanism. This pathway may be activated by calcium entry during high frequency action potential firing, but weakly in comparison to activation of GqPCRs. This cell-autonomous, autocrine signaling mechanism enhances the excitability of dopamine neurons.

Comment in

Similar articles

Cited by

References

    1. Alger BE, Kim J. Supply and demand for endocannabinoids. Trends Neurosci. 2011;34:304–315. - PMC - PubMed
    1. Alle H, Kubota H, Geiger JR. Sparse but highly efficient Kv3 outpace BKCa channels in action potential repolarization at hippocampal mossy fiber boutons. J Neurosci. 2011;31:8001–8012. - PMC - PubMed
    1. Amendola J, Woodhouse A, Martin-Eauclaire MF, Goaillard JM. Ca2/cAMP-sensitive covariation of I(A) and I(H) voltage dependences tunes rebound firing in dopaminergic neurons. J Neurosci. 2012;32:2166–2181. - PMC - PubMed
    1. Amorós I, Barana A, Caballero R, Gómez R, Osuna L, Lillo MP, Tamargo J, Delpón E. Endocannabinoids and cannabinoid analogues block human cardiac Kv4.3 channels in a receptor-independent manner. J Mol Cell Cardiol. 2010;48:201–210. - PubMed
    1. Bacci A, Huguenard JR, Prince DA. Long-lasting self-inhibition of neocortical interneurons mediated by endocannabinoids. Nature. 2004;431:312–316. - PubMed

MeSH terms

LinkOut - more resources