. 2017 Mar 16;65(6):1014-1028.e7.
doi: 10.1016/j.molcel.2017.01.032. Epub 2017 Mar 2.

Mitochondrial Ca2+ Uniporter Is a Mitochondrial Luminal Redox Sensor that Augments MCU Channel Activity

Affiliations

Mitochondrial Ca2+ Uniporter Is a Mitochondrial Luminal Redox Sensor that Augments MCU Channel Activity

Zhiwei Dong et al. Mol Cell. .

Abstract

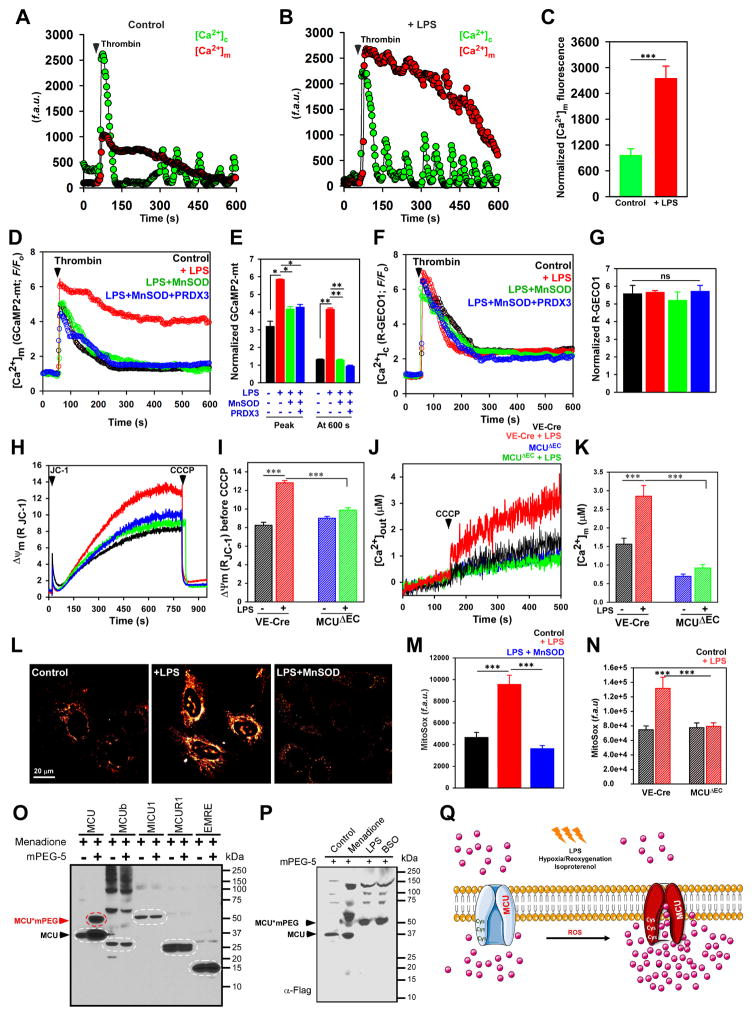
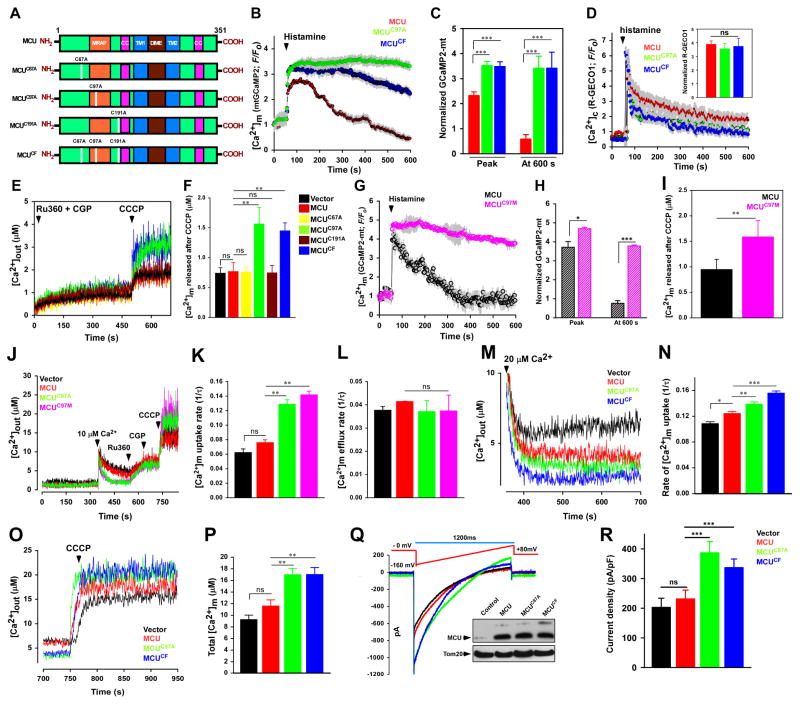
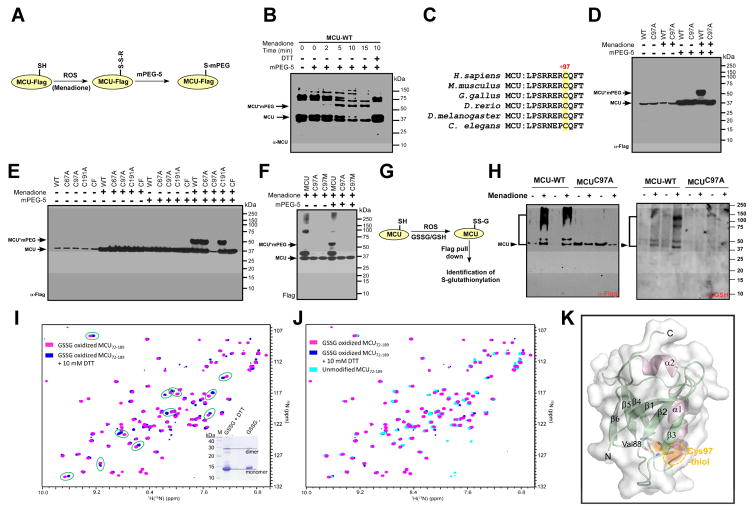
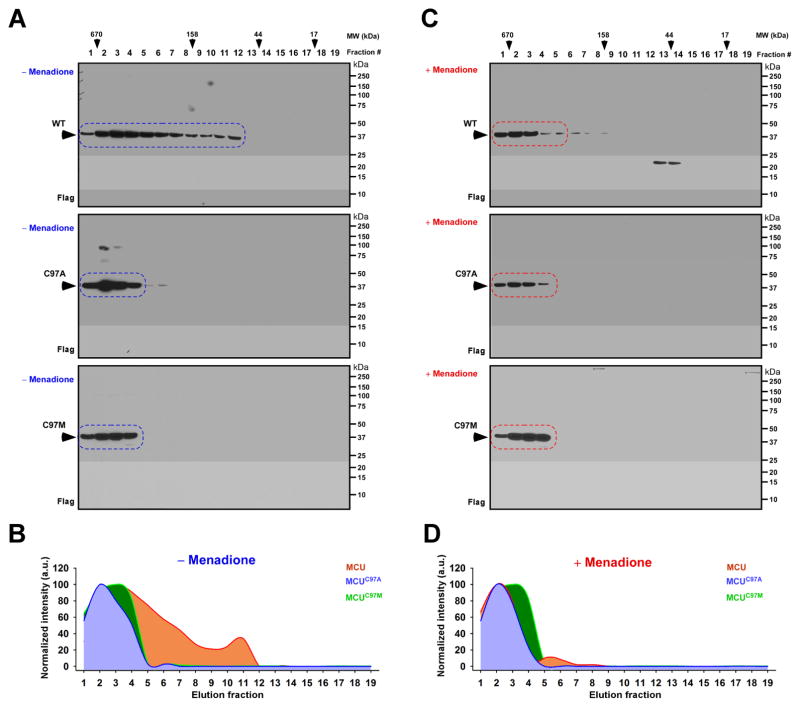
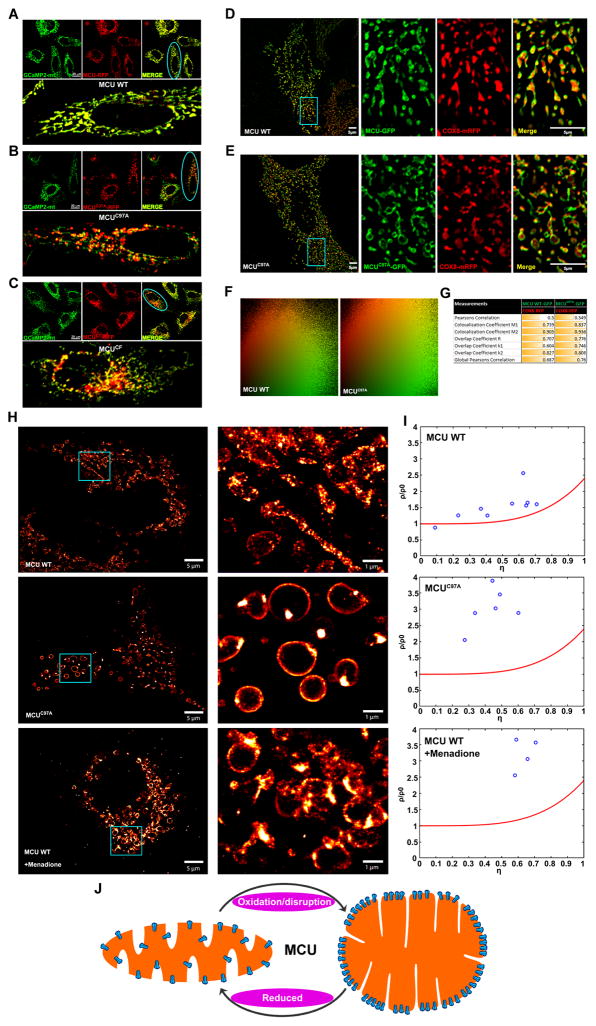
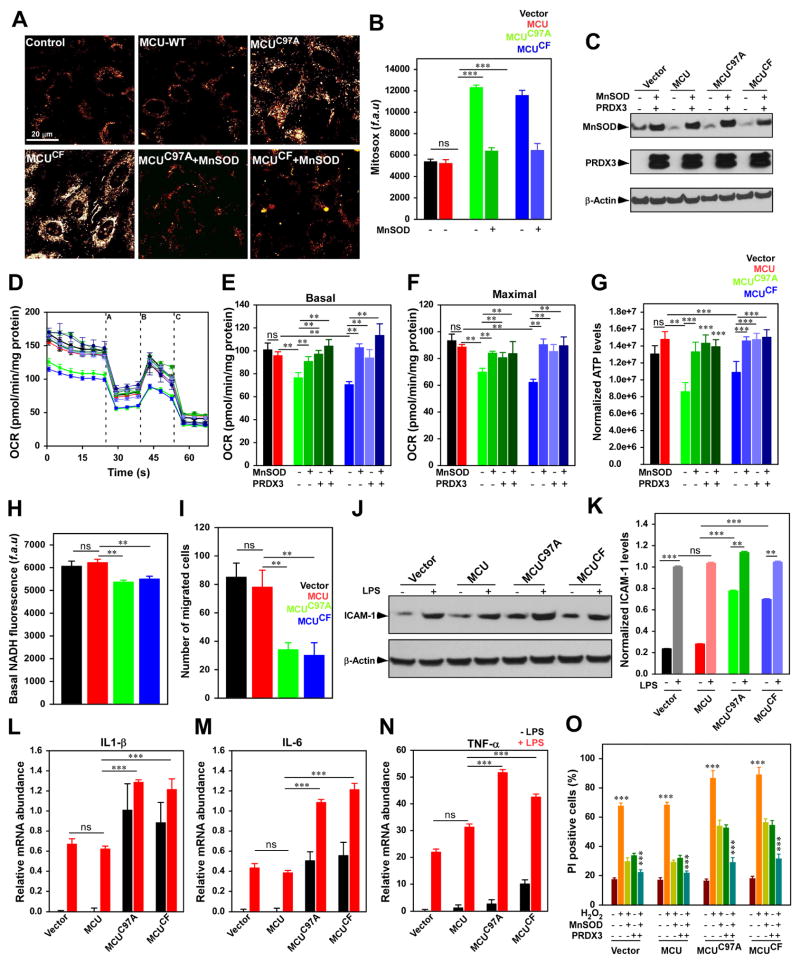
Ca2+ dynamics and oxidative signaling are fundamental mechanisms for mitochondrial bioenergetics and cell function. The MCU complex is the major pathway by which these signals are integrated in mitochondria. Whether and how these coactive elements interact with MCU have not been established. As an approach toward understanding the regulation of MCU channel by oxidative milieu, we adapted inflammatory and hypoxia models. We identified the conserved cysteine 97 (Cys-97) to be the only reactive thiol in human MCU that undergoes S-glutathionylation. Furthermore, biochemical, structural, and superresolution imaging analysis revealed that MCU oxidation promotes MCU higher order oligomer formation. Both oxidation and mutation of MCU Cys-97 exhibited persistent MCU channel activity with higher [Ca2+]m uptake rate, elevated mROS, and enhanced [Ca2+]m overload-induced cell death. In contrast, these effects were largely independent of MCU interaction with its regulators. These findings reveal a distinct functional role for Cys-97 in ROS sensing and regulation of MCU activity.

Keywords: EMRE; MCU; MCUR1; MICU1; MICU2; bioenergetics; calcium; gluathionylation; mitochondria; reactive oxygen species.


Figures

Figure 1
Figure 1. Hypoxia and Inflammatory-Mediated Oxidative Stress Alters Sensitivity of MCU and [Ca2+]m Uptake
(A and B) Mean traces for [Ca2+]c (Fluo-4) and [Ca2+]m (rhod-2) responses in HPMVECs treated with (B) or without (A) LPS (10 μg/ml) for 5 h. Cells were stimulated with thrombin (1 mU/ml) and changes in [Ca2+]c and [Ca2+]m fluorescence were measured. (C) Quantification of peak rhod-2 fluorescence. Bar represents Mean ± SEM; *** P <0.001; n = 3. (D) Mean traces for [Ca2+]m (GCaMP2-mt) fluorescence measured in control, LPS, LPS + MnSOD, and LPS+MnSOD + PRDX3 treated HPMVECs. (E) Quantification of normalized GCaMP2-mt fluorescence at peak and 600 s. Bar represents Mean ± SEM; * P <0.05; n = 4–7. (F) Mean traces of [Ca2+]c R-Geco fluorescence in HPMVECs. (G) Quantification of normalized R-GECO1 fluorescence at peak. Bar represents Mean ± SEM; * P <0.05; n = 4–7. (H) Representative traces of mitochondrial membrane potential (ΔΨm) in control (VE-Cre) and MCUΔEC MPMVECs treated with or without LPS. (I) Quantification of the ΔΨm before CCCP addition. Bar represents Mean ± SEM; *** P <0.001; n = 4–7. (J) Representative [Ca2+]out traces before and after CCCP (3 μM) in VE-Cre and MCUΔEC MPMVECs treated with or without LPS. (K) Quantification of resting matrix [Ca2+]m after the addition of CCCP. Data represents Mean ± SEM; **P <0.01; ns = not significant; n = 4. (L) Representative images showing MitoSox Red fluorescence. (M) Bar graph indicates MitoSox Red fluorescence in HPMVECs. Data indicate Mean ± SEM; *** P <0.001. n=4–6. (N) Quantification of MitoSox Red fluorescence. Data represents Mean ± SEM; ***P <0.01; ns = not significant; n = 4. (O) Oxidative stress-induced modification of MCU complex components. Lysates were prepared, incubated with mPEG5 and Western blotted with FLAG antibody (n = 3). (P) HPMVECs expressing MCU (Ad MCU) were exposed to menadione (10 μM), LPS (10 μg/ml) or BSO (200 μM). Lysates were prepared, incubated with mPEG5 and Western blotted with FLAG antibody (n = 3). (Q) Cartoon depicting the oxidation of MCU alters MCU-mediated [Ca2+]m uptake during oxidative stress.
Figure 2
Figure 2. Oxidative Stress Modulates MCU Channel Activity
(A) Schematic of full length MCU depicting its functional domains and mutations in cysteine residues (C67A, C97A, C191A, and CF). (B) Mean traces of [Ca2+]m (GCaMP2-mt) fluorescence in HeLa cells expressing MCU, MCUC97A, and MCUCF. (C) Quantification of normalized GCaMP2-mt fluorescence at peak and 600 s. Data represents Mean ± SEM; ***P <0.001; n = 4–6. (D) Mean traces of [Ca2+]c (R-Geco) fluorescence measured in HeLa cells expressing MCU, MCUC97A, and MCUCF. Insert is the peak quantification of R-Geco fluorescence after histamine stimulation. Data represents Mean ± SEM; ***P <0.001; n = 4–6. (E) Representative [Ca2+]out traces before and after CCCP (3 μM) addition in HEK293T cells stably expressing control vector, MCU, MCUC67A, MCUC97A, MCUC191A, and MCUCF. (F) Quantification of resting matrix [Ca2+]m after the addition of CCCP. Data represents Mean ± SEM; **P <0.01; ns = not significant; n = 4. (G) Mean traces of [Ca2+]m (GCaMP2-mt) fluorescence in HeLa cells expressing MCU and MCUC97M. (H) Quantification of normalized GCaMP2-mt fluorescence at peak and 600 s. Data represents Mean ± SEM; ***P <0.001; n = 4–6. (I) Quantification of resting matrix [Ca2+]m after the addition of CCCP as in Figure 2E. Data represents Mean ± SEM; **P <0.01; ns = not significant; n = 4. (J) Representative traces of [Ca2+]out in control and MCU mutant HEK293T cells. (K) Quantification of the rate of [Ca2+]m uptake as a function of decrease in [Ca2+]out after 10 μM Ca2+ pulse. Data represents Mean ± SEM; **P <0.01; ns = not significant; n = 4. (L) Quantification of the rate of [Ca2+]m efflux. Data represents Mean ± SEM; **P <0.01; ns = not significant; n = 4. (M) Representative [Ca2+]out traces in HEK293T cells stably expressing control vector, MCU, MCUC97A, and MCUCF. (N) Quantification of the rate of [Ca2+]m uptake as a function of decrease in [Ca2+]out. Data represents Mean ± SEM; * P <0.05, **P <0.01, ***P <0.001; n = 4. (O) Representative [Ca2+]out traces in HEK293T cells stably expressing control and MCU mutants. (P) Quantification of total matrix [Ca2+]m released following 20 μM Ca2+ pulse. Data represents Mean ± SEM; **P <0.01; n = 4. (Q) IMCU current in mitoplasts derived from HEK293T control and MCU mutant cells. The inset is a representative Western blot probed with an antibody specific for MCU (R) IMCU densities (pA/PF) in mitoplasts derived from control vector, MCU, MCUC97A, and MCUCF. Data represents Mean ± SEM; ***P <0.001; n = 5–9.
Figure 3
Figure 3. MCU Senses Mitochondrial Matrix ROS and MCU Cys-97 Undergoes S-glutathionylation
(A) Scheme illustrating identification of reactive cysteine in MCU. (B) Menadione-induced modification of MCU. Modified MCU was identified by Western blot analysis and probed with MCU antibody. (C) Alignment of conserved cysteine residue in MCU. (D) Lysates from HEK293T cells stably expressing MCU or MCUC97A treated with menadione were incubated with mPEG5. (E) Representative Western blots for the identification of reactive cysteines in MCU. n=3. (F) Lysates from HEK293T cells stably expressing MCU, MCUC97A or MCUC97M treated with menadione. (G) Cartoon illustrating the identification of MCU S-glutathionylation. (H) HEK293T cells stably expressing MCU or MCUC97A were exposed to menadione and lysates were subjected to Western blotting for the identification of S-glutathionylation (Right). Flag-tagged MCU was probed for control expression (left). (I and J) A comparison of 1H-15N-HSQC spectra of the oxidized NTD-MCU protein before (magenta crosspeaks) and after (blue crosspeaks) 10 mM DTT addition shows numerous amide 1H(15N) chemical shift perturbations (green circles) indicative of a conformational change. The inset shows a Coomassie-stained SDS-PAGE gel of the NTD-MCU protein with and without the addition of DTT. (K) Structure of the human NTD-MCU and relative location of the Cys-97 residue. The Cys-97 residue is located on the β3 strand and forms backbone hydrogen bonds (yellow dashed lines) with Val88 of the β2 strand to stabilize the β-grasp-like fold.
Figure 4
Figure 4. Oxidation of MCU or MCU Cys-97 Mutagenesis Promotes Higher Order MCU Complex Assembly
(A and C) Lysates from HEK293T cells stably expressing MCUWT (top), MCUC97A (Middle), and MCUC97M (bottom) with (C) and without menadione (A) were subjected to FPLC analysis. FPLC fractions were subjected to Western blotting and probed with FLAG antibody (n=3). (B and D) Quantification of elution profiles of MCUWT, MCUC97A, and MCUC97M with and without menadione treatment from A and C expressed as normalized intensities.
Figure 5
Figure 5. Disruption of Cys-97 Enables MCU Complex Redistribution at The Inner Mitochondrial Membrane
(A–C) Confocal micrographs of HeLa cells co-transfected with matrix localized GCaMP2-mt (green) and, either MCU WT-mRFP (A), MCUC97A-mRFP (B), or MCUCF-mRFP (C) (red). The blue oval in A–C marks the merged images of the respective magnified cells. (n = 3–5). (D and E) HeLa cells were co-transfected with the mitochondrial matrix marker COX8-mRFP (red) and either MCU WT-GFP (D) or MCUC97A-GFP (E) (green). Samples were imaged using SR-SIM. The blue box in D and E marks the magnified area (right panels). (n = 4) (F and G) Co-localization scatter plots (F) of MCU WT and MCUC97A (green) show partial co-localization with COX8 (red). Pearson, Manders, and overlap coefficients between MCU WT and COX8-RFP or MCUC97A and COX8-RFP. (H) MCU and MCUC97A were tagged with a photo-switchable protein, mEOS3.2. HeLa cells were transfected with either construct, fixed, and imaged using PALM. The blue box marks the magnified area (right panels). (I) Nanoclustering of MCU WT-mEOS3.2, MCUC97A-mEOS3.2, and MCU WT-mEOS3.2 treated with menadione was conducted as previously described (Baumgart et al., 2016). The normalized density of (ρ/ρ0) molecules was plotted against the relative area covered by the clusters (η). The red line fitted to the graph denotes 100% randomly distributed molecules, while true clustering has a higher density (ρ/ρ0) of molecules along a higher percentage of the area covered by the clusters (η) (n = 4–9). For each condition, we randomly quantified 5–10 cells for cluster analysis. (J) Model depicting MCU clustering and matrix remodeling upon oxidative stress.
Figure 6
Figure 6. Mutation of MCU Cys-97 perturbs endothelial cell bioenergetics, function and cell death
(A) Representative images showing MitoSox Red fluorescence in HPMVECs. (B) Bar graph represents quantification of fluorescence. Data indicate Mean ± SEM; *** P <0.001; n=3–7. (C) Representative Western blot for the expression of MnSOD and PRDX3. (D) Measurement of OCR in HPMVECs. After basal OCR, oligomycin (A), FCCP (B), and rotenone + Antimycin A (C) were added as indicated. (E and F) Bar represents mean basal OCR and maximal OCR. Data indicate Mean ± SEM; ** P <0.01; n=4. (G) Bar represents cellular ATP levels in HPMVECs. Data indicate Mean ± SEM; ** P <0.01; n=4. (H) Bar represents cellular basal NADH levels. Data indicate Mean ± SEM; ** P <0.01; n=3. (I) Quantification of endothelial cell migration. Data indicate Mean ± SEM; ** P <0.01; n=3–7. (J) Representative blot for the expression of ICAM-1 in HPMVECs. (K) Quantification of ICAM-1 expression. Data indicate Mean ± SEM; ** P <0.01; n=3. (L–N) Quantification of relative mRNA abundance of IL-1β (L), IL-6 (M), and TNF-α (N) in HPMVECs with or without LPS stimulation. Data indicate Mean ± SEM; *** P <0.001; n=3. (O) Quantification of PI-positive cells by FACS analysis. Data represents Mean ± SEM; *P < 0.05, **P < 0.01, ***P < 0.001; (n = 3).

Similar articles

Cited by

References

    1. Adachi T, Weisbrod RM, Pimentel DR, Ying J, Sharov VS, Schoneich C, Cohen RA. S-Glutathiolation by peroxynitrite activates SERCA during arterial relaxation by nitric oxide. Nat Med. 2004;10:1200–1207. - PubMed
    1. Antony AN, Paillard M, Moffat C, Juskeviciute E, Correnti J, Bolon B, Rubin E, Csordas G, Seifert EL, Hoek JB, et al. MICU1 regulation of mitochondrial Ca(2+) uptake dictates survival and tissue regeneration. Nature communications. 2016;7:10955. - PMC - PubMed
    1. Baughman JM, Perocchi F, Girgis HS, Plovanich M, Belcher-Timme CA, Sancak Y, Bao XR, Strittmatter L, Goldberger O, Bogorad RL, et al. Integrative genomics identifies MCU as an essential component of the mitochondrial calcium uniporter. Nature. 2011;476:341–345. - PMC - PubMed
    1. Baumgart F, Arnold AM, Leskovar K, Staszek K, Folser M, Weghuber J, Stockinger H, Schutz GJ. Varying label density allows artifact-free analysis of membrane-protein nanoclusters. Nat Methods. 2016;13:661–664. - PMC - PubMed
    1. Berridge MJ, Bootman MD, Roderick HL. Calcium signalling: dynamics, homeostasis and remodelling. Nat Rev Mol Cell Biol. 2003;4:517–529. - PubMed

MeSH terms