. 2017 Mar 16;65(6):985-998.e6.
doi: 10.1016/j.molcel.2017.01.033. Epub 2017 Mar 2.

Autonomous Generation and Loading of DNA Guides by Bacterial Argonaute

Affiliations

Autonomous Generation and Loading of DNA Guides by Bacterial Argonaute

Daan C Swarts et al. Mol Cell. .

Abstract

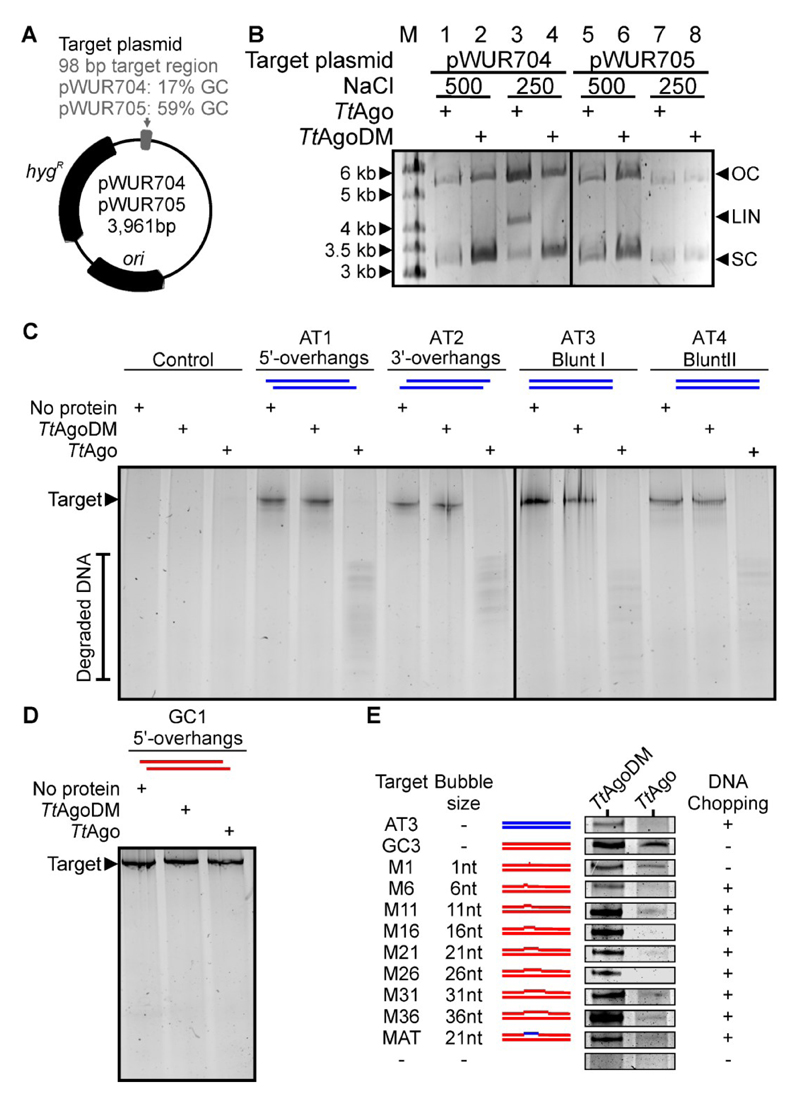
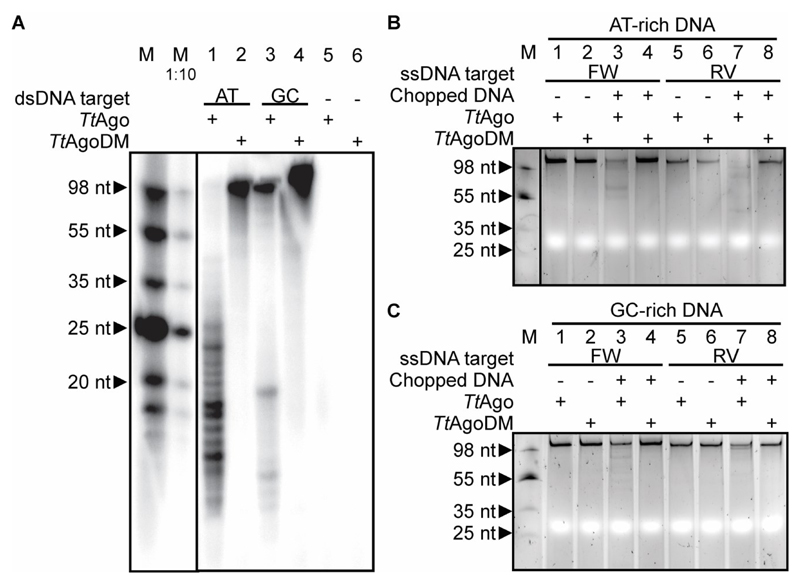
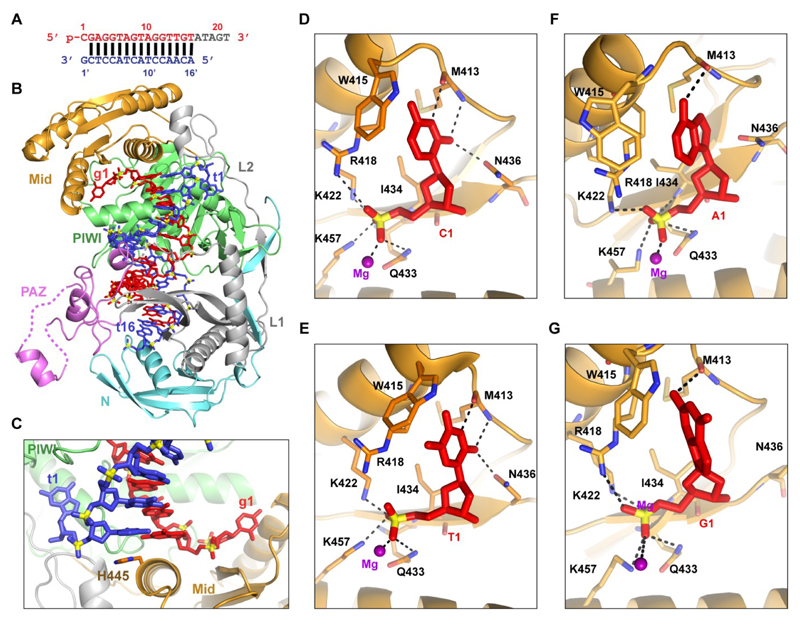
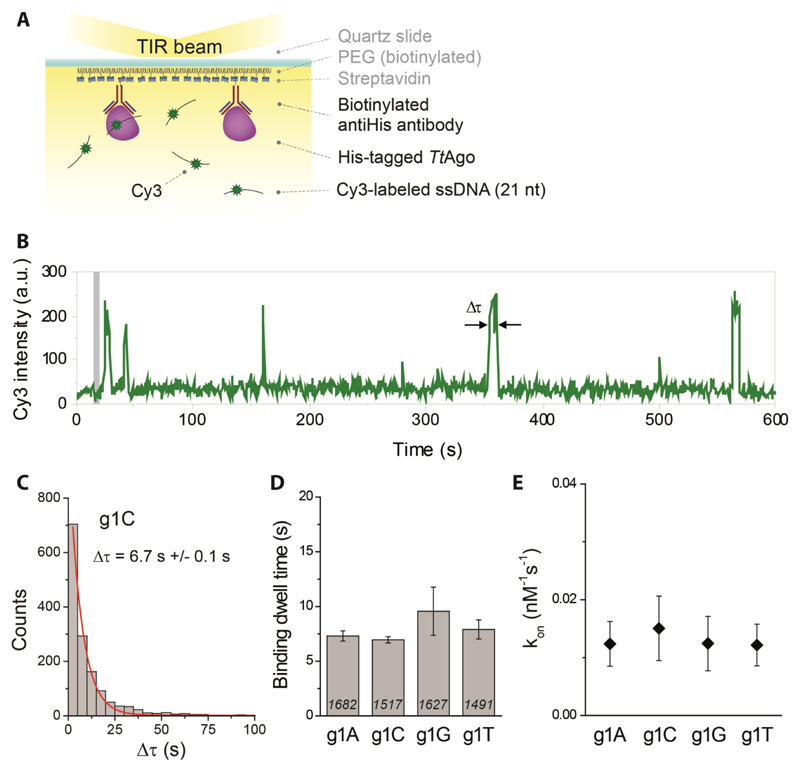
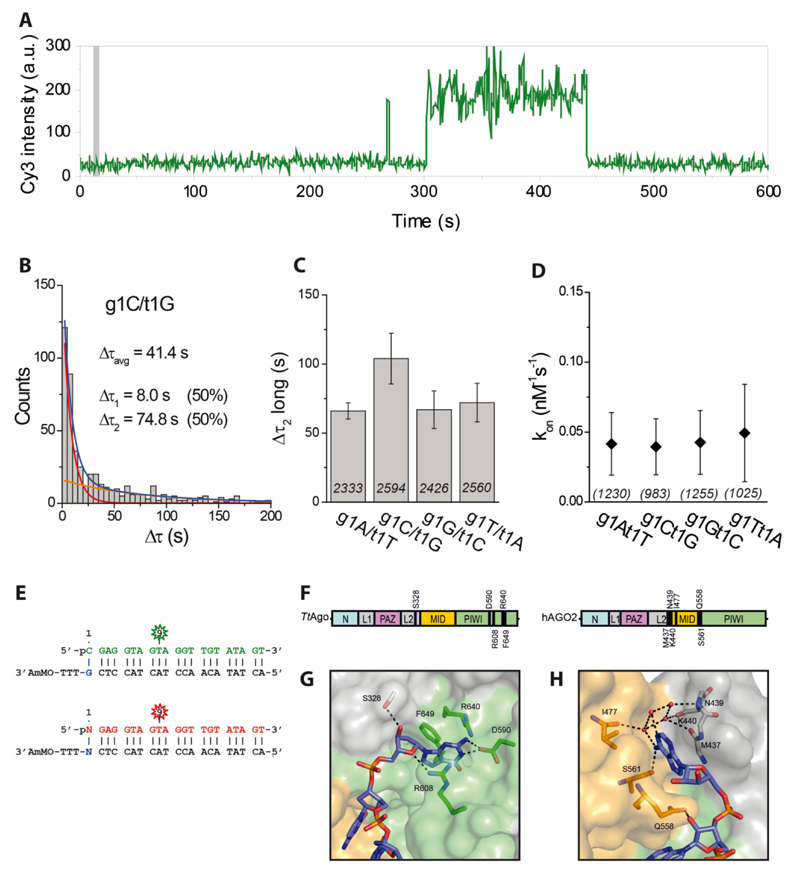
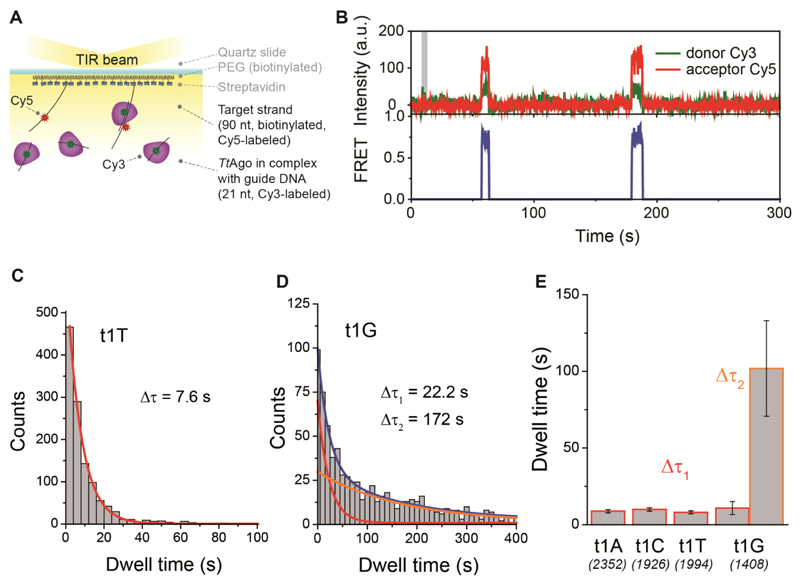
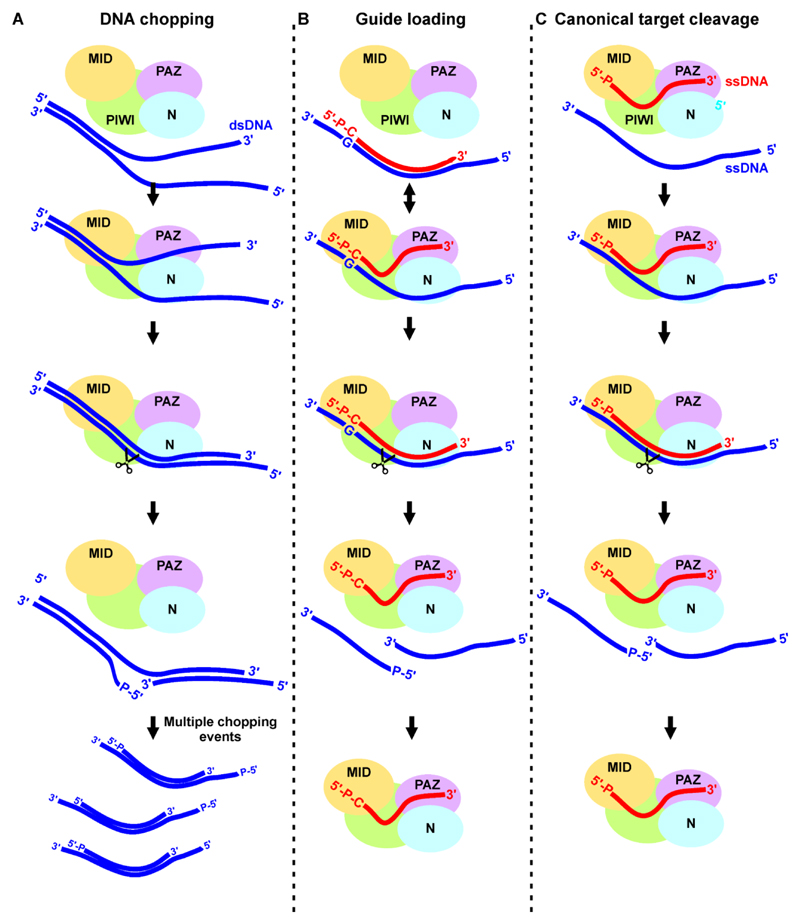
Several prokaryotic Argonaute proteins (pAgos) utilize small DNA guides to mediate host defense by targeting invading DNA complementary to the DNA guide. It is unknown how these DNA guides are being generated and loaded onto pAgo. Here, we demonstrate that guide-free Argonaute from Thermus thermophilus (TtAgo) can degrade double-stranded DNA (dsDNA), thereby generating small dsDNA fragments that subsequently are loaded onto TtAgo. Combining single-molecule fluorescence, molecular dynamic simulations, and structural studies, we show that TtAgo loads dsDNA molecules with a preference toward a deoxyguanosine on the passenger strand at the position opposite to the 5' end of the guide strand. This explains why in vivo TtAgo is preferentially loaded with guides with a 5' end deoxycytidine. Our data demonstrate that TtAgo can independently generate and selectively load functional DNA guides.

Keywords: DNA chopping; RNA interference; TtAgo; ago; guide generation; guide loading; pAgo; prokaryotic argonaute; siDNA; small interfering DNA.


Figures

Figure 1
Figure 1. Guide-free TtAgo can cleave unstable DNA
(A) Schematic representation of target plasmids pWUR704 and pWUR705. ori: Origin of replication. hygR: Hygromycin resistance marker. (B) Plasmids pWUR704 and pWUR705 incubated with apo-TtAgo in buffer containing 500 mM or 250 mM NaCl resolved on 0.8% agarose gels. M: GeneRuler 1 kb DNA Ladder (Thermo Scientific). OC: Open circular. LIN: Linear. SC: Supercoiled. (C-E) 98 bp AT-rich dsDNAs (C), a 98 bp GC-rich dsDNA (D) or 98 bp GC-rich dsDNAs with internal mismatches (E), incubated with TtAgo or TtAgoDM and resolved on 20% denaturing polyacrylamide gel. AT-rich and GC-rich DNA is colored blue and red, respectively. ‘Control’ samples include no target DNA, ‘No protein’ samples contain no protein. For a detailed overview of the dsDNA targets, see Table S1. For the uncropped gels of (E) and additional chopping experiments, see Figure S1E.
Figure 2
Figure 2. DNA chopping generates functional siDNA guides
(A) AT-rich dsDNA target ‘AT3’ or GC-rich dsDNA target ‘GC3’ (Table S1) were incubated with TtAgo or TtAgoDM, after which the purified and [γ-32P] ATP labeled nucleic acids were resolved on a 20% denaturing polyacrylamide gel. M: ssDNA marker. M 1:10: 10 times diluted ssDNA marker. (B) TtAgo incubated with chopped AT-rich dsDNA (as in panel a, lane 1) and ssDNA targets. The ssDNA targets have the same sequence as the forward (FW, BG4262) or reverse (RV, BG4724) strand of the chopped dsDNA. (C) TtAgo incubated with chopped GC-rich dsDNA (as in panel a, lane 3) and ssDNA targets. The ssDNA targets have the same sequence as forward (FW, BG4264) or reverse (RV, BG4726) strand of the chopped dsDNA. M: ssDNA marker. For sequence analysis of the generated fragments, see Figure S2.
Figure 3
Figure 3. Ternary complex of TtAgo bound to a 21 nt siDNA with g1C and a 16 nt ssDNA target complementary to the guide strand
(A) Sequence of 5’-phosphorylated guide DNA (red, with disordered segment in gray) and complementary target DNA (blue). (B) 2.7 Å ternary complex of TtAgo bound to guide DNA and 16-mer target DNA (PDB 5GQ6). The guide DNA and target DNA are in a stick representation, with same colors as in (A). See also Table 1. (C) The 5’-end phosphorylated guide DNA deoxycytidine (g1C) and the opposing nucleotide on the target DNA strand (t1G) are splayed out relative to the g2G-t2C base pair and are positioned in separate binding pockets in the MID and PIWI domains, respectively. (D and E) TtAgo MID domain residues interacting with the guide 5’-end phosphate and deoxycytosine (g1C, (D), PDB 5GQ6) and thymidine (g1T, (E), PDB 4NCB) residues of the guide strand (red). (F and G) Modeled structures of TtAgo MID domain residues interacting with the guide 5’-end phosphate and deoxyadenine (g1A, (F)) and deoxyguanine (g1G, (G)). The model is based on molecular dynamics simulations of the crystal structure of TtAgo with 21 nt g1C guide strand and 16 nt target strand (PDB 5GQ6). See also Figure S3.
Figure 4
Figure 4. TtAgo does not specifically interact with a g1C
(A) (left panel) TtAgo immobilization scheme. (right panel) Sequence of the guide DNA. The Cy3 fluorophore is positioned on the 9th nt of the guide DNA, counting from the guide DNA 5'-end. (B) Representative Cy3 fluorescence trace showing multiple short binding events. Binding dwell time, Δτ, is indicated with the arrows and time point at which ssDNA is introduced into the chamber is indicated with a grey bar. (C) Dwell time distribution of g1C binding events was fitted with a single-exponential function (red line); Δτ - mean dwell time. (D) Comparison of binding dwell times for all four ssDNA constructs differing only with the first nucleotide on the 5’-end. Numbers in each column represent the number of analyzed TtAgo molecules, while error bars represent SEM, n=3. (E) Corresponding binding rate (kon) of all four ssDNAs. Error bars represent SEM, n=3.
Figure 5
Figure 5. TtAgo interactions with dsDNA show a preference for a deoxyguanosine on the target strand
(A) Representative fluorescence trace showing short and long binding events. Time point at which dsDNA is introduced into the chamber is indicated with a grey bar. (B) Dwell time distribution of g1C/t1G binding events with a double-exponential fit (blue line) with short- and long-bound populations indicated as red and orange lines, respectively. The average dwell time (Δτavg) was obtained from short (Δτ1) and long (Δτ2) binding dwell times and their corresponding amplitudes. See also Figure S4A. (C) Comparison of longer binding dwell times (Δτ2) for four fully complementary dsDNA constructs. Numbers in each column represent the number of analyzed TtAgo molecules, while error bars represent SEM, n=6. (D) Binding rate (kon) of all four fully complementary dsDNAs. Numbers in parentheses represent the number of analyzed TtAgo molecules, while error bars represent SEM, n=3. (E) Sequences of guide DNA and target DNA. The fluorophore (Cy3 or Cy5) is positioned on the 9th nt of guide DNA, counting from guide DNA 5'-end. Vertical lines denote contiguous base pairs between the guide and target strands. Cy3-labeled g1C/t1G was used in the competition assay as a reference for all four fully complementary dsDNA constructs labeled with Cy5 (see also Figure S4D). Control experiments for the single-molecule experiments displayed in this figure are given in Figures S5 and S6. (F) Schematic representation of TtAgo and hAGO2 proteins. Residues involved in direct or water-mediated (*) t1N interactions are indicated in the figure. (G) Crystal structure of TtAgo with bound 21 nt DNA guide and 16 nt DNA target (PDB 5GQ6). TtAgo residues specifically interact with t1G. Domains colored as in (E); DNA target is colored blue. See also Figure S6. (H) Crystal structure of hAGO2 with bound 21 nt RNA guide and 9 nt RNA target (PDB 4W5O). hAGO2 residues specifically interact with t1A. Domains are colored as in (E); RNA target is colored blue.
Figure 6
Figure 6. TtAgo-guide complex preferentially binds to a target strand with a t1G
(A) (top panel) Immobilization scheme. (bottom panel) Sequences of guide and target DNA strands. Donor fluorophore (Cy3) is positioned on the 9th nt of the g1C guide DNA, counting from the guide DNA 5'-end. The acceptor (Cy5) is positioned on the t1N target DNA opposite nt 17 of the guide DNA. Vertical lines denote contiguous base pairs between the guide and target strands, while dots represent nonconsecutive pairs. For immobilization, the 3'-end of the target strand is annealed to a biotinylated DNA anchor. (B) Representative time trajectory showing binding events: (top panel) Cy3 and Cy5 fluorescence intensities (time point at which TtAgo-siDNA complex is introduced into the chamber is indicated with a grey bar); (bottom panel) FRET calculated from Cy3 and Cy5 intensities. FRET was set to zero value outside of the binding events. (C) Dwell time distribution of TtAgo-guide binding to the target strand with t1T was fitted with a single-exponential function (red line). (D) Dwell time distribution of TtAgo-guide binding to the target strand with t1G was fitted with a double-exponential function (blue line) with short- and long-binding populations indicated as red and orange lines, respectively. Characteristic short (Δτ1) and long (Δτ2) binding times are indicated. (E) Comparison of binding dwell times for four target DNA constructs. Numbers in parentheses represent the number of analyzed immobilized target DNA molecules, while error bars represent SEM, n=4. Control experiments for the single-molecule experiments displayed in this figure are given in Figures S5and S6. (F) Efficiency of t1G and t1T cleavage in competition assays, relative to cleavage efficiency of the same targets in single-target assays. Cleavage efficiency was determined after incubation of the targets with TtAgo-siDNA (g1T) complexes at 65 ºC for 16 h. Gel images from which efficiencies were calculated are displayed in Figure S7.
Figure 7
Figure 7. Models for DNA chopping, guide loading, and target cleavage by TtAgo
(A) Proposed model for DNA chopping. TtAgo binds the stable part of partially unwound dsDNA with at least its PIWI domain. Duplex re-hybridization of the DNA associated with conformational changes results in chopping of the target strand. Multiple chopping events will generate small duplex DNAs. (B) Proposed model for DNA guide loading. Duplex DNA substrates are bound by TtAgo: The 5’-end phosphorylated g1N is bound by the MID domain, while the t1N is bound in the t1N binding pocket. Duplex DNAs with a t1G have longer dwell times than other duplex DNAs. The passenger strand is released either by N domain-mediated duplex destabilization or after target cleavage, while the guide strand (siDNA) remains bound. (C) Canonical target cleavage by TtAgo. The 5’-phosphorylated end and the 3’ end of the guide strand are bound by TtAgo MID and PAZ domains respectively. Target binding initiates at the seed segment of the guide, after which zippering in the direction of the 3’ end of the guide takes place. The 3’ end of the guide is released from the PAZ domain and accompanying conformational changes lead to correct positioning of the catalytic residues and eventually target cleavage.

Similar articles

Cited by

References

    1. Adams PD, Grosse-Kunstleve RW, Hung LW, Ioerger TR, McCoy AJ, Moriarty NW, Read RJ, Sacchettini JC, Sauter NK, Terwilliger TC. PHENIX: building new software for automated crystallographic structure determination. Acta Crystallogr D. 2002;58:1948–1954. - PubMed
    1. Batista PJ, Ruby JG, Claycomb JM, Chiang R, Fahlgren N, Kasschau KD, Chaves DA, Gu W, Vasale JJ, Duan S, et al. PRG-1 and 21U-RNAs interact to form the piRNA complex required for fertility in C. elegans. Mol Cell. 2008;31:67–78. - PMC - PubMed
    1. Best RB, Zhu X, Shim J, Lopes PE, Mittal J, Feig M, Mackerell AD., Jr Optimization of the additive CHARMM all-atom protein force field targeting improved sampling of the backbone phi, psi and side-chain chi(1) and chi(2) dihedral angles. Journal of chemical theory and computation. 2012;8:3257–3273. - PMC - PubMed
    1. Blesa A, Cesar CE, Averhoff B, Berenguer J. Noncanonical cell-to-cell DNA transfer in Thermus spp. is insensitive to argonaute-mediated interference. J Bacteriol. 2015;197:138–146. - PMC - PubMed
    1. Cerritelli SM, Crouch RJ. Ribonuclease H: the enzymes in eukaryotes. FEBS J. 2009;276:1494–1505. - PMC - PubMed

MeSH terms