

Long-term effects of bisphosphonate therapy: perforations, microcracks and mechanical properties
- PMID: 28262693
- PMCID: PMC5338252
- DOI: 10.1038/srep43399
Long-term effects of bisphosphonate therapy: perforations, microcracks and mechanical properties
Abstract
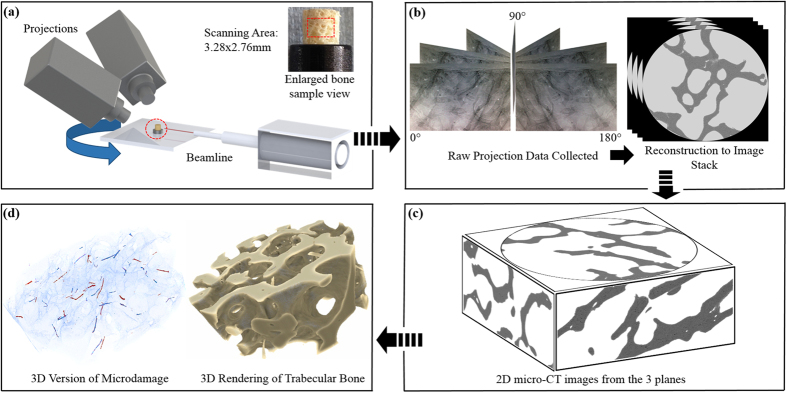
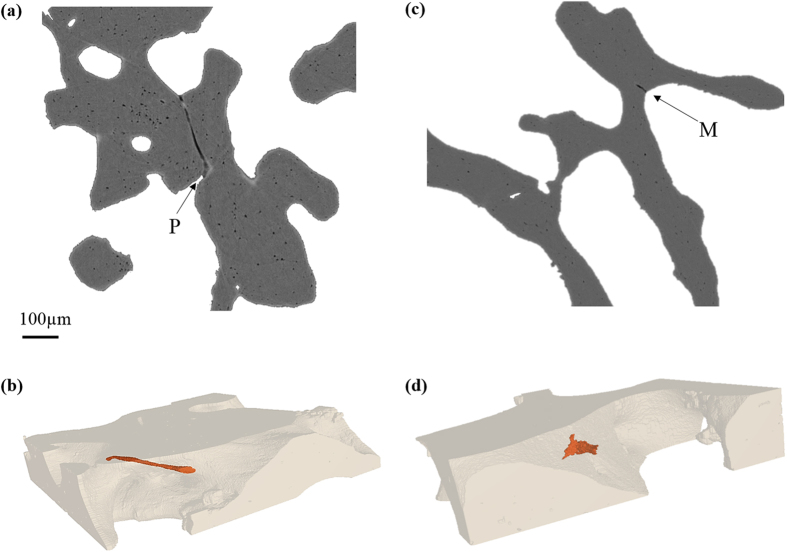
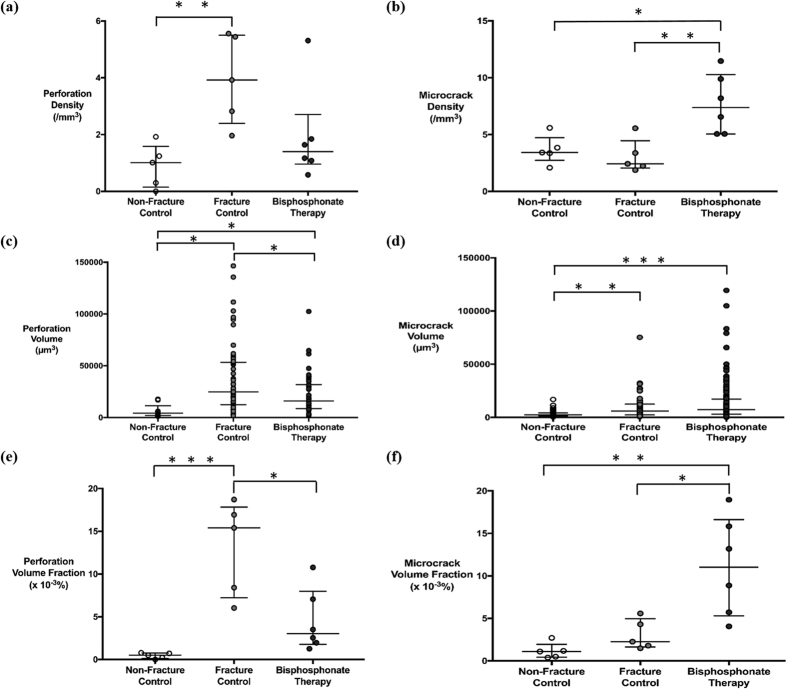
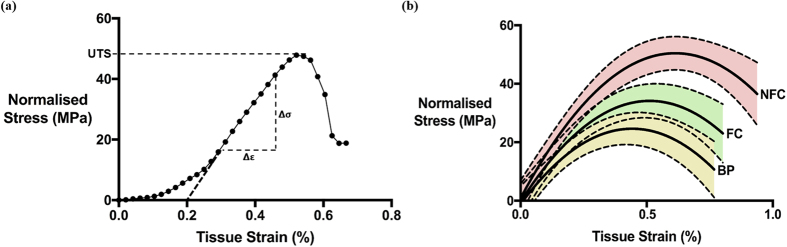
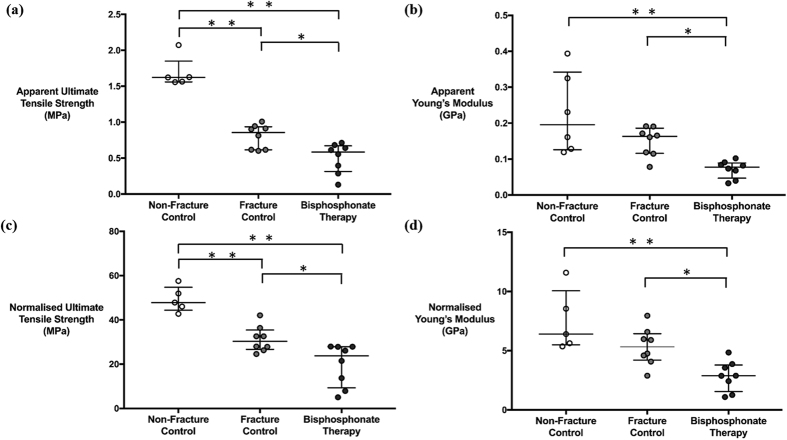
Osteoporosis is characterised by trabecular bone loss resulting from increased osteoclast activation and unbalanced coupling between resorption and formation, which induces a thinning of trabeculae and trabecular perforations. Bisphosphonates are the frontline therapy for osteoporosis, which act by reducing bone remodelling, and are thought to prevent perforations and maintain microstructure. However, bisphosphonates may oversuppress remodelling resulting in accumulation of microcracks. This paper aims to investigate the effect of bisphosphonate treatment on microstructure and mechanical strength. Assessment of microdamage within the trabecular bone core was performed using synchrotron X-ray micro-CT linked to image analysis software. Bone from bisphosphonate-treated fracture patients exhibited fewer perforations but more numerous and larger microcracks than both fracture and non-fracture controls. Furthermore, bisphosphonate-treated bone demonstrated reduced tensile strength and Young's Modulus. These findings suggest that bisphosphonate therapy is effective at reducing perforations but may also cause microcrack accumulation, leading to a loss of microstructural integrity and consequently, reduced mechanical strength.
Conflict of interest statement
The authors declare no competing financial interests.
Figures
Similar articles
-
Effects of osteoporosis medications on bone quality.Joint Bone Spine. 2007 Jan;74(1):39-47. doi: 10.1016/j.jbspin.2006.06.004. Epub 2006 Nov 28. Joint Bone Spine. 2007. PMID: 17196423 Review.
-
Alendronate treatment alters bone tissues at multiple structural levels in healthy canine cortical bone.Bone. 2015 Dec;81:352-363. doi: 10.1016/j.bone.2015.08.002. Epub 2015 Aug 5. Bone. 2015. PMID: 26253333
-
The effect of long-term bisphosphonate therapy on trabecular bone strength and microcrack density.Bone Joint Res. 2017 Oct;6(10):602-609. doi: 10.1302/2046-3758.610.BJR-2016-0321.R1. Bone Joint Res. 2017. PMID: 29066534 Free PMC article.
-
Trabecular bone microcrack accumulation in patients treated with bisphosphonates for durations up to 16 years.J Orthop Res. 2023 May;41(5):1033-1039. doi: 10.1002/jor.25441. Epub 2022 Sep 26. J Orthop Res. 2023. PMID: 36163612 Free PMC article.
-
[Effects of antiresorptive therapy on the structural and material properties of bone strength].Clin Calcium. 2016 Jan;26(1):107-15. Clin Calcium. 2016. PMID: 26728537 Review. Japanese.
Cited by
-
Serum homocysteine levels are affected by renal function during a 3-year period of minodronate therapy in female osteoporotic patients.J Bone Miner Metab. 2019 Mar;37(2):319-326. doi: 10.1007/s00774-018-0920-5. Epub 2018 Mar 30. J Bone Miner Metab. 2019. PMID: 29603071
-
Managing Early Onset Osteoporosis: The Impact of Premature Ovarian Insufficiency on Bone Health.J Clin Med. 2023 Jun 14;12(12):4042. doi: 10.3390/jcm12124042. J Clin Med. 2023. PMID: 37373735 Free PMC article. Review.
-
Recent Advances in Understanding Bisphosphonate Effects on Bone Mechanical Properties.Curr Osteoporos Rep. 2018 Apr;16(2):198-204. doi: 10.1007/s11914-018-0430-3. Curr Osteoporos Rep. 2018. PMID: 29497927 Free PMC article. Review.
-
Minodronate for the treatment of osteoporosis.Ther Clin Risk Manag. 2018 Apr 17;14:729-739. doi: 10.2147/TCRM.S149236. eCollection 2018. Ther Clin Risk Manag. 2018. PMID: 29713181 Free PMC article. Review.
-
Rethinking the Appraisal and Approval of Drugs for Fracture Prevention.Front Pharmacol. 2017 May 15;8:265. doi: 10.3389/fphar.2017.00265. eCollection 2017. Front Pharmacol. 2017. PMID: 28555109 Free PMC article.
References
-
- Kanis J. A. Assessment of osteoporosis at the primary health-care level. Technical Report (2007).
-
- Busse B. et al.. Vitamin D Deficiency Induces Early Signs of Aging in Human Bone, Increasing the Risk of Fracture. Science Translational Medicine 5, 193ra88–193ra88 (2013). - PubMed
-
- Zimmermann E. A. et al.. Modifications to Nano- and Microstructural Quality and the Effects on Mechanical Integrity in Paget’s Disease of Bone. Journal of Bone and Mineral Research 30, 264–273 (2015). - PubMed
Publication types
MeSH terms
Substances
Grants and funding
LinkOut - more resources
Full Text Sources
Other Literature Sources
Medical
