. 2017 Mar 6:7:43368.
doi: 10.1038/srep43368.

Data integration aids understanding of butterfly-host plant networks

Affiliations

Data integration aids understanding of butterfly-host plant networks

Ai Muto-Fujita et al. Sci Rep. .

Abstract

Although host-plant selection is a central topic in ecology, its general underpinnings are poorly understood. Here, we performed a case study focusing on the publicly available data on Japanese butterflies. A combined statistical analysis of plant-herbivore relationships and taxonomy revealed that some butterfly subfamilies in different families feed on the same plant families, and the occurrence of this phenomenon more than just by chance, thus indicating the independent acquisition of adaptive phenotypes to the same hosts. We consequently integrated plant-herbivore and plant-compound relationship data and conducted a statistical analysis to identify compounds unique to host plants of specific butterfly families. Some of the identified plant compounds are known to attract certain butterfly groups while repelling others. The additional incorporation of insect-compound relationship data revealed potential metabolic processes that are related to host plant selection. Our results demonstrate that data integration enables the computational detection of compounds putatively involved in particular interspecies interactions and that further data enrichment and integration of genomic and transcriptomic data facilitates the unveiling of the molecular mechanisms involved in host plant selection.


Conflict of interest statement

The authors declare no competing financial interests.

Figures

Figure 1
Figure 1. Overview of the strategy used in this study.
(a) Proposed word definitions to describe the range of host-plant preferences. (b) Plant–herbivore matrix. Rows and columns represent plants and herbivorous butterflies, respectively. A dot at an intersection indicates that the butterfly feeds on the corresponding plant. Butterfly taxonomy is indicated by the dendrogram. (c) Plant–compound matrix. Rows and columns represent plants and compounds, respectively. Dots are used to indicate that a plant possesses a compound. Plant taxonomy is indicated by the dendrogram. (d) Plant–herbivore network consisting of butterfly species with their host plant species as the nodes. (e) Plant–herbivore family network consisting of butterfly families with their host plant families as the nodes. (f) Compound effect on host plant selection. Arrows and dotted lines indicate that a plant compound attracts or repels herbivorous butterflies, respectively. (g) Plant–herbivore metabolism. Some compounds (such as C1) found in herbivorous butterflies are believed to be directly obtained from the host plant, whereas other compounds (such as C2′) are derived from plant compounds via enzymatic reactions or from other sources (such as C6). (h) Feed-on-family hypothesis.
Figure 2
Figure 2
(a) Distribution of butterfly families across the Japanese Islands and other global ecozones. (b) Distribution of host plants among butterfly families. Horizontal and vertical axes represent the number of host plant families per butterfly species and the number of butterfly species, respectively. (c) Plant–herbivore matrix of some Japanese butterfly species. Mono-family-phagous butterflies are Daimio tethys, Erynnis montanus, Pelopidas mathias, Polytremis pellucida, Thoressa varia, Isoteinon lamprospilus, Potanthus flavum, Parnara guttata, Parnassius citrinarius, Luehdorfia japonica, Byasa alcinous, Papilio macilentus, Papilio bianor, Papilio protenor, Papilio memnon Linnaeus, Papilio xuthus, Papilio maackii, Papilio helenus, Anthocharis scolymus, Pieris melete, Colias erate, Gonepteryx aspasia, Eurema laeta Boisduval, Curetis acuta paracuta, Everes argiades, Lycaena phlaeas, Japonica lutea, Iratsume orsedice orsedice, Artopoetes pryeri, Antigius attilia, Narathura japonica, Libythea celtis, Dichorragia nesimachus, Argyronome laodice, Argyronome ruslana, Fabriciana adippe, Nephargynnis anadyomene, Argyreus hyperbius, Argynnis paphia, Damora sagana, Vanessa cardui, Araschnia burejana, Limenitis glorifica, Limenitis camilla, Neptis pryeri, Hestina persimilis japonica, Sasakia charonda, Apatura metis, Ypthima argus, Mycalesis gotama, Minois dryas, Neope goschkevitschii, Lethe sicelis, Zophoessa callipteris, Lethe diana, Parantica sita. Oligo-family-phagous butterflies are Choaspes benjaminii, Graphium sarpedon, Pieris rapae, Eurema hecabe, Lampides boeticus, Pseudozizeeria maha, Neozephyrus japonicus, Vanessa indica, Polygonia c-aureum, Kaniska canace, Mycalesis francisca, Melanitis phedima. Poly-family-phagous butterflies are Papilio machaon, Celastrina argiolus, Callophrys ferrea, Rapala arata, Nymphalis xanthomelas, Neptis sappho. Taraka hamada is not herbivore but carnivore.
Figure 3
Figure 3. Plant–herbivore network of all Japanese butterfly species.
Circles and rectangles represent butterfly and plant species, respectively, with the edges between them representing their relationship. Nodes (circles and rectangles) are coloured to indicate families of butterflies and plants, respectively. Node sizes are proportional to degree (i.e., number of edges per node).
Figure 4
Figure 4
(a) Family-level plant–herbivore network. Circles and rectangles represent butterfly and plant families, respectively, with the edges between them representing their relationships. Node sizes are proportional to degree (i.e., number of edges per node). Edge widths represent the Z-scores. Node colours (circles and triangles) indicate that the butterfly and plant families are the same as in Fig. 3. (b) Plant–herbivore matrix of plant families and butterfly subfamilies. Closed and open circles indicate plant–herbivore relationships with positive and negative interaction frequency Z-scores, respectively. Areas of circles are proportional to Z-score absolute values.
Figure 5
Figure 5
(a) Relationships among Z-scores of average plant family-based evenness for butterfly families and Z-scores of the average number of common specific compounds in host plants. Circles represent butterfly families. Circle areas are proportional to degrees (i.e., numbers of host-plant species) of butterfly families. (b) The same plot for butterfly subfamilies. Circles represent butterfly subfamilies, with their colours corresponding to those given for butterfly families in (a). (c) Relationship between the compound contributions of plant species and degree (i.e., number of butterflies consuming the respective plant species). Circles represent plant species. Circle areas are proportional to the number of common specific compounds registered in the KNApSAcK database. Plant species in the Poaceae, Fabaceae, Brassicaceae and Rutaceae families are indicated by light green, dark green, yellow, and orange, respectively. (d) Relationship between the compound contributions (χi) of different plant families and average neighbour degree (i.e., average number of host-plant families used by herbivorous butterflies on the respective plant species). Circle areas are proportional to the average number of common specific compounds. Colours are the same as in (c).
Figure 6
Figure 6. Compounds specific to host plants of a given butterfly family.
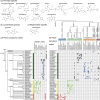
(ac) Compounds specific to host plants of Pieridae (a) Lycaenidae (b) and Papilionidae (c) families. (d) Matrix representation of plant species possessing the compounds shown in (a), (b) and (c). Among Pieridae-specific plant compounds, glucosinolates are represented by green dots; all others are represented by black dots. Lycaenidae-specific and Papilionidae-specific compounds are indicated by blue and red dots, respectively. (e) Plant–herbivore matrix of the plant species in (d) and the butterfly species that consume them.
Figure 7
Figure 7. Known and deduced plant–herbivore metabolism of glucosinolates.
Numbers below arrows indicate predictive values generated by E-zyme and E-zyme2 webservers. (a) Arabidopsis thaliana (plant family Brassicaceae) produces glucosinalbate. When plants are consumed by herbivores, the plant enzyme myrosinase acts on this compound to produce a toxic isothiocyanate compound. (b) Pieris rapae, a Pierinae butterfly, can prevent the production of the toxic isothiocyanate compound and instead produces a nitrile compound by altering the myrosinase activity with the help of nitrile-specifier protein (NSP). (c) Arabidopsis thaliana plants can also produce nitrile compounds from glucosinolates. (df) Putative chemical transformations of plant compounds (from KNApSAcK and Pherobase) to insect compounds (from Pherobase) identified by chemical structural comparison. The predicted transformations included a deduced reaction producing a compound possessed by a butterfly species (e).

Similar articles

Cited by

References

    1. Jensen N. B. et al.. Convergent evolution in biosynthesis of cyanogenic defence compounds in plants and insects. Nat. Commun. 2, 273 (2011). - PMC - PubMed
    1. Gatehouse J. A. Plant resistance towards insect herbivores: a dynamic interaction. New Phytol. 156, 145–169 (2002). - PubMed
    1. Konno K. Plant latex and other exudates as plant defense systems: roles of various defense chemicals and proteins contained therein. Phytochemistry. 72 (13), 1510–1530 (2011). - PubMed
    1. Fürstenberg-Hägg J., Zagrobelny M. & Bak S. Plant Defense against Insect Herbivores. Int. J. Mol. Sci. 14, 10242–10297 (2013). - PMC - PubMed
    1. Barabási A.-L. Network science. Philos. Trans. R. Soc. A. 371, 20120375 (2013). - PubMed

Publication types

LinkOut - more resources