. 2017 Jul;114(7):1495-1510.
doi: 10.1002/bit.26280. Epub 2017 Apr 18.

miRNA engineering of CHO cells facilitates production of difficult-to-express proteins and increases success in cell line development

Affiliations

miRNA engineering of CHO cells facilitates production of difficult-to-express proteins and increases success in cell line development

Simon Fischer et al. Biotechnol Bioeng. 2017 Jul.

Abstract

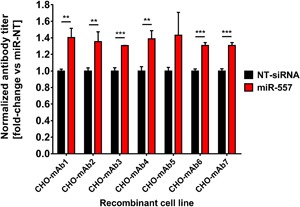
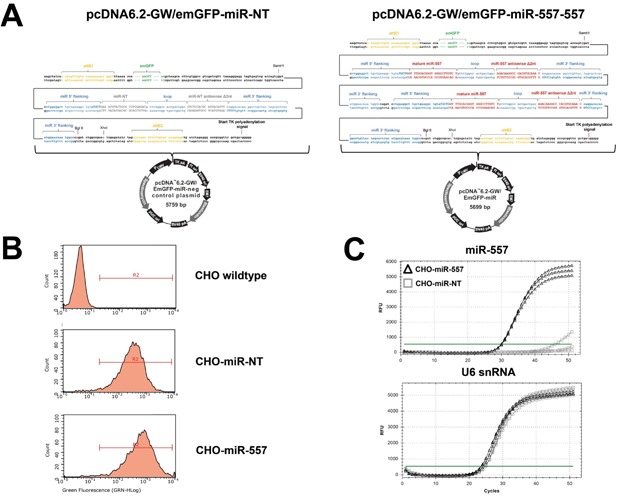
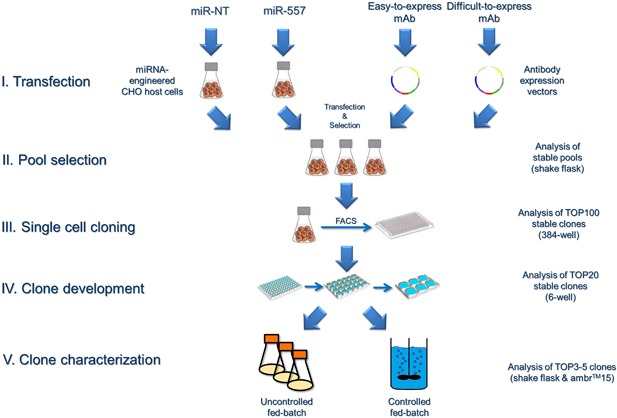
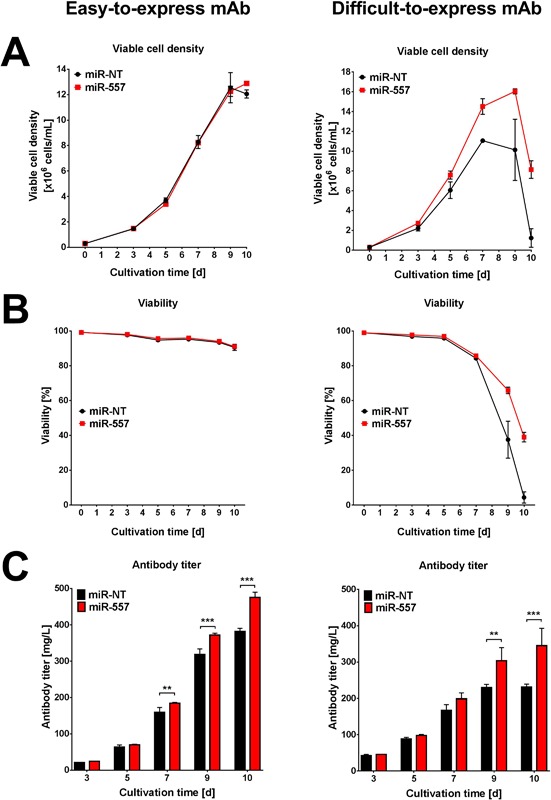
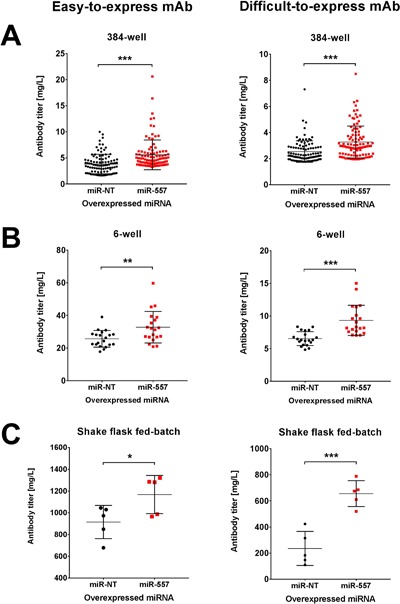
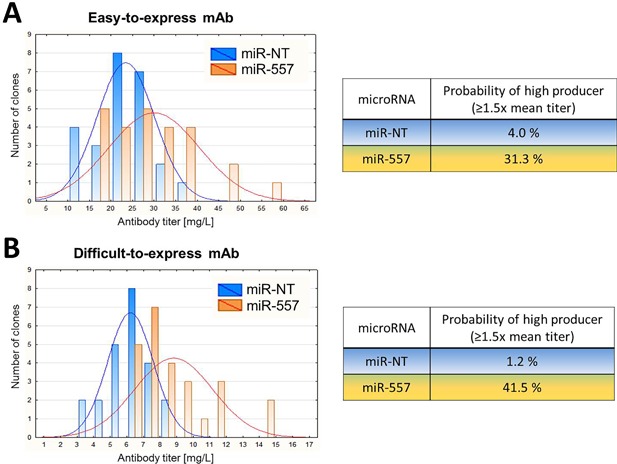
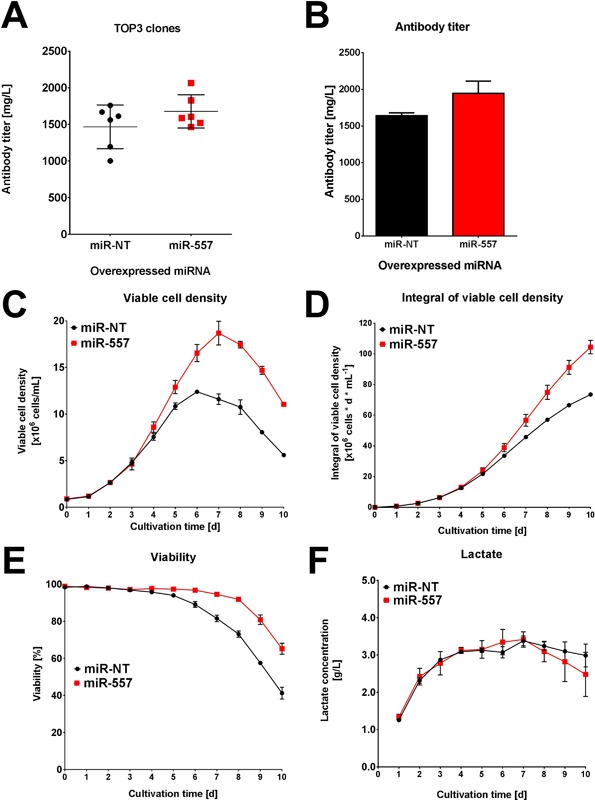
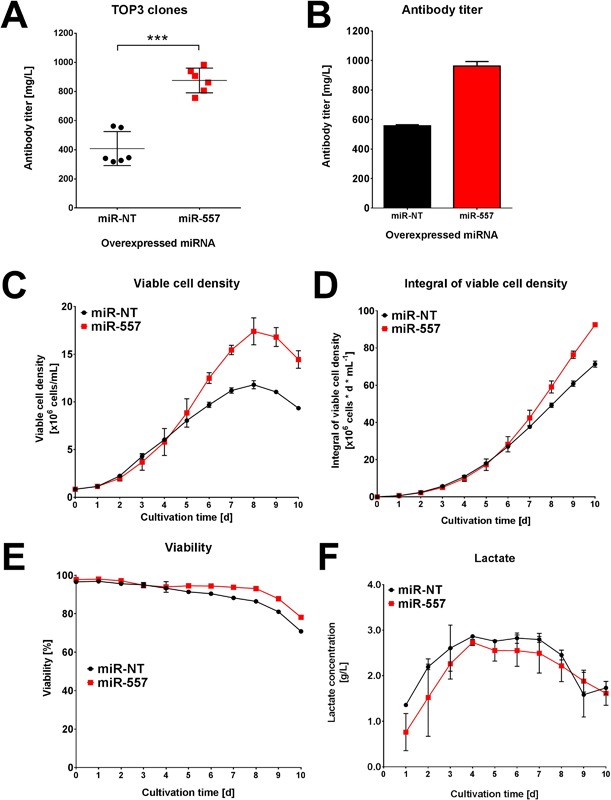
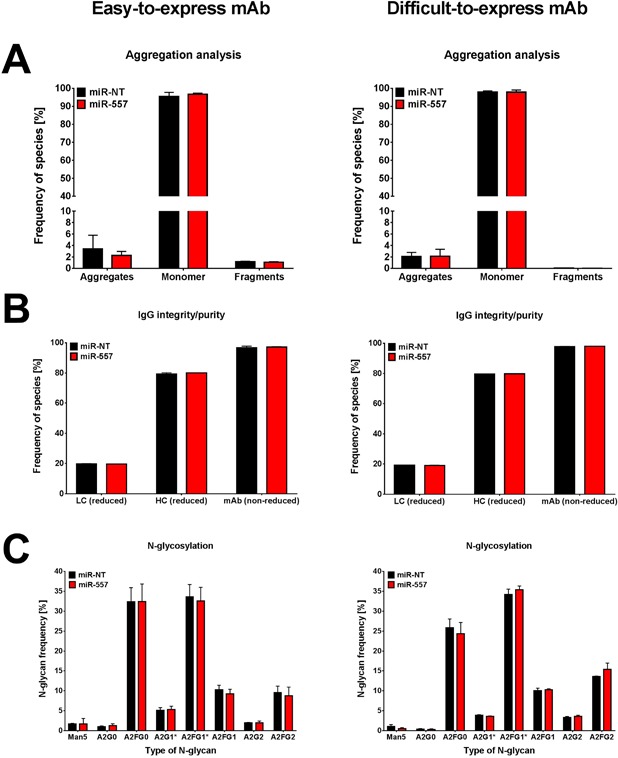
In recent years, coherent with growing biologics portfolios also the number of complex and thus difficult-to-express (DTE) therapeutic proteins has increased considerably. DTE proteins challenge bioprocess development and can include various therapeutic protein formats such as monoclonal antibodies (mAbs), multi-specific affinity scaffolds (e.g., bispecific antibodies), cytokines, or fusion proteins. Hence, the availability of robust and versatile Chinese hamster ovary (CHO) host cell factories is fundamental for high-yielding bioprocesses. MicroRNAs (miRNAs) have emerged as potent cell engineering tools to improve process performance of CHO manufacturing cell lines. However, there has not been any report demonstrating the impact of beneficial miRNAs on industrial cell line development (CLD) yet. To address this question, we established novel CHO host cells constitutively expressing a pro-productive miRNA: miR-557. Novel host cells were tested in two independent CLD campaigns using two different mAb candidates including a normal as well as a DTE antibody. Presence of miR-557 significantly enhanced each process step during CLD in a product independent manner. Stable expression of miR-557 increased the probability to identify high-producing cell clones. Furthermore, production cell lines derived from miR-557 expressing host cells exhibited significantly increased final product yields in fed-batch cultivation processes without compromising product quality. Strikingly, cells co-expressing miR-557 and a DTE antibody achieved a twofold increase in product titer compared to clones co-expressing a negative control miRNA. Thus, host cell engineering using miRNAs represents a promising tool to overcome limitations in industrial CLD especially with regard to DTE proteins. Biotechnol. Bioeng. 2017;114: 1495-1510. © 2017 Wiley Periodicals, Inc.

Keywords: Chinese hamster ovary (CHO) cells; cell engineering; difficult-to-express proteins; miR-557; microRNA; monoclonal antibody.


Figures

Figure 1
Figure 1
Transient transfection of miRNA mimics in seven different recombinant CHO production cell lines. Cells were transfected either with hsa‐miR‐557 mimics or non‐target siRNAs (NT‐siRNA) and cultured for 96 h in agitated 96‐well format. Product quantification was performed using Protein A coupled biosensors on an Octet® QK384. mAb productivity of miR‐557 transfected cells was normalized to NT‐siRNA transfected control cells. Data are presented as mean value and error bars represent the standard deviation (SD) of three independent transfections. Testing of statistical significance between control and miRNA transfected CHO production cell lines was performed by applying an unpaired two‐tailed t‐test (**P < 0.01; ***P < 0.001).
Figure 2
Figure 2
Generation of stable miRNA expressing CHO host cells. CHO host cells were stably transfected with miRNA expression plasmids followed by antibiotic selection in order to generate stable miRNA overexpressing cells. (A) Overview on the pcDNA6.2‐GW/emGFP‐miR expression vector system used for this study. For strong expression of mature miR‐557 a tandem expression construct comprising two pre‐miR‐557 expression cassettes was used. Respective miRNA sequences, flanking regions as well as restriction enzyme cleavage sites are indicated. (B) FACS analysis of emGFP expression of CHO host cells stably expressing pcDNA6.2‐GW/emGFP‐miR expression plasmids. Non‐transfected wildtype CHO host cells served as negative control. (C) Analysis of mature miRNA expression of stable engineered CHO host cells using qRT‐PCR. QRT‐PCR amplifications curves are shown for miR‐557 (black triangles) as well as miR‐NT expressing control cells (grey squares). Total RNA was isolated from exponentially growing host cells followed by reverse transcription. Expression of mature miR‐557 (upper graph) was normalized to the expression levels of U6 snoRNA (lower graph). Analysis was performed in technical triplicates which are indicated by separate amplification curves.
Figure 3
Figure 3
Overview on the cell line development process used in this study. Respective analyses performed during each step are indicated. Bioprocess performance of final production clones was examined both using uncontrolled (shake flask) and controlled (ambr®15) fed‐batch cultivation processes.
Figure 4
Figure 4
Analysis of fed‐batch performance of stable cell pools either producing an easy‐to‐express or difficult‐to‐express antibody candidate. (A) Viable cell density, (B) viability and (C) volumetric antibody titer of pools co‐expressing either miR‐557 (red) or miR‐NT (black) are shown for a 10‐day fed‐batch cultivation process in 250 mL shake flasks. The left panel represents results of an easy‐to‐express and the right panel for a difficult‐to‐express mAb. Data are presented as mean value and error bars represent the SD of three independent cultivations. For statistical analysis a two‐way ANOVA was applied comparing the mean values of the different miRNA overexpressing cell pools at each time point (**P < 0.01; ***P < 0.001).
Figure 5
Figure 5
Cell line development performance of miRNA engineered CHO host cells. (A) mAb productivity of TOP 100 stable clones in 384‐well plates at 14 days following single cell cloning (SSC). (B) mAb productivity of TOP 20 stable clones cultivated in 6‐well plates 6 weeks post SSC. (C) Final mAb titer of the best five stable clones at day 10 of uncontrolled fed‐batch cultivations (shake flasks). Stable production cell clones derived from miR‐557 expressing host cells (red) were compared to clones derived from negative control host cells (black). Product quantification was performed using Protein A coupled biosensors on an Octet® QK384. For statistical analysis an unpaired two‐tailed t‐test was applied (*P < 0.05; **P < 0.01; ***P < 0.001).
Figure 6
Figure 6
Calculated probability to identify a high‐producing cell clone. Determination of a theoretical probability to identify a high‐producing cell clone from cells expressing miR‐557 (orange) or control cells expressing a non‐targeting miRNA (blue). A high‐producing cell clone was defined to exhibit at least a 1.5‐fold increased volumetric mAb titer compared to the mean productivity of control cells. Histograms illustrate the distribution of volumetric antibody productivity for an (A) easy‐to‐express and (B) difficult‐to‐express antibody. Volumetric mAb productivity of cells present in the late phase of clone development (6‐well plate) was used for calculation and statistical analysis.
Figure 7
Figure 7
Fed‐batch performance of engineered CHO host cells expressing an easy‐to‐express mAb. The three TOP clones derived from either miR‐557 expressing (red) or negative control host cell lines (black) were cultivated for 10 days in fully controlled fed‐batch cultivation using an ambr™15 bioreactor system. Each clone was cultivated in two biological replicates. (A) Volumetric antibody productivity of the three TOP clones regarding an easy‐to‐express mAb. Each data point represents one bioreactor run. (B–F) Fed‐batch cultivation process data of the respective TOP clone derived from either miR‐557 (red) or miR‐NT (black) engineered host cells (n = 2). Process data shown include volumetric productivity, viable cell density, integral of viable cell density (biomass), viability, and lactate concentration.
Figure 8
Figure 8
Fed‐batch performance of engineered CHO host cells expressing a difficult‐to‐express mAb. The three TOP clones derived from either miR‐557 expressing (red) or negative control host cell lines (black) were cultivated for 10 days in fully controlled fed‐batch cultivation using an ambr™15 bioreactor system. Each clone was cultivated in two biological replicates. (A) Volumetric antibody productivity of the three TOP clones regarding a difficult‐to‐express mAb. Each data point represents results of one bioreactor run. (B–F) Fed‐batch cultivation process data of the respective TOP clone derived from either miR‐557 (red) or miR‐NT (black) engineered host cells (n = 2). Process data shown include volumetric productivity, viable cell density, integral of viable cell density (biomass), viability, and lactate concentration.
Figure 9
Figure 9
Analysis of product quality attributes of monoclonal antibodies produced by miRNA engineered CHO host cells. Data are presented for both easy (left panel) as well as difficult‐to‐express mAb (right panel). (A) Analysis and quantification of aggregates, fragments as well as monomers of mAbs produced by miR‐557 (red) compared to miR‐NT expressing control cells (black). Analysis was performed by Ultra‐Performance Size‐Exclusion Chromatography (UP‐SEC) using a priori Protein A purified antibodies. (B) Separation and quantification of antibody light (LC) and heavy chain (HC) as well as assembled mAb was achieved using capillary electrophoresis (CE) at either reducing or non‐reducing conditions to examine purity and integrity of produced antibodies. (C) Analysis and quantification of N‐linked glycan structures present on mAbs. Separation of N‐glycans was performed using CE using a priori Protein A purified antibodies. Samples for product quality analyses were taken from culture supernatant of ambr®15 fed‐batch cultivation runs at day of harvest. Data are presented as mean ± SD of three different cell clones (TOP 3 clones).

Similar articles

Cited by

References

    1. Barron N, Kumar N, Sanchez N, Doolan P, Clarke C, Meleady P, O'Sullivan F, Clynes M. 2011a. Engineering CHO cell growth and recombinant protein productivity by overexpression of miR‐7. J Biotechnol 151(2):204–211. - PubMed
    1. Barron N, Sanchez N, Kelly P, Clynes M. 2011b. MicroRNAs: Tiny targets for engineering CHO cell phenotypes? Biotechnol Lett 33(1):11–21. - PubMed
    1. Bentley KJ, Gewert R, Harris WJ. 1998. Differential efficiency of expression of humanized antibodies in transient transfected mammalian cells. Hybridoma 17(6):559–567. - PubMed
    1. Bertschinger M, Backliwal G, Schertenleib A, Jordan M, Hacker DL, Wurm FM. 2006. Disassembly of polyethylenimine‐DNA particles in vitro: Implications for polyethylenimine‐mediated DNA delivery. J Control Release 116(1):96–104. - PubMed
    1. Chen L, Li Y, Fu Y, Peng J, Mo MH, Stamatakos M, Teal CB, Brem RF, Stojadinovic A, Grinkemeyer M, McCaffrey TA, Man YG, Fu SW. 2013. Role of deregulated microRNAs in breast cancer progression using FFPE tissue. PLoS ONE 8(1):e54213. - PMC - PubMed

Publication types