. 2017 Apr 3;127(4):1414-1424.
doi: 10.1172/JCI88641. Epub 2017 Mar 6.

Angiotensin AT1A receptors on leptin receptor-expressing cells control resting metabolism

Angiotensin AT1A receptors on leptin receptor-expressing cells control resting metabolism

Kristin E Claflin et al. J Clin Invest. .

Abstract

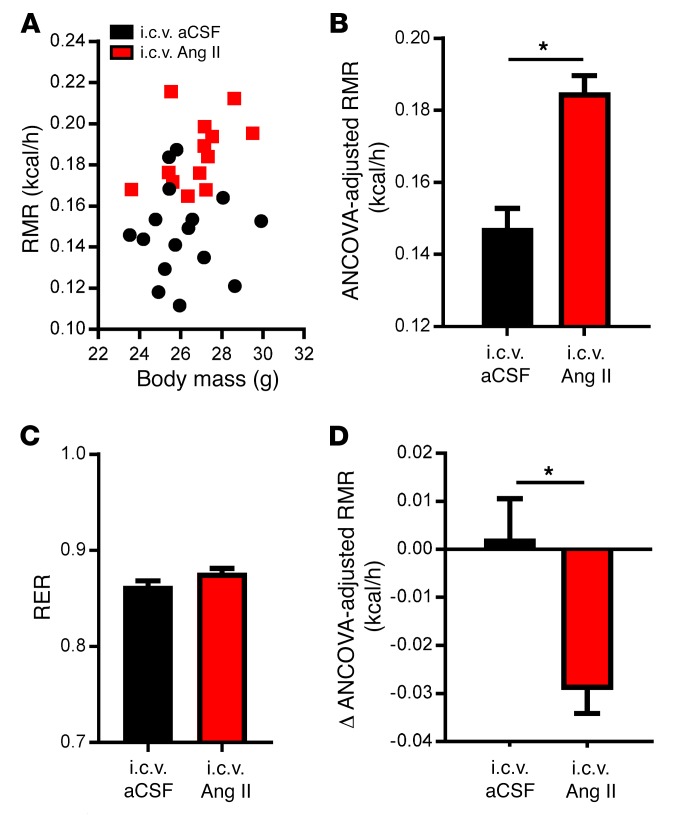
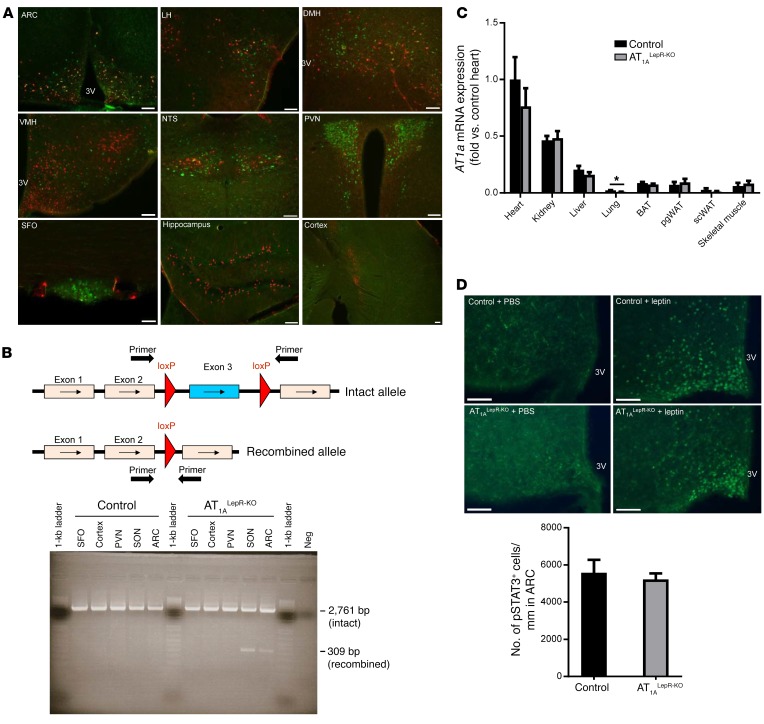
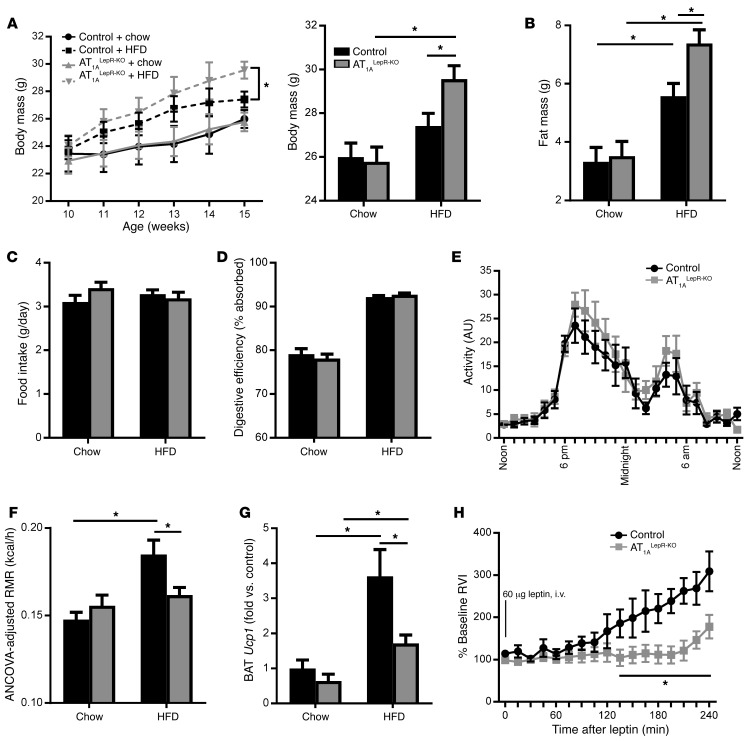
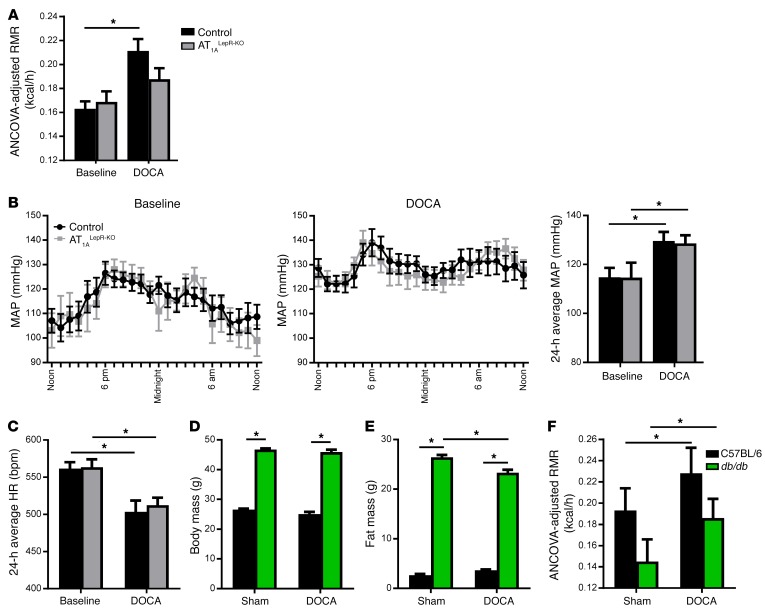
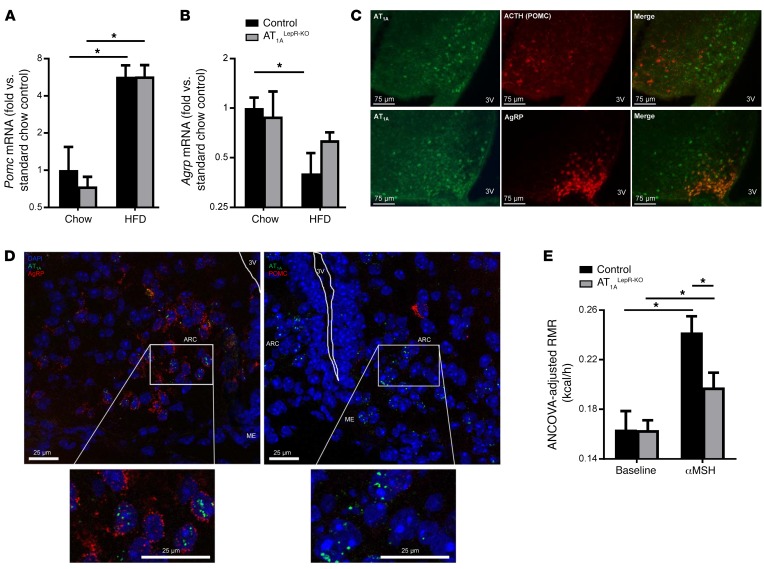
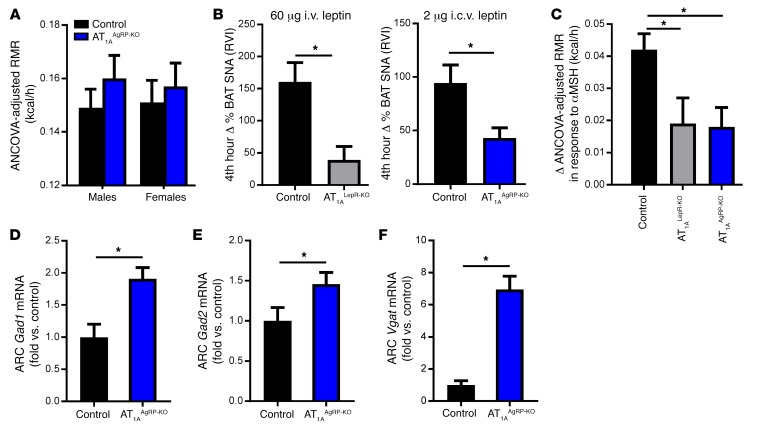
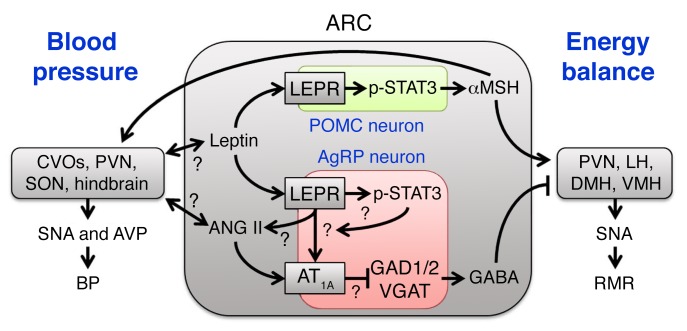
Leptin contributes to the control of resting metabolic rate (RMR) and blood pressure (BP) through its actions in the arcuate nucleus (ARC). The renin-angiotensin system (RAS) and angiotensin AT1 receptors within the brain are also involved in the control of RMR and BP, but whether this regulation overlaps with leptin's actions is unclear. Here, we have demonstrated the selective requirement of the AT1A receptor in leptin-mediated control of RMR. We observed that AT1A receptors colocalized with leptin receptors (LEPRs) in the ARC. Cellular coexpression of AT1A and LEPR was almost exclusive to the ARC and occurred primarily within neurons expressing agouti-related peptide (AgRP). Mice lacking the AT1A receptor specifically in LEPR-expressing cells failed to show an increase in RMR in response to a high-fat diet and deoxycorticosterone acetate-salt (DOCA-salt) treatments, but BP control remained intact. Accordingly, loss of RMR control was recapitulated in mice lacking AT1A in AgRP-expressing cells. We conclude that angiotensin activates divergent mechanisms to control BP and RMR and that the brain RAS functions as a major integrator for RMR control through its actions at leptin-sensitive AgRP cells of the ARC.


Conflict of interest statement

Conflict of interest: The authors have declared that no conflict of interest exists.

Figures

Figure 1
Figure 1. Intracerebroventricular ANG II stimulates the RMR via AT1A receptors.
(AC) RMR versus body mass (A), ANCOVA-adjusted RMR (B), and RER (C) of C57BL/6J mice after 10 days of i.c.v. aCSF or ANG II treatment (n = 16 aCSF-treated mice; n = 13 ANG II–treated mice). (D) Change in ANCOVA-adjusted RMR in mice given i.c.v. aCSF or ANG II after 7 days of losartan treatment (n = 6 aCSF-treated mice; n =11 ANG II–treated mice). Data represent the mean ± SEM. *P < 0.05, by Student’s t test.
Figure 2
Figure 2. AT1A and LEPR colocalize within cells in the ARC.
(A) Representative photomicrographs of AT1A and LEPR expression in various brain regions including the ARC, lateral hypothalamus (LH), dorsomedial hypothalamus (DMH), ventromedial hypothalamus (VMH), nucleus tractus solitarii (NTS), PVN, SFO, hippocampus, and cortex. Scale bars: 100 μm. (B) Primers for the detection of genetic recombination of the AT1a gene span the floxed region. Intact and recombined AT1afl/fl gene expression in the SFO, cortex, PVN, SON, and ARC of control and AT1ALepR-KO animals. (C) AT1A expression in peripheral tissues, including heart, kidney, liver, lung, BAT, perigonadal white adipose tissue (pgWAT), s.c. WAT (scWAT) and skeletal muscle of control and AT1ALepR-KO mice (n = 6/group). Data represent the mean ± SEM. *P < 0.05, by Tukey’s multiple comparisons procedure. (D) ARC p-STAT3 expression following i.p. PBS or leptin (1 μg/g) in control and AT1ALepR-KO mice after 2 weeks of HFD treatment (PBS-treated control mice; n = 3 leptin-treated control mice; PBS-treated AT1ALepR-KO mouse; n = 6 leptin-treated AT1ALepR-KO mice). Scale bars: 75 μm. Data represent the mean ± SEM. 3V, third ventricle.
Figure 3
Figure 3. AT1ALepR-KO mice exhibit impaired responses to an HFD and leptin.
(AD) Body mass (A) (n = 28 chow-fed control mice; n = 35 HFD-fed control mice; n = 26 chow-fed AT1ALepR-KO mice; n = 31 HFD-fed AT1ALepR-KO mice); fat mass (B) (n = 28 chow-fed control mice; n = 35 HFD-fed control mice; n = 26 chow-fed AT1ALepR-KO mice; n = 31 HFD-fed AT1ALepR-KO mice); home cage food intake (C) (n = 12 chow-fed control mice; n = 29 HFD-fed control mice; n = 15 chow-fed AT1ALepR-KO mice; n = 14 HFD-fed AT1ALepR-KO mice); and digestive efficiency (D) (n = 5/group) of control and AT1ALepR-KO mice on a chow diet or after 5 weeks of 45% HFD treatment. (E) Physical activity of control and AT1ALepR-KO mice on a chow diet (n = 10 control mice; n = 9 AT1ALepR-KO mice). (F and G) ANCOVA-adjusted RMR (F) (n = 13 chow-fed control mice; n = 22 HFD-fed control mice; n = 15 chow-fed AT1ALepR-KO mice; n = 12 HFD-fed AT1ALepR-KO mice) and BAT Ucp1 expression (G) (n = 4 chow-fed control mice; n = 4 HFD-fed control mice; n = 5 chow-fed AT1ALepR-KO mice; n = 8 HFD-fed AT1ALepR-KO mice) in control and AT1ALepR-KO mice on a chow diet or after 2 weeks of HFD treatment. (H) Changes in BAT SNA following i.v. administration of leptin (60 μg) in control and AT1ALepR-KO mice (n = 6 control mice; n = 5 AT1ALepR-KO mice). RVI, rectified/integrated voltage. Data represent the mean ± SEM. *P < 0.05, by Tukey’s multiple comparisons procedure.
Figure 4
Figure 4. Divergent and directional control of RMR by leptin-AT1A interaction.
(AC) ANCOVA-adjusted RMR (A) (n = 12 control baseline mice; n = 10 DOCA-salt–treated control mice; n = 13 AT1ALepR-KO baseline mice; n = 6 DOCA-salt–treated AT1ALepR-KO mice); mean arterial pressure (MAP) (B); and heart rate (HR) (C) at baseline and following treatment with DOCA-salt in control and AT1ALepR-KO mice (n = 10 control baseline mice; n = 8 DOCA-salt–treated control mice; n = 9 AT1ALepR-KO baseline mice; n = 7 DOCA-salt–treated AT1ALepR-KO mice). (DF) Body mass (D), fat mass (E), and ANCOVA-adjusted RMR (F) of C57BL/6 and db/db mice treated with DOCA-salt (n = 7 control sham; n = 9 control DOCA-salt; n = 6 db/db sham; n = 12 db/db DOCA-salt). Data represent the mean ± SEM. *P < 0.05, by Tukey’s multiple comparisons procedure.
Figure 5
Figure 5. AT1A in AgRP neurons.
(A and B) Hypothalamic Pomc (A) and Agrp (B) mRNA expression in control and AT1ALepR-KO mice on a chow diet or after 5 weeks of a 45% HFD (n = 12 chow-fed control mice; n = 4 HFD-fed control mice; n = 4 chow-fed AT1ALepR-KO mice; n = 6 HFD-fed AT1ALepR-KO mice). (C) Representative photomicrographs of AT1A receptor and ACTH (POMC) or AgRP in the ARC of chow-fed Lepr-Cre ROSA-stopflox-tdTomato NZ44 animals (scale bars: 75 μm). (D) FISH for AT1a, Pomc, and Agrp mRNA transcripts in the ARC of WT C57BL/6J mice (scale bars: 25 μm). (E) ANCOVA-adjusted RMR at baseline and in response to i.p. administration of [Nle4D–Phe7]-αMSH (4.5 μg/g) in control and AT1ALepR-KO mice (n = 3 control baseline; n = 3 control αMSH-treated mice; n = 7 chow-fed AT1ALepR-KO mice; n = 7 αMSH-treated AT1ALepR-KO mice). *P < 0.05, by Tukey’s multiple comparisons procedure.
Figure 6
Figure 6. Effect of AT1A receptors on leptin-sensitive AgRP neurons.
(A) Baseline ANCOVA-adjusted RMR in male and female AT1AAgRP-KO mice (n = 13 control baseline, n = 13 control αMSH-treated mice; n = 9 chow-fed AT1ALepR-KO mice; n = 9 αMSH-treated AT1ALepR-KO mice). (B) BAT SNA responses of control, AT1ALepR-KO, and AT1AAgRP-KO mice to acute leptin injection (60 μg i.v. leptin, n = 6 control mice, n = 5 AT1ALepR-KO mice; 2 μg i.c.v. leptin, n = 4 control mice, n = 5 AT1AAgRP-KO mice). (C) Changes in ANCOVA-adjusted RMR in response to i.p. administration of αMSH (4.5 μg/g) in control, AT1ALepR-KO, and AT1AAgRP-KO mice (n = 16 control mice; n = 7 AT1ALepR-KO mice; n = 9 AT1AAgRP-KO mice). (DF) mRNA for Gad1 (D), Gad2 (E), and Vgat (F) in the ARC of male control and AT1AAgRP-KO mice after a chow diet (n = 10 control mice, n = 5 AT1AAgRP-KO mice). Data represent the mean ± SEM. *P < 0.05, by Tukey’s multiple comparisons procedure.
Figure 7
Figure 7. Working model.
Working model illustrating circuits within the ARC informed by the current study. See also Supplemental Figure 3 for an anatomical illustration of the relevant brain regions. AVP, arginine vasopressin; CVOs, circumventricular organs.

Comment in

  • Worth its salt.
    Shoemaker AH. Shoemaker AH. Sci Transl Med. 2017 Apr 5;9(384):eaan2774. doi: 10.1126/scitranslmed.aan2774. Sci Transl Med. 2017. PMID: 28381536

References

    1. Lavoie JL, Sigmund CD. Minireview: overview of the renin-angiotensin system — an endocrine and paracrine system. Endocrinology. 2003;144(6):2179–2183. doi: 10.1210/en.2003-0150. - DOI - PubMed
    1. Dinh DT, Frauman AG, Johnston CI, Fabiani ME. Angiotensin receptors: distribution, signalling and function. Clin Sci. 2001;100(5):481–492. - PubMed
    1. Karnik SS, et al. International union of basic and clinical pharmacology. Pharmacol Rev. 2015;67(4):754–819. doi: 10.1124/pr.114.010454. - DOI - PMC - PubMed
    1. Aldred GP, Chai SY, Song K, Zhuo J, MacGregor DP, Mendelsohn FA. Distribution of angiotensin II receptor subtypes in the rabbit brain. Regul Pept. 1993;44(2):119–130. doi: 10.1016/0167-0115(93)90235-Z. - DOI - PubMed
    1. Jöhren O, Sanvitto GL, Egidy G, Saavedra JM. Angiotensin II AT1A receptor mRNA expression is induced by estrogen-progesterone in dopaminergic neurons of the female rat arcuate nucleus. J Neurosci. 1997;17(21):8283–8292. - PMC - PubMed