. 2017 Apr 3;127(4):1225-1240.
doi: 10.1172/JCI87442. Epub 2017 Mar 6.

Laminar flow downregulates Notch activity to promote lymphatic sprouting

Laminar flow downregulates Notch activity to promote lymphatic sprouting

Dongwon Choi et al. J Clin Invest. .

Abstract

The major function of the lymphatic system is to drain interstitial fluid from tissue. Functional drainage causes increased fluid flow that triggers lymphatic expansion, which is conceptually similar to hypoxia-triggered angiogenesis. Here, we have identified a mechanotransduction pathway that translates laminar flow-induced shear stress to activation of lymphatic sprouting. While low-rate laminar flow commonly induces the classic shear stress responses in blood endothelial cells and lymphatic endothelial cells (LECs), only LECs display reduced Notch activity and increased sprouting capacity. In response to flow, the plasma membrane calcium channel ORAI1 mediates calcium influx in LECs and activates calmodulin to facilitate a physical interaction between Krüppel-like factor 2 (KLF2), the major regulator of shear responses, and PROX1, the master regulator of lymphatic development. The PROX1/KLF2 complex upregulates the expression of DTX1 and DTX3L. DTX1 and DTX3L, functioning as a heterodimeric Notch E3 ligase, concertedly downregulate NOTCH1 activity and enhance lymphatic sprouting. Notably, overexpression of the calcium reporter GCaMP3 unexpectedly inhibited lymphatic sprouting, presumably by disturbing calcium signaling. Endothelial-specific knockouts of Orai1 and Klf2 also markedly impaired lymphatic sprouting. Moreover, Dtx3l loss of function led to defective lymphatic sprouting, while Dtx3l gain of function rescued impaired sprouting in Orai1 KO embryos. Together, the data reveal a molecular mechanism underlying laminar flow-induced lymphatic sprouting.


Conflict of interest statement

Conflict of interest: The authors have declared that no conflict of interest exists.

Figures

Figure 1
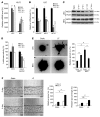
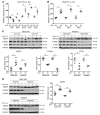
Figure 1. Laminar flow selectively suppresses NOTCH1 activity in LECs.
(A and B) Real-time quantitative reverse transcription PCR (qRT-PCR) data showing the mRNA levels of KLF2 in LECs and BECs (A) and those of Notch target genes in LECs (B) in response to steady laminar flow (2 dyn/cm2). Expression of the Notch target genes in BECs by laminar flow is shown in Supplemental Figure 1C. (C) Protein levels of NICD1 in LECs and BECs in response to laminar flow (2 dyn/cm2). The intensity of the Western blotting bands is quantitated in Supplemental Figure 1E. A monoclonal anti-NOTCH1 antibody that specifically detects the cleaved form of NOTCH1 at Val1744 was used. Blots presented are derived from replicate samples run on parallel gels. (D) Luciferase assay showing the flow-mediated suppression of Notch activity in LECs. LECs were transfected with a Notch activity reporter (pGa981-6) (60) and exposed to laminar flow (2 dyn/cm2) for 24 or 48 hours before measurement of luciferase activity. (E) Spheroid-based sprouting assays. Cells were exposed or not exposed to laminar flow (2 dyn/cm2) for 24 hours, stained with a CellTracker dye, aggregated in methylcellulose polymers, and then embedded in Matrigel. After 24 hours, images of more than 20 spheroids were taken for analyses, and relative sprout numbers were quantified in the graph. (F) Biomimetic sprouting assay. Intraluminal laminar flow (5 dyn/cm2) was applied onto a layer of LECs lining the inner wall of the vascular mimetic channels made in collagen gel. Scale bars: 100 μm. Relative sprout length and number were graphed. Each experiment was independently performed at least 3 times with consistent results. Data are expressed as SEM and SD from 1 representative data set. *P < 0.05; #P < 0.01; §P < 0.001; t test.
Figure 2
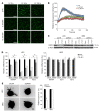
Figure 2. ORAI1 is essential for the laminar flow–induced NOTCH1 suppression in LECs.
(A and B) Activation of Ca2+ mobilization in LECs by laminar flow: Fluo-4–loaded LECs were pretreated with PBS (CTR) or SKF-96365 (SKF), an inhibitor of store-operated Ca2+ entry (SOCE), for 10 minutes, and subjected to laminar flow (2 dyn/cm2). Calcium signals were captured by a time-lapse microscope (A). Relative signal intensity was plotted in the graph (B). (C) NICD1 protein level in LECs and BECs that were transfected with control siRNA (siCTR) or ORAI1 siRNA (siORAI1) for 24 hours, then subjected to laminar flow (2 dyn/cm2). The vertical line marks a boundary between 2 different areas in the same gel. Blots presented are derived from replicate samples run on parallel gels. (D) qRT-PCR data showing the mRNA level of NRARP, HEY1, and HEY2 in ORAI1-inhibited LECs and BECs. Statistical comparison was made between control siRNA and ORAI1 siRNA samples at each time point to assess the reversal of the laminar flow–mediated suppression of the genes. (E) Effect of ORAI1 knockdown on the flow-induced sprouting of LECs and BECs. Cells were transfected with control or ORAI1 siRNA for 24 hours, exposed to laminar flow (2 dyn/cm2) for 24 hours, stained with a CellTracker dye, aggregated in methylcellulose polymers, and embedded in Matrigel. After 24 hours, spheroid images (>20) were taken and relative sprout numbers were quantified by NIH ImageJ. Scale bars: 50 μm. Data are expressed as SEM and SD of a representative of 3 independent experiments. *P < 0.05; #P < 0.01; §P < 0.001; t test.
Figure 3
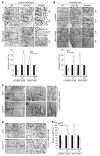
Figure 3. ORAI1 is required for normal lymphatic sprouting during development.
(A) Immunofluorescence images of lymphatic and blood vessels in the back skins of WT and Orai1 KO embryos (E15.5). Lymphatics were stained for LYVE-1, and blood vessels were visualized by anti-CD31 staining. The graph shows the relative number of branching points (BP no.) and average distance between the branching points (BP-BP dis.). Scale bars: 100 μm. (B) The ear vasculature of 3-week-old WT and Orai1 KO mice was similarly visualized and analyzed. Scale bars: 250 μm. (CE) Endothelial-specific deletion of Orai1 (Orai1ECKO) was induced in pregnant females by peritoneal injection of tamoxifen (1.5 mg) at E11.5 and 13.5. At E15.5, the embryos were harvested and genotyped. Lymphatics and blood vessels of the back skins of the control (CTR) embryos [Orai1+/+ Cdh5(Pac)-CreERT2 Prox1-EGFP] and Orai1ECKO embryos [Orai1fl/fl Cdh5(Pac)-CreERT2 Prox1-EGFP] were visualized by lymphatic-specific EGFP signals (C) and anti-CD31 staining (D), respectively. Scale bars: 250 μm (C), 100 μm (D). (E) Vascular analyses were performed as described above. For all studies, a total of more than 6 embryos or postnatal mice per genotype collected from at least 3 independent litters were analyzed. The dorsal midline areas of the embryos were chosen as the sites for vascular analyses. Data are expressed as SEM and SD. *P < 0.05; #P < 0.01; §P < 0.001.
Figure 4
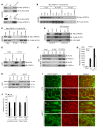
Figure 4. CaM physically interacts with PROX1 and regulates lymphatic sprouting.
(A) CaM overlay assays. Top: Western analysis showing the quantity and quality of recombinant GST-PROX1 fragments (D1–D7; Supplemental Figure 4B). Middle and bottom: CaM overlay assays were performed on duplicate blots using the CaM::HRP conjugate protein in the presence of CaCl2 (1 mM, middle) or EGTA (5 mM, bottom). (B) Substitution mutations in the predicted CaM-binding site of PROX1: uncharged residues (V19, I21, V23, V27, A30, A32, F33, and F34) were replaced with aspartic acid, D. (C) CaM overlay assays performed against the PROX1 mutant fragments identified 2 residues (V23, V27) as essential for the CaM/PROX1 binding. (D) Superposed 1H,15N heteronuclear single quantum coherence spectra of Ca2+-saturated CaM recorded with 0 (black), 0.5 (red), 1.0 (green), and 1.5 (blue) molar equivalents of PROX1 peptide (aa 15–35). The assignments for separated signals are shown. Signals from the N-domain of CaM were perturbed in slow exchange on the NMR timescale, whereas the perturbations of the signals from the C-domain were relatively small and in fast exchange. (E) Co-IP assay demonstrating calcium-dependent interaction of PROX1 and CaM. HEK293 cells were transfected with vectors expressing FLAG-tagged PROX1 and/or HA-tagged CaM, treated with Bapta-AM (Bapta, 3 μM), ionomycin (Iono, 1 μM), and KCl (40 mM), and co-IP was performed. Band intensity is quantitated in Supplemental Figure 5A. (F) Co-IP assay demonstrating that laminar flow (LF, 2 dyne/cm2) enhanced the interaction between PROX1 and CaM in LECs. LECs were treated with Bapta-AM (3 μM, Bapta) for 10 minutes, followed by laminar flow for 4 hours. Two CaM blots from a short or long exposure are shown. Band intensity is quantitated in Supplemental Figure 5B. (G) Whole-mount LYVE-1 staining of the back skin of embryos (E15.5) having LSL-GCaMP3, Tie2-Cre LSL-GCaMP3, or Prox1-CreERT2 LSL-GCaMP3 transgenes. Pregnant mice were injected i.p. with tamoxifen (1.5 mg) at E11.5 and E13.5, and the embryos of each genotype were harvested at E15.5 for lymphatic analyses. More than 5 embryos total per genotype collected from at least 3 independent litters were analyzed. Scale bars: 100 μm. For in vitro experiments, data are expressed as SEM and SD from a representative of 3 independent experiments.
Figure 5
Figure 5. KLF2 forms a complex with PROX1 and CaM, and is required for lymphatic sprouting.
(A) FLAG-KLF2 and/or Myc-PROX1 were expressed in HEK293 cells, and co-IP assays were performed using anti-FLAG (top panel) or anti-Myc antibody (bottom panel). (B) Co-IP assays were performed against FLAG-KLF2 and Myc-PROX1 in HEK293 cells in the presence of DMSO (CTR), Bapta-AM (Bapta, 10 μM), ionomycin (Iono, 1 μM), or Bapta-AM (10 μM)/ionomycin (1 μM). (C) CaM promotes PROX1/KLF2 interaction. FLAG-KLF2 and Myc-PROX1 were expressed in HEK293 cells with CaM (HA-CaM) or not (Empty). Co-IP was performed using IgG or anti-FLAG antibody. (D) Serial Co-IP assays showing a protein complex formation among KLF2, PROX1, and CaM. These 3 proteins were expressed in HEK293 cells and first immunoprecipitated using FLAG-antibody beads (1st Co-IP) and then using anti-HA antibody (2nd Co-IP) for final immunodetection of Myc-PROX1. See details in Supplemental Information. (E) LECs were cultured under static or laminar flow (2 dyn/cm2), and co-IP assays were performed using IgG or anti-PROX1 antibody, followed by immunoblotting against KLF2 or PROX1. (F) Effect of calcium chelation on PROX1/KLF2 complex formation. (Pre-Bapta) LECs were pretreated with Bapta-AM (10 μM) for 10 minutes and exposed to laminar flow (2 dyn/cm2) for 24 hours before co-IP assay. (Post-Bapta) LECs were exposed to laminar flow for 0.5 hours, treated with Bapta-AM (10 μM), and subjected to laminar flow (2 dyn/cm2) for an additional 0.5 hours before co-IP assay. (G) qRT-PCR analyses showing that ORAI1 inhibition by SKF-96365 (SKF, 3 μM) reduced the flow-induced KLF2 upregulation in LECs. (H) Western blot assays showing protein levels of KLF2, NICD1, and β-actin in LECs, which were transfected with scrambled siRNA (siCTR) or KLF2 siRNA (siKLF2) and exposed to laminar flow (2 dyne/cm2). A vertical line marks spliced lanes. (I and J) Lymphatic and blood vessels of the back skins of control (CTR) embryos [Cdh5(PAC)-CreERT2 Klf2+/+ Prox1-EGFP] and Klf2ECKO embryos [Cdh5(PAC)-CreERT2 Klf2fl/fl Prox1-EGFP] were visualized by lymphatic-specific EGFP signal and CD31 immunostaining, respectively, at E15.5. Equivalent anatomic locations were chosen for i and iii, and for ii and iv. Scale bars: 100 μm. (J) Vascular analyses were performed and graphed. Data are expressed as SEM and SD of a representative of 3 independent experiments. *P < 0.05; #P < 0.01; §P < 0.001.
Figure 6
Figure 6. PROX1/KLF2 complex promotes lymphatic sprouting by upregulating DTX1 and DTX3L.
(A and B) qRT-PCR analyses showing the expression of DTX1 (A) and DTX3L (B) in LECs and BECs exposed to laminar flow (2 dyne/cm2) for 0 (static), 3, 6, 12, and 24 hours. Protein expression is shown in Supplemental Figure 9. (C and D) ChIP assays demonstrating the binding of PROX1 and KLF2 to the promoters of the DTX1 (C) and DTX3L (D) genes in LECs, which were exposed to laminar flow for 0 (static) or 3 hours in the presence of vehicle (DMSO) or SKF-96365 (SKF, 3 μM). (E and F) Western blot assays showing a synergistic degradation of NICD1 by DTX1 and/or DTX3L in HEK293 cells (E) and LECs (F). Band intensities are graphed in Supplemental Figure 10, A and B. (G) Western blot assays showing the knockdown effect of DTX1 and/or DTX3L on the flow-induced downregulation of NICD1. LECs were transfected with siRNA for DTX1 and/or DTX3L for 24 hours, followed by laminar flow for 0 (static), 12, or 24 hours, and subjected to immunoblotting for NICD1 and β-actin. Band intensities were measured and are graphed in Supplemental Figure 10C. (H) Spheroid-based sprouting assay showing that sprouting capability was significantly reduced by knockdown of DTX1 or DTX3L. LECs were transfected with control siRNA (siCTR), siRNA for DTX1 (siDTX1), or siRNA for DTX3L (siDTX3L) for 12 hours, exposed to laminar flow (2 dyn/cm2) for 24 hours, and subjected to sprouting assays as described in Figure 1E (n > 20 spheroids). (I) Lymphatics and blood vessels were visualized by LYVE-1 and CD31 staining, respectively, in the back skins of WT and Dtx3l KO embryos (E15.5). Boxed areas are enlarged at right. Scale bars: 100 μm. (J) The number of branching points (BP no.) and distance between the branching points (BP-BP dis.) of lymphatic vessels (LV) and blood vessels (BV) were quantified and graphed. More than 4 embryos per genotype harvested from at least 3 independent litters were analyzed. Data are expressed as SEM and SD. #P < 0.01; §P < 0.001.
Figure 7
Figure 7. Regulation of Notch pathway genes by ORAI1 and DTX3L during lymphatic development.
(A and B) qRT-PCR analyses showing the expression of Klf2, Dtx3l, Nrarp, Hey1, and/or Hey2 in dermal LECs freshly isolated from WT or KO embryos of Orai1 (A) or Dtx3l (B). (C and D) Western blot assays showing the protein expression of NICD1, DTX3L, and/or DTX1 in the back skins or intestines of WT versus mutant embryos of Orai1 (C) or Dtx3l (D). A monoclonal anti-NOTCH1 antibody that specifically detects the cleaved form of NOTCH1 at Val1744 was used to detect the NICD1 protein. Ratios of band intensities of NICD1, DTX3L, and DTX1 normalized against β-actin are graphed (n > 4 per genotype). Data are expressed as mean ± SEM. Each data point represents an individual embryo (n > 3 per genotype). *P < 0.05; #P < 0.01; §P < 0.001.
Figure 8
Figure 8. Overexpression of DTX3L rescues the defective lymphatic sprouting of Orai1 KO mice.
(A and B) Lymphatic and blood vessels were visualized in control embryos (Prox1-EGFP) or Dtx3lTG transgenic embryos [Prox1-EGFP Cdh5(PAC)-CreERT2 LSL-Dtx3l]. (A) Pregnant females were injected with tamoxifen at E11.5 and E13.5. At E15.5, dermal lymphatic and blood vessels were visualized by EGFP and CD31 staining, respectively. Panels i and ii display lymphatic vessels growing into the dorsal midline region. Boxed areas are enlarged in panels iii and iv, respectively. Arrows indicate distance between front lines of lymphatic vessels growing from the lateral areas into the midline. Panels v and vi highlight the dorsal midline area. Blood vessels in the corresponding area are shown in panels vii and viii, respectively. (B) Vascular analyses were performed and graphed to show branching point numbers (BP no.) and distance between the branching points (BP-BP dis.) of lymphatic vessels (LV) and blood vessels (BV). More than 5 embryos total per genotype obtained from 3 independent litters were analyzed. The dorsal midline regions were imaged for the vascular analyses. (C and D) Ectopic expression of DTX3L rescues the lymphatic sprouting defects in Orai1 KO embryos. (C) Endothelial-specific Orai1ECKO and/or Dtx3l ectopic expression were induced in pregnant females at E11.5 and E13.5 by i.p. tamoxifen injection. Lymphatic and blood vessels were detected by LYVE-1 and CD31 staining, respectively, in the back skins of embryos with indicated genotypes at E15.5. (D) Vascular analyses were performed to determine the number of branching points (BP no.) and distance between the branching points (BP-BP dis.) of lymphatic vessels. (E) Schematic illustration showing a current working model of laminar flow–induced lymphatic sprouting. More than 4 embryos total per genotype were harvested from at least 3 independent litters and analyzed. The dorsal midline areas of the embryos were imaged for the vascular analyses. Scale bars: 100 μm (A, iii–viii; C); 1 mm (A, i, ii). *P < 0.05; #P < 0.01; §P < 0.001.

References

    1. Escobedo N, Oliver G. Lymphangiogenesis: origin, specification, and cell fate determination. Annu Rev Cell Dev Biol. 2016;32:677–691. doi: 10.1146/annurev-cellbio-111315-124944. - DOI - PubMed
    1. Swartz MA, Boardman KC. The role of interstitial stress in lymphatic function and lymphangiogenesis. Ann N Y Acad Sci. 2002;979:197–210. doi: 10.1111/j.1749-6632.2002.tb04880.x. - DOI - PubMed
    1. Ng CP, Helm CL, Swartz MA. Interstitial flow differentially stimulates blood and lymphatic endothelial cell morphogenesis in vitro. Microvasc Res. 2004;68(3):258–264. doi: 10.1016/j.mvr.2004.08.002. - DOI - PubMed
    1. Boardman KC, Swartz MA. Interstitial flow as a guide for lymphangiogenesis. Circ Res. 2003;92(7):801–808. doi: 10.1161/01.RES.0000065621.69843.49. - DOI - PubMed
    1. Breslin JW, Kurtz KM. Lymphatic endothelial cells adapt their barrier function in response to changes in shear stress. Lymphat Res Biol. 2009;7(4):229–237. doi: 10.1089/lrb.2009.0015. - DOI - PMC - PubMed

MeSH terms