
Abstract

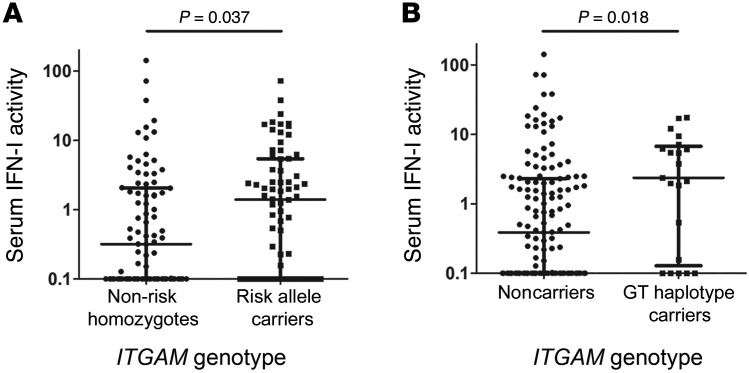
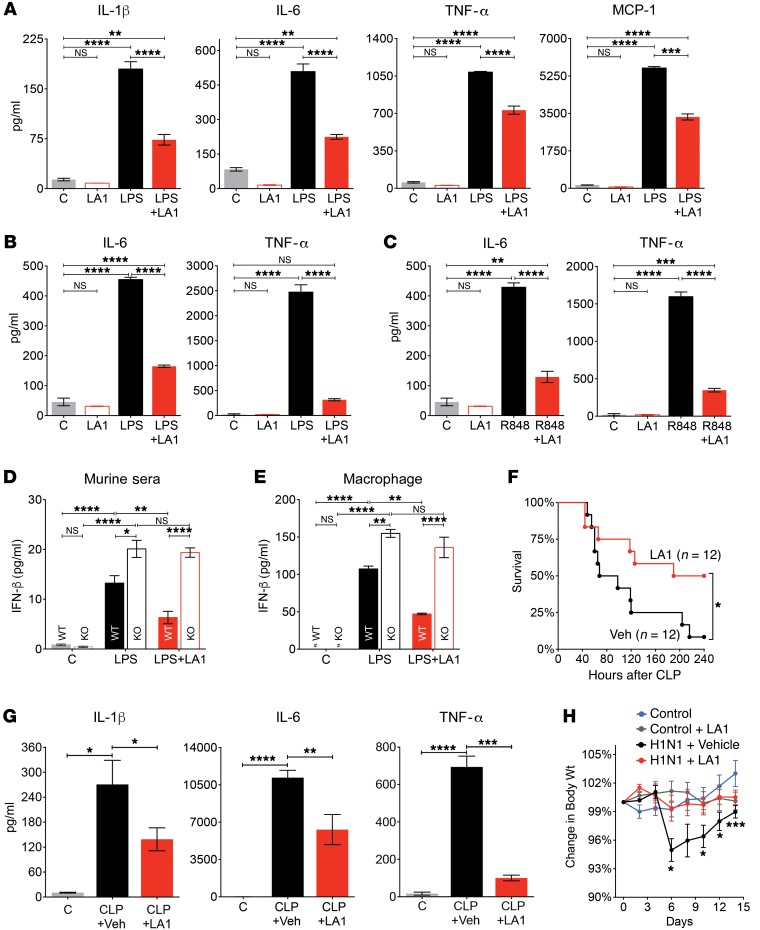
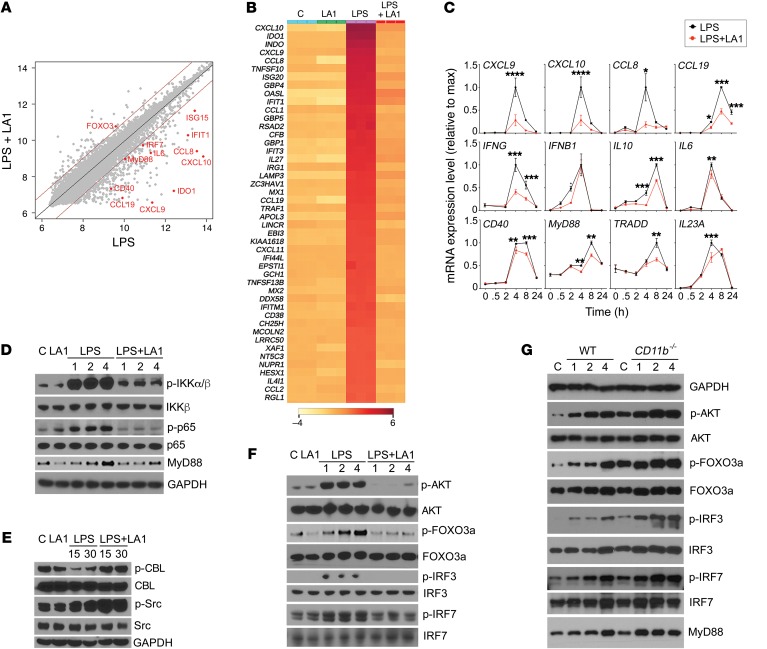
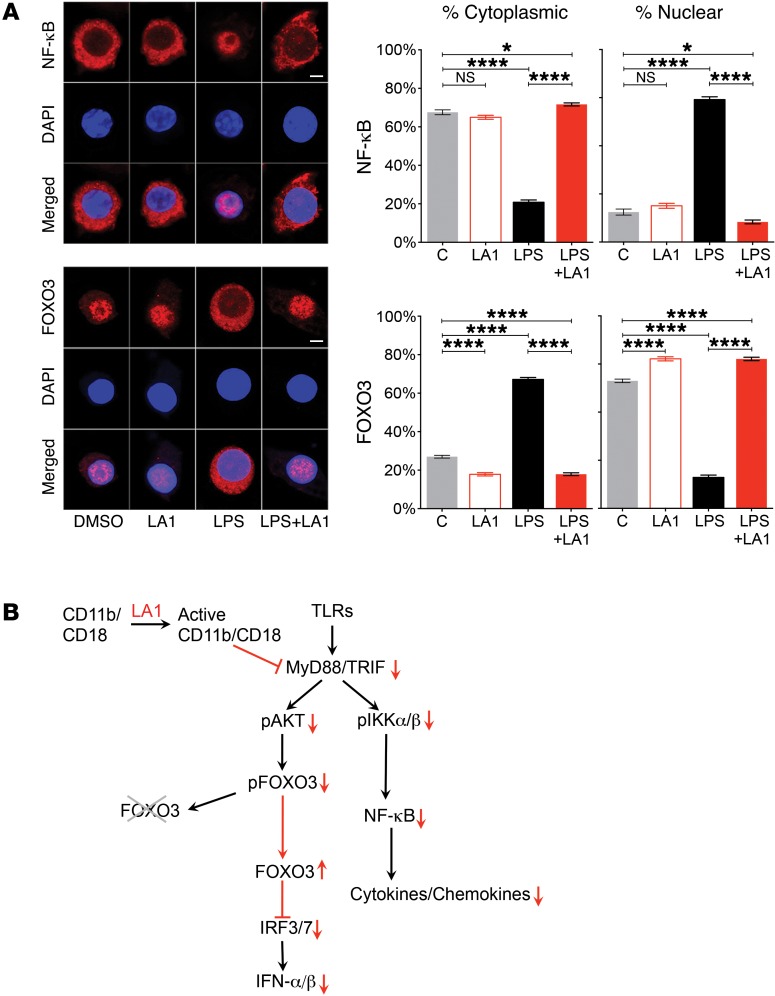
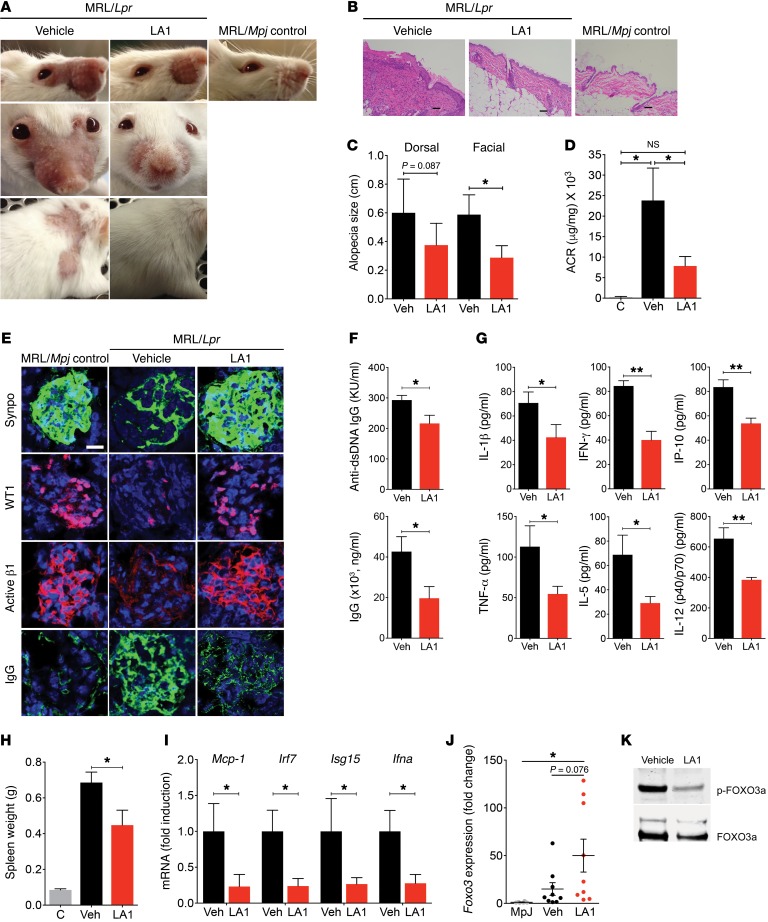
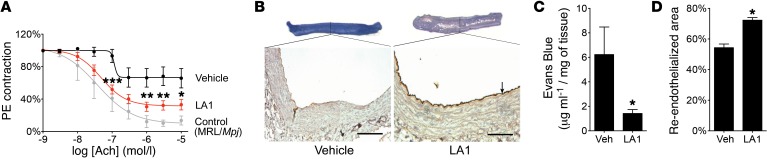
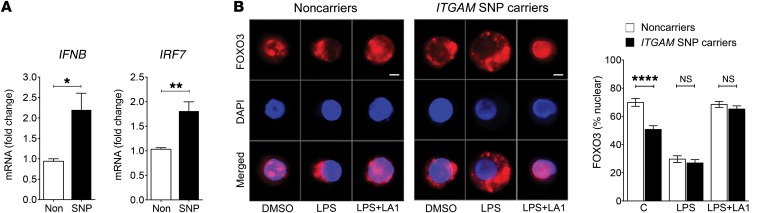
Genetic variations in the ITGAM gene (encoding CD11b) strongly associate with risk for systemic lupus erythematosus (SLE). Here we have shown that 3 nonsynonymous ITGAM variants that produce defective CD11b associate with elevated levels of type I interferon (IFN-I) in lupus, suggesting a direct link between reduced CD11b activity and the chronically increased inflammatory status in patients. Treatment with the small-molecule CD11b agonist LA1 led to partial integrin activation, reduced IFN-I responses in WT but not CD11b-deficient mice, and protected lupus-prone MRL/Lpr mice from end-organ injury. CD11b activation reduced TLR-dependent proinflammatory signaling in leukocytes and suppressed IFN-I signaling via an AKT/FOXO3/IFN regulatory factor 3/7 pathway. TLR-stimulated macrophages from CD11B SNP carriers showed increased basal expression of IFN regulatory factor 7 (IRF7) and IFN-β, as well as increased nuclear exclusion of FOXO3, which was suppressed by LA1-dependent activation of CD11b. This suggests that pharmacologic activation of CD11b could be a potential mechanism for developing SLE therapeutics.


Conflict of interest statement

Conflict of interest: V. Gupta is an inventor of pending patents related to this study (WO2013159082) and has the potential for financial benefit from their future commercialization. V. Gupta is also a cofounder and a member of the scientific advisory board of Adhaere Pharmaceuticals Inc., a company developing novel therapeutics for inflammation, cancer, and autoimmune diseases.

Figures

Figure 1
Figure 1. ITGAM SNPs correlate with elevated IFN-I activity in SLE patients.
(A) Functional IFN-I activity, as determined using reporter cell assay (3, 78), in serum samples from 171 SLE subjects genotyped for 3 ITGAM SNPs (rs1143678, rs1143679, and rs1143683) and its association with minor allele carriers compared with carriers of major alleles, stratified by high versus low IFN-I levels. Each dot represents a unique sample. (B) Functional association with serum IFN-I activity in patients carrying ITGAM haplotype rs1143679(G)-rs1143683(T) versus noncarriers.
Figure 2
Figure 2. LA1 induces intermediate-affinity conformation in CD11bA and reduces TLR-stimulated proinflammatory cytokines.
(A) IL-1β, IL-6, TNF-α, and MCP-1 levels in primary mouse macrophage supernatants treated with vehicle DMSO (C), LA1 (20 μM), LPS (50 ng/ml), or LPS+LA1 for 8 hours (MCP-1) or 12 hours (IL-1β, IL-6, and TNF-α). Bars show mean ± SEM (n = 3) from 1 of at least 3 independent experiments. (B) IL-6 and TNF-α levels in supernatants of human macrophages treated with vehicle DMSO (C), LPS (50 ng/ml), or LPS+LA1 for 12 hours. Bars show mean ± SEM (n = 3) from 1 of at least 2 independent experiments. (C) IL-6 and TNF-α levels in supernatants of human macrophages treated with vehicle DMSO (C), R848, or R848+LA1 for 12 hours. Bars show mean ± SEM (n = 3) from 1 of 2 independent experiments. (D) IFN-β levels in the sera of WT or CD11b–/– mice treated with DMSO (C), LPS (100 ng/ml), or LPS+LA1 for 4 hours. Bars show mean ± SEM (n = 3). (E) IFN-β levels in supernatants of primary WT or CD11b–/– macrophages treated with DMSO (C), LA1 (20 μM), LPS (100 ng/ml), or LPS+LA1 for 12 hours. Bars show mean ± SEM (n = 3) from a representative experiment. #Not detectable. (F) Survival of C57BL/6 mice (n = 12) subjected to CLP and treated with vehicle (1% DMSO in saline) or LA1 (2 mg/kg/d). (G) IL-1β, IL-6, and TNF-α in plasma obtained 24 hours after C57BL/6 mice were subjected to either sham surgery (C) or CLP and treated with either vehicle (CLP+Veh) or LA1 (CLP+LA1). Bars show mean ± SEM. (H) Body weight loss (percentage of the initial weight) over 14 days in C57BL/6 mice (n = 20 per group) infected with WT H1N1 virus and treated daily with either vehicle (H1N1 + Vehicle) or LA1 (H1N1 + LA1). Weight loss in noninfected animals (control) and noninfected animals treated with LA1 (Control + LA1) is also shown. Each data point represents mean ± SEM (*P < 0.05, **P < 0.01, ***P < 0.001, ****P < 0.0001; AE, 1-way ANOVA, Tukey’s test; FH, Student’s t test).
Figure 3
Figure 3. LA1-mediated CD11b activation suppresses IFN signaling via AKT/FOXO3/IRF3/7 axis.
(A) Scatter plot comparing global mRNA expression profiles from human macrophages treated with LPS (50 ng/ml) (x axis) or LPS (50 ng/ml) plus LA1 (20 μM) (y axis) for 4 hours. The dark red lines indicate a 2-fold cutoff for the ratio of expression levels. Data represent the average of 3 experiments and are on the log2 scale. The numbers of genes that are significantly changed by LA1 are labeled on the graph (red dots). (B) Hierarchical clustering of the gene expression data for the top 50 genes downregulated by LA1. (C) mRNA levels of CXCL9, CXCL10, CCL8, CCL19, IFNG, IFNB1, IL10, IL6, CD40, MYD88, TRADD, and IL23a in LPS-stimulated macrophages in the absence or presence of LA1 at various time points. Data are mean ± SEM from a triplicate experiment (*P < 0.05, **P < 0.01, ***P < 0.001, ****P < 0.0001, Student’s t test). (DF) Immunoblot analysis of various phosphorylated (p-) and total proteins in lysates of RAW macrophages stimulated with LPS (50 ng/ml) for 0–4 hours (D and F) or 0–30 minutes (E) in the absence or presence of LA1. GAPDH (in D for D and F, in E for E) was used as loading control. (G) Immunoblot analysis of various phosphorylated (p-) and total proteins in lysates of primary mouse macrophages from WT and CD11b–/– animals. Macrophages in culture were stimulated with LPS (100 ng/ml) for 0–4 hours, lysed, and analyzed. GAPDH was used as loading control.
Figure 4
Figure 4. CD11b activation preserves retention of FOXO3 in the nucleus.
(A) Representative immunofluorescence images of subcellular localization of NF-κB (red, top panels) and FOXO3 (red, bottom panels) in RAW macrophages treated with vehicle DMSO, LA1 (20 μM), LPS (50 ng/ml), or LPS+LA1 for 4 hours. Nuclei were stained with DAPI (blue). Scale bars: 10 μm. Bar graphs represent quantification of the cytoplasmic and nuclear fraction of NF-κB (top) and FOXO3 (bottom) in cells (n = 30). Data are mean ± SEM (*P < 0.05, ****P < 0.0001, 1-way ANOVA, Tukey’s test). (B) A schematic showing a working model of how CD11b activation with LA1 suppresses TLR and IFN-I signaling.
Figure 5
Figure 5. LA1 protects mice from SLE.
(A) Erythema and alopecia in facial and dorsal areas in treated MRL/lpr mice. MRL/Mpj served as control. (B) Representative H&E images from skin of mice in A. Scale bar: 100µm. (C) Alopecia quantification from mice in A (n = 6/group). (D) Urinary albumin/creatinine ratio (ACR) from mice in A (n = 7 for C, n = 14 LA1-treated and n = 12 vehicle-treated). (E) Images of kidney glomeruli from treated, 19-week-old mice, stained with antibodies against synaptopodin (Synpo, green), WT1 (red), and integrin β1 activation epitope (Active β1, red), or with anti-IgG (IgG, green). Nuclei were stained with DAPI (blue). Scale bar: 20μm. (F) Quantification of serum anti-ds-DNA antibodies and total IgG in treated mice, at 19-weeks of age (n = 7 LA1-treated and n = 8 vehicle-treated). (G). Quantification of pro-inflammatory cytokines in the sera from 12-week-old MRL/lpr mice treated with either vehicle or LA1 for 4 weeks (n = 6/group). (H) Spleen weight from treated mice, at 19-weeks of age. MRL/Mpj served as controls (n = 7 LA1-treated and n = 8 vehicle-treated). (I) Relative levels of IFN-I-inducible genes in splenocytes from 19-week-old mice, expressed as fold-change in LA1-treated mice over vehicle-treated mice (normalized to 1) (n = 6 per group). (J) Foxo3 mRNA levels in splenic monocytes 19-week-old mice, expressed as fold-change in LA1 treated mice over MRL/Mpj (normalized to 1) (n = 9 per group in MRL/lpr and n = 6 in MRL/Mpj). (K) Immunoblot analysis of phosphorylated (p-) FOXO3a protein level in pooled lysates of bone marrow monocytes from 19-week-old treated mice (n = 6 per group). Total FOXO3a was used as loading control. (Data shown in all the graphs are mean ± SEM. *P <0.05, **P <0.01, D, 1-way ANOVA, Tukey’s test; C and F–J, Student’s t test or Mann-Whitney test).
Figure 6
Figure 6. LA1 improves vasorelaxation in mice.
(A) Quantification of acetylcholine-dependent (Ach-dependent) relaxation after phenylephrine (PE) precontraction in aortic rings from 19-week-old MRL/Lpr mice after 10-week treatment with LA1 or vehicle. Control data are from MRL/Mpj. Data are mean ± SEM (n = 7 LA1-treated, n = 8 vehicle-treated). (*P < 0.05, **P < 0.01, ***P < 0.001, comparing LA1 vs. controls.) Curves were first analyzed using an asymmetric (5 parameters) logistic equation; significance was determined by 2-way ANOVA. (B) Representative photomicrographs of balloon-injured arteries from rats treated with vehicle or LA1. Images of arteries stained with Evans blue vital staining in situ before sacrifice are shown at the top. Photomicrograph of cross section of arteries stained with anti-vWF antibody to label the endothelium (arrow) is presented below. Scale bars: 50 μm. (C) Quantification of the amount of Evans blue extracted from the balloon-injured arteries from rats treated with vehicle or LA1 (as in B). Data are mean ± SEM (n = 7 vehicle-treated, n = 8 LA1-treated). (D) Quantification of the extent of reendothelialization 7 days after balloon injury from the balloon-injured arteries from rats treated with vehicle or LA1 after staining with anti-vWF antibody (as in B). Data shown are mean ± SEM (n = 7 vehicle-treated, n = 8 LA1-treated) (C and D, *P < 0.05, Student’s t test).
Figure 7
Figure 7. LA1 reduces IFN-I levels and the nuclear exclusion of FOXO3 in LPS-stimulated patient cells.
(A) Real-time qRT-PCR–based measurement of IFNB and IRF7 in PBMCs from normal donors carrying nonvariant or variant alleles of ITGAM. The data shown are expressed as fold change of ITGAM variant SNP carriers over noncarriers (normalized to 1). Data shown are mean ± SEM (major allele carriers, n = 5, and minor allele carriers, n = 6). (B) Representative immunofluorescence images of subcellular localization of FOXO3 (red, bottom panels) in human macrophages from donors carrying nonvariant (Noncarriers) or variant alleles (SNP carriers) of ITGAM treated with vehicle DMSO, LPS (50 ng/ml), or LPS (50 ng/ml) plus LA1 (20 μM) for 4 hours. Nuclei were stained with DAPI (blue). Scale bars: 10 μm. Bar graphs represent quantitation of the nuclear fraction of FOXO3 in cells (n = 30) from 3 unique donors in each group. Data are mean ± SEM (*P < 0.05, **P < 0.01, ****P < 0.0001, Student’s t test).

Comment in

References

    1. Tsokos GC. Systemic lupus erythematosus. N Engl J Med. 2011;365(22):2110–2121. doi: 10.1056/NEJMra1100359. - DOI - PubMed
    1. Akira S, Uematsu S, Takeuchi O. Pathogen recognition and innate immunity. Cell. 2006;124(4):783–801. doi: 10.1016/j.cell.2006.02.015. - DOI - PubMed
    1. Niewold TB, Hua J, Lehman TJ, Harley JB, Crow MK. High serum IFN-alpha activity is a heritable risk factor for systemic lupus erythematosus. Genes Immun. 2007;8(6):492–502. doi: 10.1038/sj.gene.6364408. - DOI - PMC - PubMed
    1. International Consortium for Systemic Lupus Erythematosus Genetics (SLEGEN) et al. Genome-wide association scan in women with systemic lupus erythematosus identifies susceptibility variants in ITGAM, PXK, KIAA1542 and other loci. Nat Genet. 2008;40(2):204–210. doi: 10.1038/ng.81. - DOI - PMC - PubMed
    1. Hom G, et al. Association of systemic lupus erythematosus with C8orf13-BLK and ITGAM-ITGAX. N Engl J Med. 2008;358(9):900–909. doi: 10.1056/NEJMoa0707865. - DOI - PubMed

MeSH terms