

Optical Coherence Tomography and Glaucoma Progression: A Comparison of a Region of Interest Approach to Average Retinal Nerve Fiber Layer Thickness
- PMID: 28263263
- PMCID: PMC5407925
- DOI: 10.1097/IJG.0000000000000654
Optical Coherence Tomography and Glaucoma Progression: A Comparison of a Region of Interest Approach to Average Retinal Nerve Fiber Layer Thickness
Abstract
Purpose: To determine whether the change in the retinal nerve fiber layer (RNFL) thickness in a region of interest (ROI) is a better measure of glaucoma progression than the change in average circumpapillary (cp) RNFL thickness.
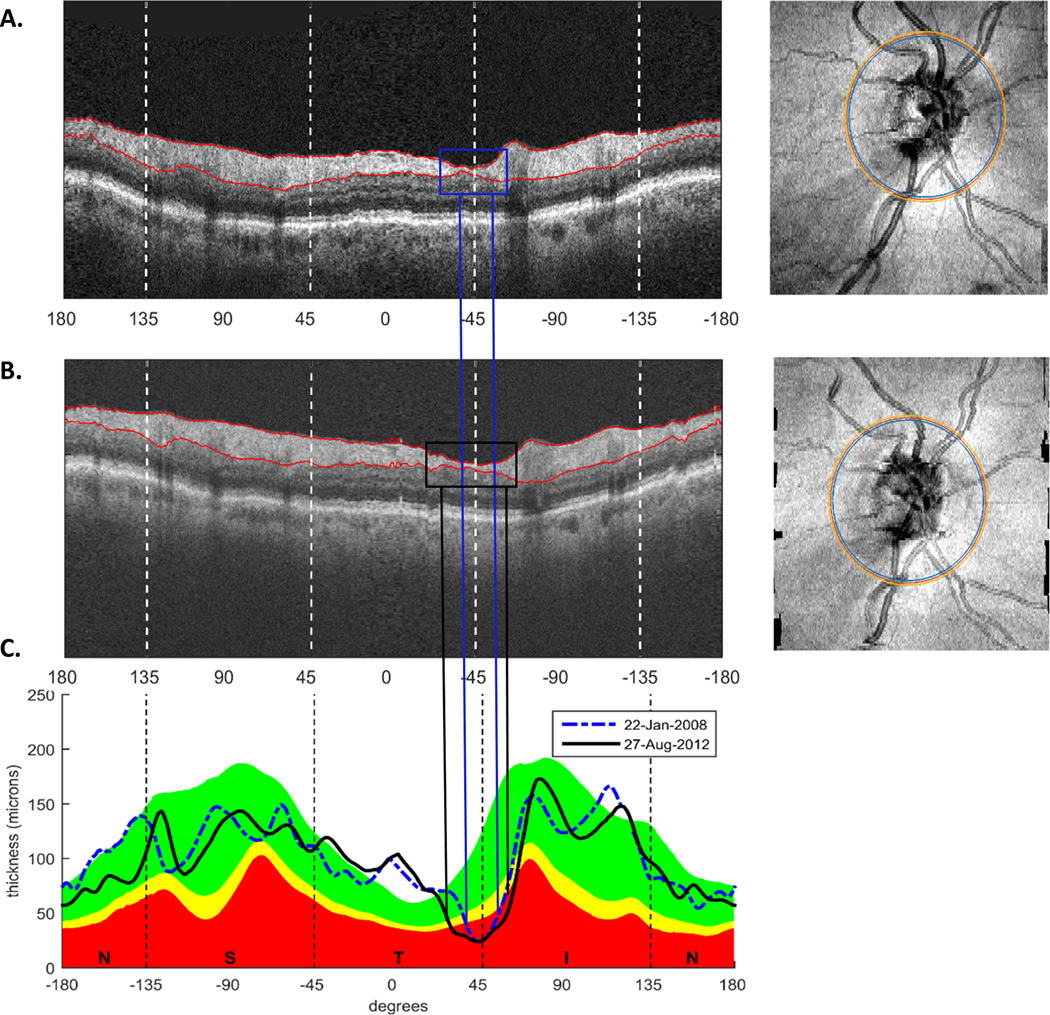
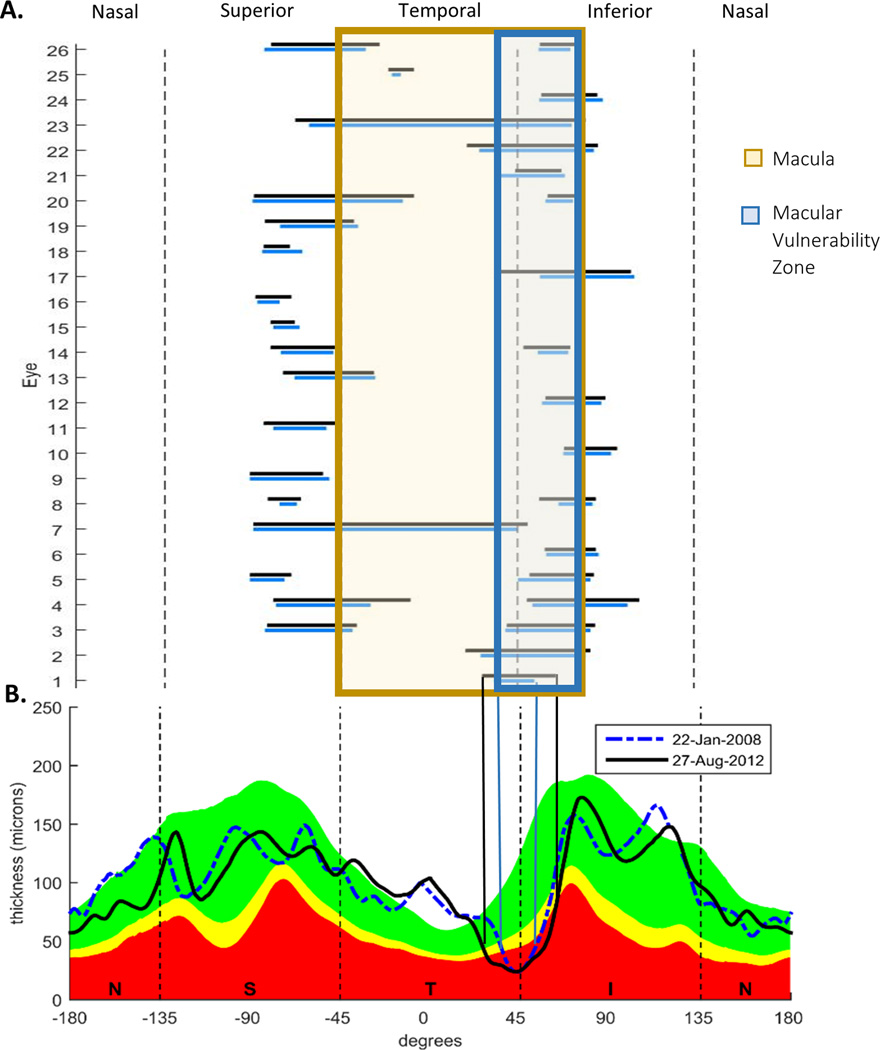
Methods: Disc cube scans were obtained with frequency domain optical coherence tomography from 60 eyes of 60 patients (age, 61.7±12.7 y) with early or suspected glaucoma and controlled intraocular pressure. The average time between 2 test dates was 3.2±1.8 years. En-face images of the scans from the 2 tests were aligned based on the blood vessels, and cp images were derived for an annulus 100 μm wide and 3.4 mm in diameter, centered on the disc. An ROI was defined as the portion of the circumpapillary retinal nerve fiber layer (cpRNFL) plot within the temporal disc that extended below the 1% confidence interval for ≥5 degrees. Trend analysis using multilevel mixed-effects models was used to compare the rates of change between ROI width and average cpRNFL thickness.
Results: In total, 26 of the 60 eyes had a total of 33 ROIs. The ROI width significantly increased between the 2 test dates (median, 4.9 degrees; Q1=1.03 degrees, Q3=10.5 degrees). In comparison, the average cpRNFL thickness did not decrease significantly over the same period (median, -0.7 μm; Q1=-2.7 μm, Q3=2.7 μm). Mixed-effects linear models confirmed significant ROI progression (P=0.015), but not average cpRNFL (P=0.878).
Conclusions: In this population, RNFL thinning in a ROI is a better measure of progression than is average cpRNFL thickness change.
Figures
Similar articles
-
A Region-of-Interest Approach for Detecting Progression of Glaucomatous Damage With Optical Coherence Tomography.JAMA Ophthalmol. 2015 Dec;133(12):1438-44. doi: 10.1001/jamaophthalmol.2015.3871. JAMA Ophthalmol. 2015. PMID: 26502216 Free PMC article.
-
Local Glaucomatous Defects of the Circumpapillary Retinal Nerve Fiber Layer Show a Variety of Patterns of Progression.J Glaucoma. 2020 Oct;29(10):857-863. doi: 10.1097/IJG.0000000000001620. J Glaucoma. 2020. PMID: 33003174 Free PMC article.
-
Comparison of Longitudinal Changes in Functional and Structural Measures for Evaluating Progression of Glaucomatous Optic Neuropathy.Invest Ophthalmol Vis Sci. 2015 Aug;56(9):5477-84. doi: 10.1167/iovs.15-16704. Invest Ophthalmol Vis Sci. 2015. PMID: 26284553
-
Evaluation of Retinal Nerve Fiber Layer Thickness and Ganglion Cell Complex Progression Rates in Healthy, Ocular Hypertensive, and Glaucoma Eyes With the Avanti RTVue-XR Optical Coherence Tomograph Based on 5-Year Follow-up.J Glaucoma. 2016 Oct;25(10):e905-e909. doi: 10.1097/IJG.0000000000000410. J Glaucoma. 2016. PMID: 26950575
-
Rates of Local Retinal Nerve Fiber Layer Thinning before and after Disc Hemorrhage in Glaucoma.Ophthalmology. 2017 Sep;124(9):1403-1411. doi: 10.1016/j.ophtha.2017.03.059. Epub 2017 May 9. Ophthalmology. 2017. PMID: 28499748 Free PMC article.
Cited by
-
Evaluation of a Region-of-Interest Approach for Detecting Progressive Glaucomatous Macular Damage on Optical Coherence Tomography.Transl Vis Sci Technol. 2018 Mar 29;7(2):14. doi: 10.1167/tvst.7.2.14. eCollection 2018 Apr. Transl Vis Sci Technol. 2018. PMID: 29616153 Free PMC article.
-
Individualized Glaucoma Change Detection Using Deep Learning Auto Encoder-Based Regions of Interest.Transl Vis Sci Technol. 2021 Jul 1;10(8):19. doi: 10.1167/tvst.10.8.19. Transl Vis Sci Technol. 2021. PMID: 34293095 Free PMC article.
-
Deep Learning-Assisted Detection of Glaucoma Progression in Spectral-Domain OCT.Ophthalmol Glaucoma. 2023 May-Jun;6(3):228-238. doi: 10.1016/j.ogla.2022.11.004. Epub 2022 Nov 18. Ophthalmol Glaucoma. 2023. PMID: 36410708 Free PMC article.
-
Sample Size Requirements of Glaucoma Clinical Trials When Using Combined Optical Coherence Tomography and Visual Field Endpoints.Sci Rep. 2019 Dec 11;9(1):18886. doi: 10.1038/s41598-019-55345-x. Sci Rep. 2019. PMID: 31827169 Free PMC article.
-
Combining Optical Coherence Tomography and Optical Coherence Tomography Angiography Longitudinal Data for the Detection of Visual Field Progression in Glaucoma.Am J Ophthalmol. 2023 Feb;246:141-154. doi: 10.1016/j.ajo.2022.10.016. Epub 2022 Nov 1. Am J Ophthalmol. 2023. PMID: 36328200 Free PMC article.
References
-
- Ernest PJ, Schouten JS, Beckers HJ, et al. An evidence-based review of prognostic factors for glaucomatous visual field progression. Ophthalmology. 2013:512–519. - PubMed
-
- Suh MH, Park KH, Kim H, et al. Glaucoma progression after the first-detected optic disc hemorrhage by optical coherence tomography. J Glaucoma. 2012:358–366. - PubMed
-
- De Moraes CG, Demirel S, Gardiner SK, et al. Rate of visual field progression in eyes with optic disc hemorrhages in the ocular hypertension treatment study. Arch Ophthalmol. 2012:1541–1546. - PubMed
MeSH terms
Grants and funding
LinkOut - more resources
Full Text Sources
Other Literature Sources
Medical
Research Materials
Miscellaneous
